| Param | Original file | Final file |
|---|---|---|
| Filename | modeM0/AS1G07_053T01_9000001566_10813cztM0_level2.evt | modeM0/AS1G07_053T01_9000001566_10813cztM0_level2_quad_clean.evt |
| Size (bytes) | 613,955,520 | 81,504,000 |
| Size | 585.5 MB | 77.7 MB |
| Events in quadrant A | 6,076,392 | 431,271 |
| Events in quadrant B | 5,257,089 | 547,909 |
| Events in quadrant C | 2,782,067 | 555,120 |
| Events in quadrant D | 4,071,478 | 513,670 |
| Mode SS | |||
|---|---|---|---|
| Quadrant | BADHDUFLAG | Total packets | Discarded packets |
| A | 0 | 122 | 0 |
| B | 0 | 122 | 0 |
| C | 0 | 122 | 2 |
| D | 0 | 122 | 0 |
| Mode M9 | |||
|---|---|---|---|
| Quadrant | BADHDUFLAG | Total packets | Discarded packets |
| A | 0 | 12 | 0 |
| B | 0 | 12 | 0 |
| C | 0 | 12 | 0 |
| D | 0 | 12 | 0 |
| Mode M0 | |||
|---|---|---|---|
| Quadrant | BADHDUFLAG | Total packets | Discarded packets |
| A | 0 | 22199 | 38 |
| B | 0 | 19639 | 28 |
| C | 0 | 12466 | 17 |
| D | 0 | 16178 | 59 |
| Quadrant | Total seconds | Saturated seconds | Saturation percentage |
|---|---|---|---|
| A | 6007 | 1411 | 23.489263% |
| B | 6007 | 745 | 12.402197% |
| C | 6008 | 34 | 0.565912% |
| D | 6002 | 244 | 4.065312% |
Noise dominated data is calculated using 1-second bins in cleaned event files. If a bin has >2000 counts, and if more than 50% of those come from <1% of pixels, then it is considered to be noise-dominated and hence unusable.
| Quadrant | # 1 sec bins | Bins with >0 counts | Bins with >2000 counts | High rate bins dominated by noise | Noise dominated (total time) | Noise dominated (detector-on time) | Marked lightcurve |
|---|---|---|---|---|---|---|---|
| A | 7205 | 6015 | 828 | 828 | 11.49% | 13.77% | 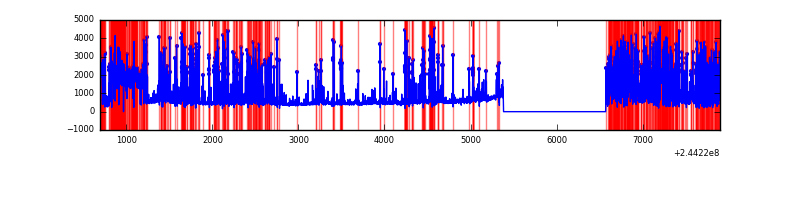 |
| B | 7206 | 6016 | 447 | 447 | 6.20% | 7.43% | 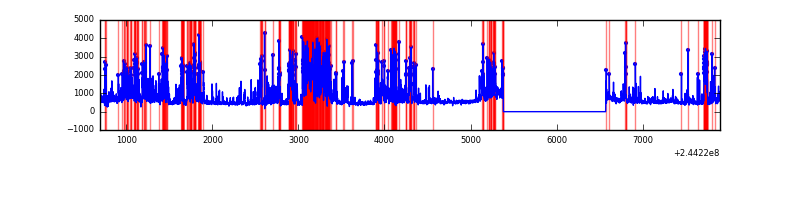 |
| C | 7206 | 6015 | 2 | 2 | 0.03% | 0.03% | 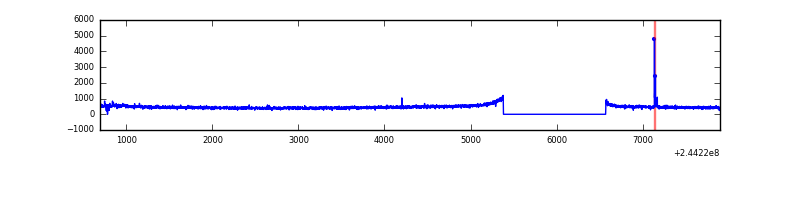 |
| D | 7206 | 6016 | 178 | 178 | 2.47% | 2.96% | 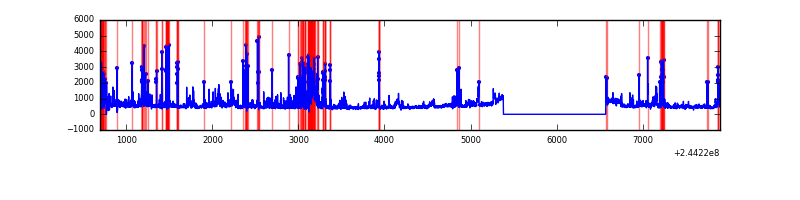 |
Top three noisy pixels from each quadrant. If the there are fewer than three noisy pixels in the level2.evt file, extra rows are filled as -1
| Pixel properties | Quadrant properties | ||||||
|---|---|---|---|---|---|---|---|
| Quadrant | DetID | PixID | Counts | Sigma | Mean | Median | Sigma |
| A | 8 | 5 | 3528583 | 27541.91 | 628 | 618 | 128.1 |
| A | 4 | 2 | 90980 | 705.43 | 628 | 618 | 128.1 |
| A | 15 | 174 | 14074 | 105.05 | 628 | 618 | 128.1 |
| B | 4 | 239 | 1474957 | 10948.49 | 712 | 698 | 134.7 |
| B | 0 | 85 | 548096 | 4065.22 | 712 | 698 | 134.7 |
| B | 15 | 204 | 336560 | 2494.26 | 712 | 698 | 134.7 |
| C | 0 | 207 | 25563 | 151.1 | 706 | 713 | 164.5 |
| C | 13 | 61 | 5413 | 28.58 | 706 | 713 | 164.5 |
| C | 8 | 222 | 2800 | 12.69 | 706 | 713 | 164.5 |
| D | 12 | 233 | 305355 | 1816.94 | 692 | 674 | 167.7 |
| D | 1 | 52 | 210861 | 1253.43 | 692 | 674 | 167.7 |
| D | 10 | 199 | 153273 | 910.01 | 692 | 674 | 167.7 |
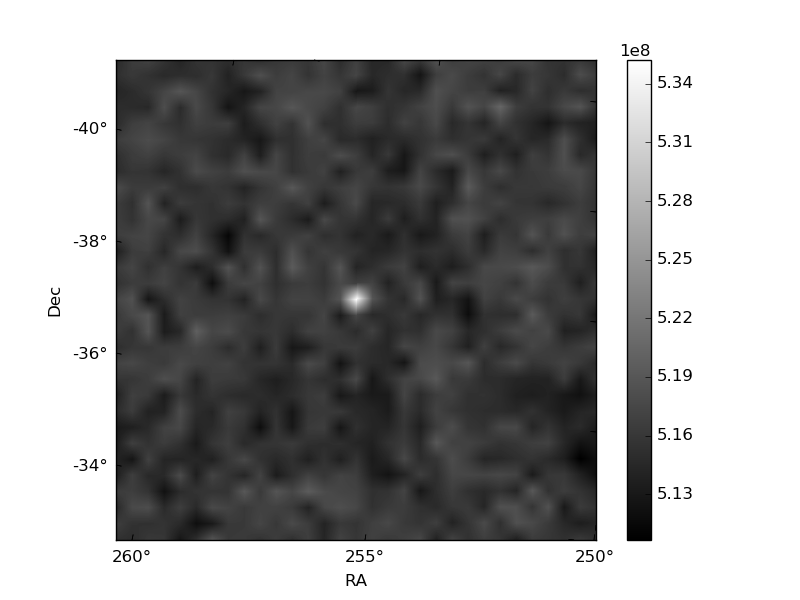
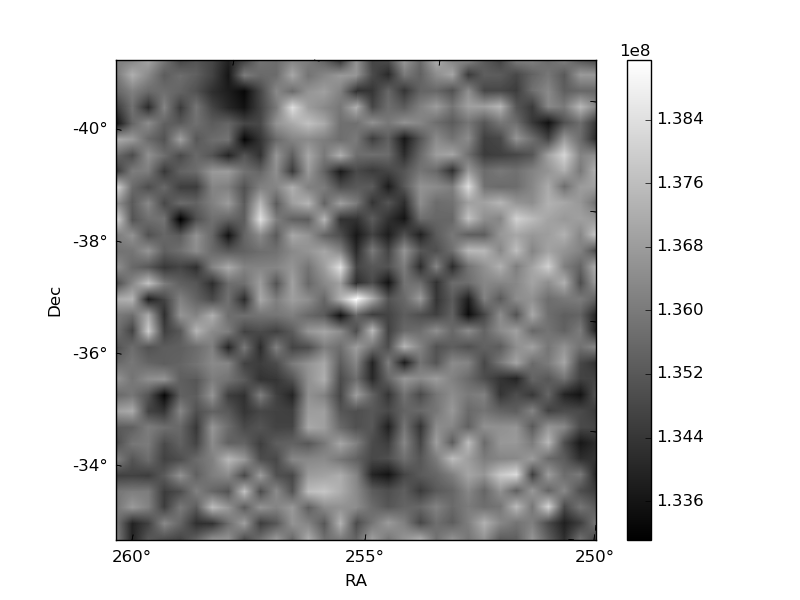
Histogram calculated using DETX and DETY for each event in the final _common_clean file
| Quadrant A | 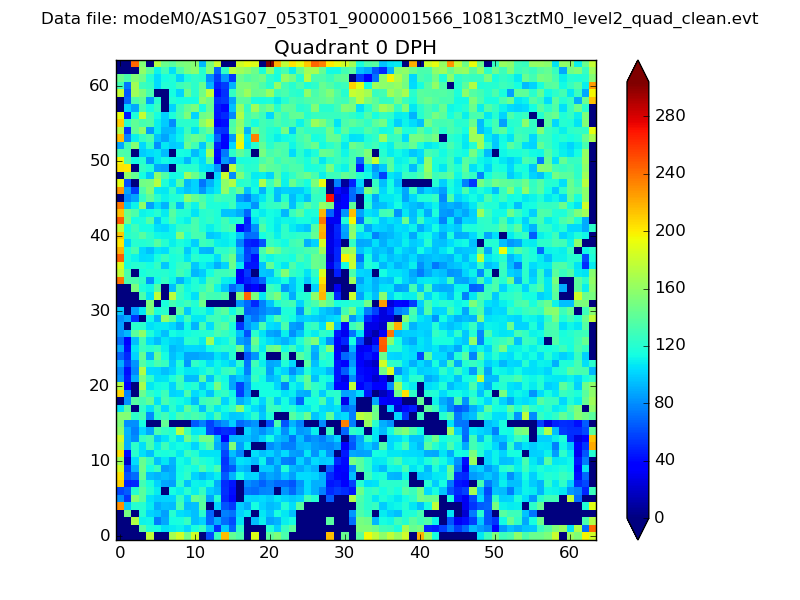 |
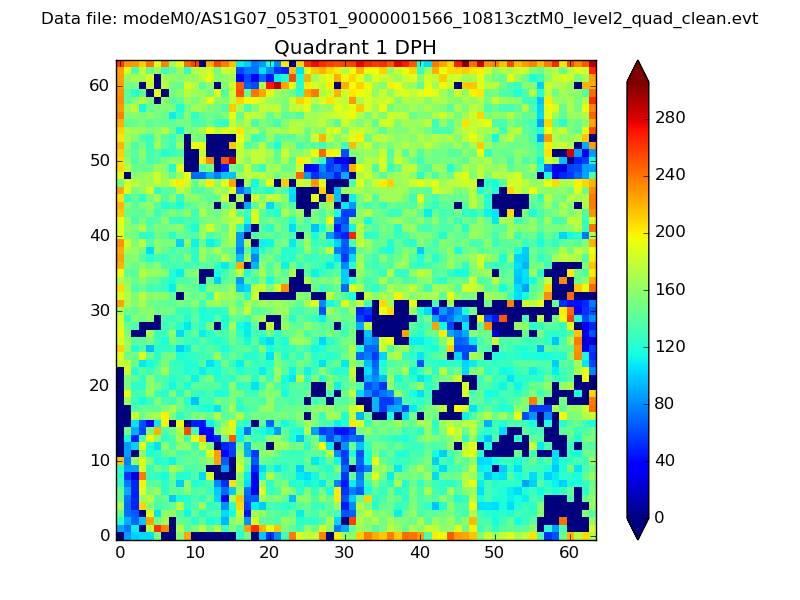 |
Quadrant B |
|---|---|---|---|
| Quadrant D | 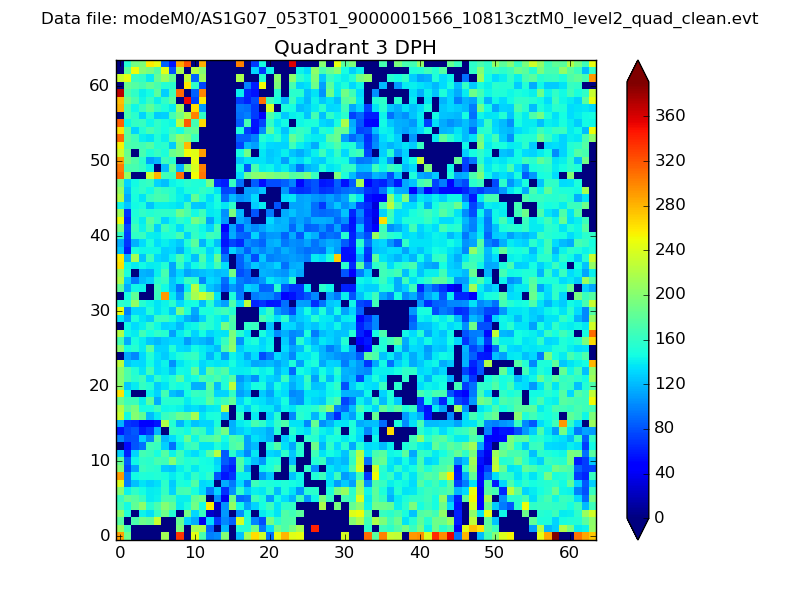 |
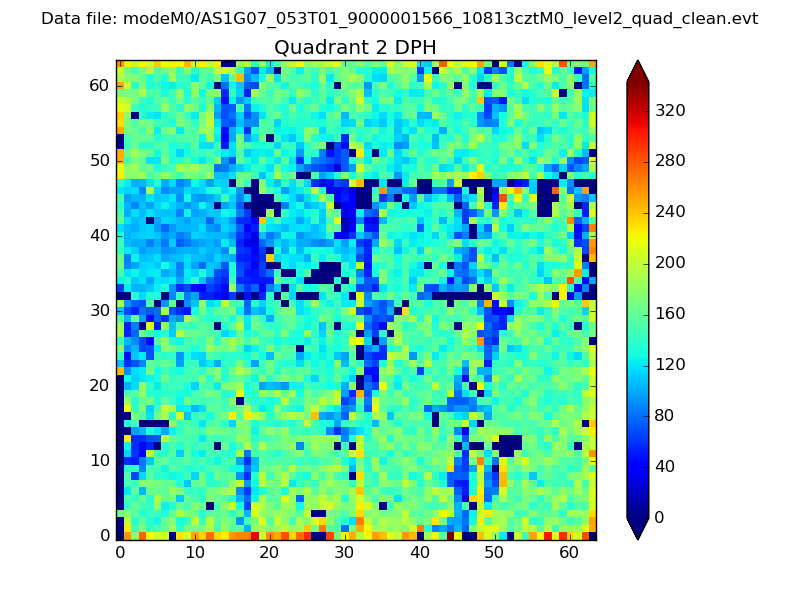 |
Quadrant C |
| Plot type | Count rate plots | Images |
|---|---|---|
| Comparison with Poisson distribution Blue bars denote a histogram of data divided into 1 sec bins. Red curve is a Poisson curve with rate = median count rate of data. |
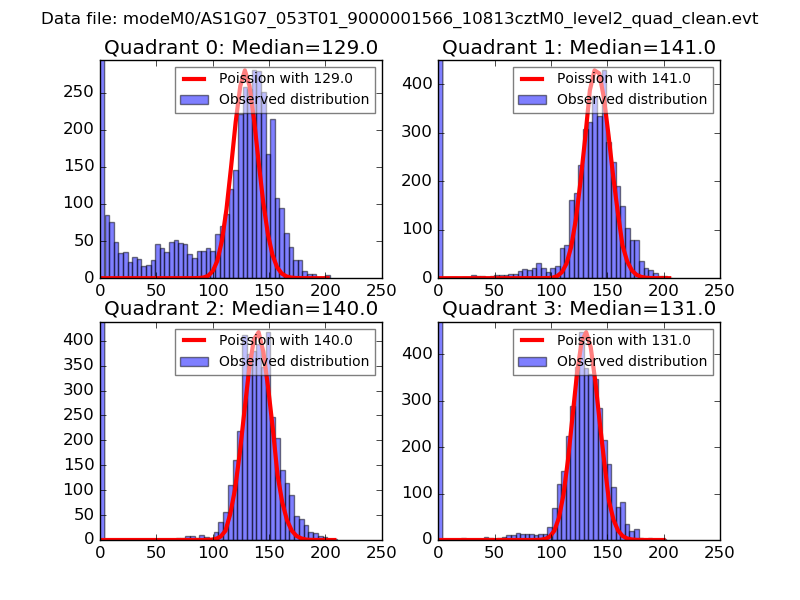 |
 |
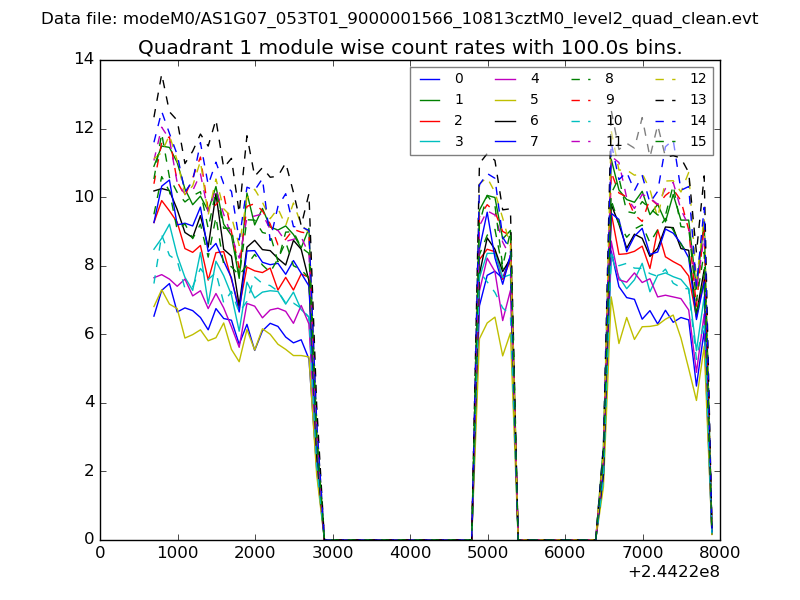
| Quadrant-wise count rates Data is divided into 100 sec bins |
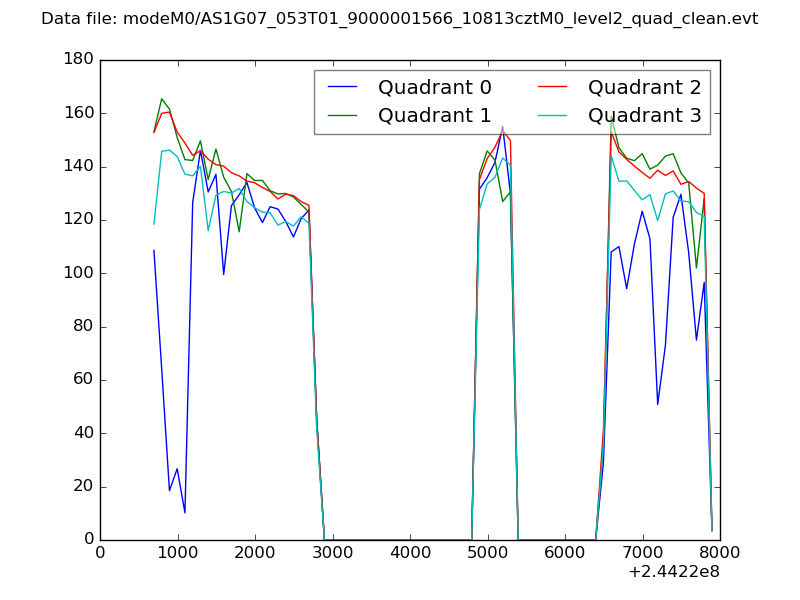 |
|
| Module-wise count rates for Quadrant A Data is divided into 100 sec bins |
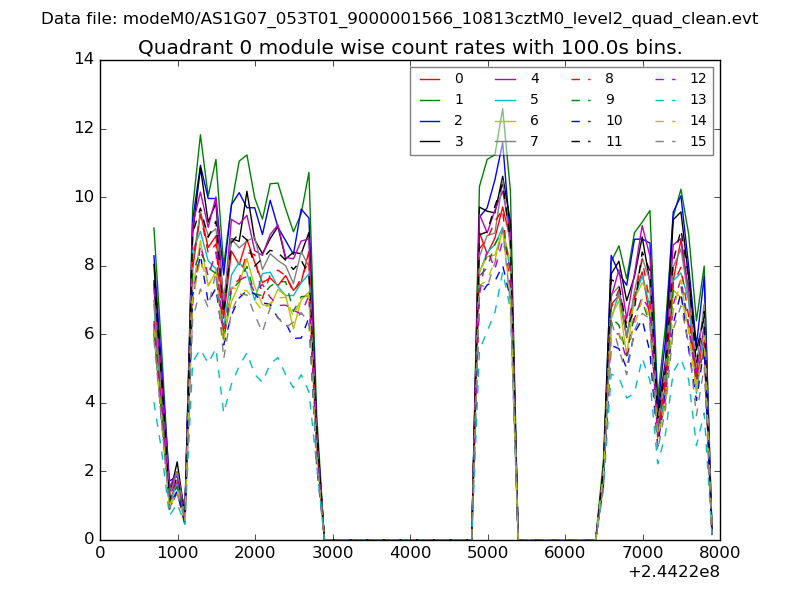 |
 |
| Module-wise count rates for Quadrant B Data is divided into 100 sec bins |
 |
 |
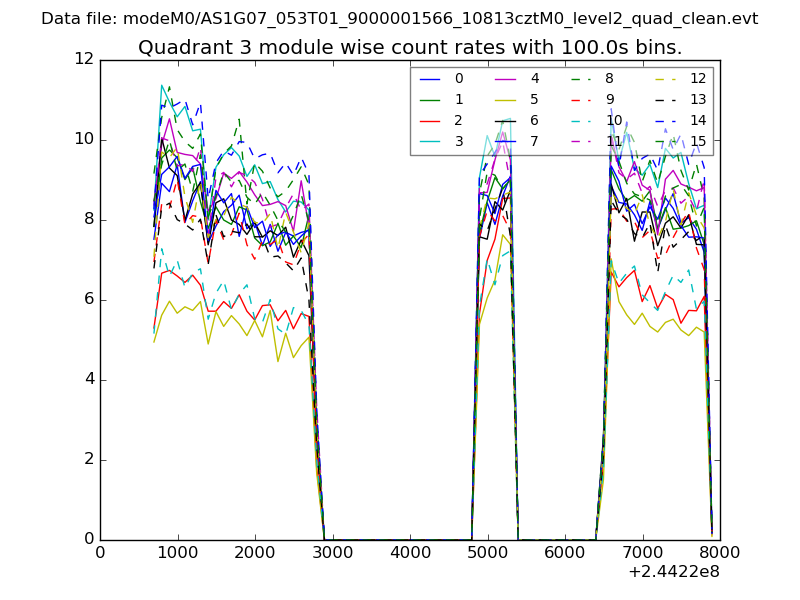
| Module-wise count rates for Quadrant C Data is divided into 100 sec bins |
 |
 |
| Module-wise count rates for Quadrant D Data is divided into 100 sec bins |
 |
 |
| Parameter | Plot |
|---|---|
| CZT HV Monitor |  |
| D_VDD | 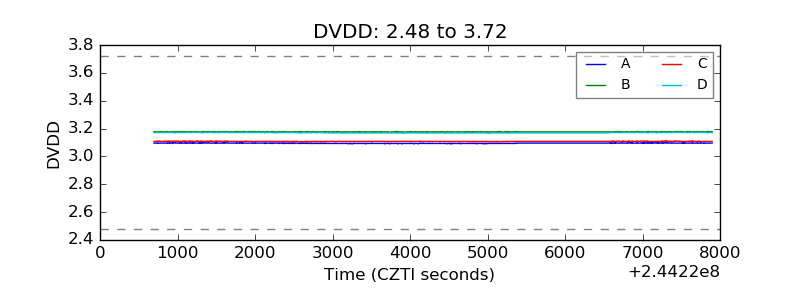 |
| Temperature 1 | 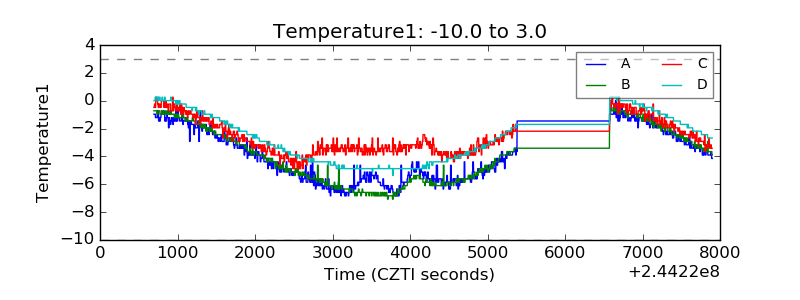 |
| Veto HV Monitor | 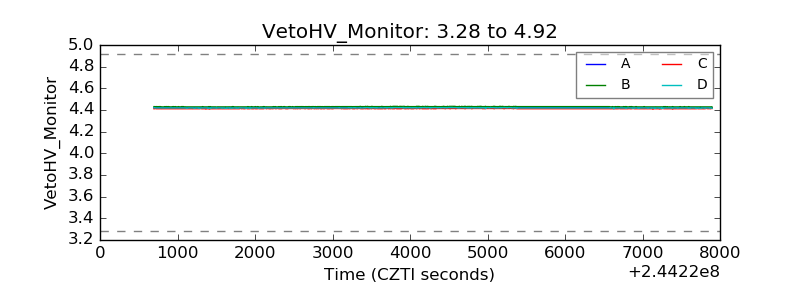 |
| Veto LLD | 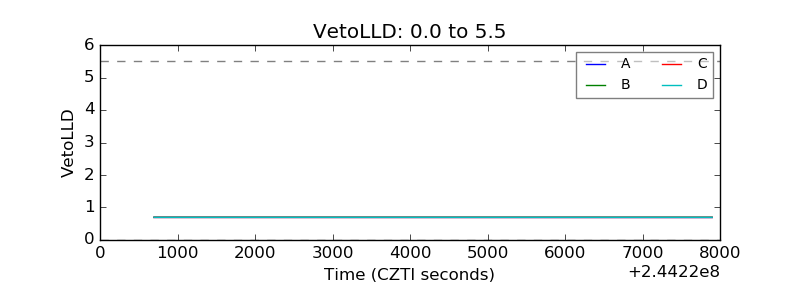 |
| Alpha Counter | 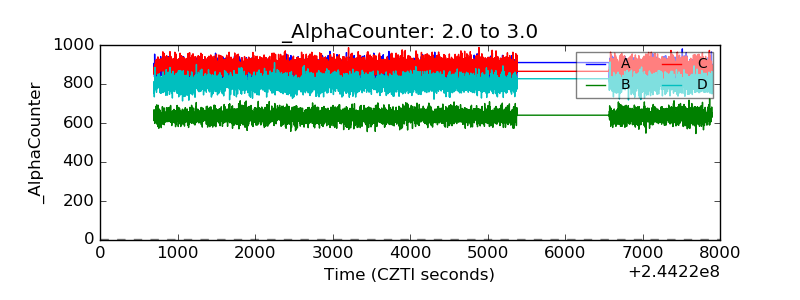 |
| _CPM_Rate | 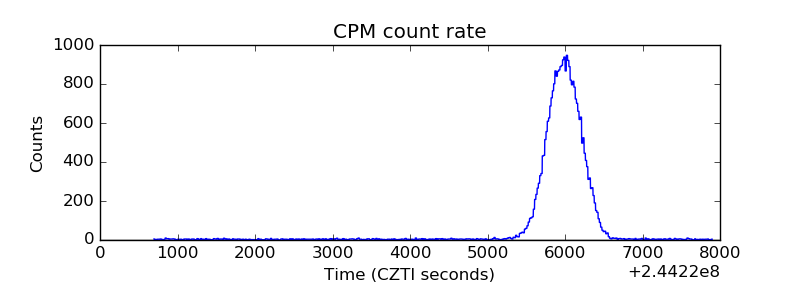 |
| CZT Counter | 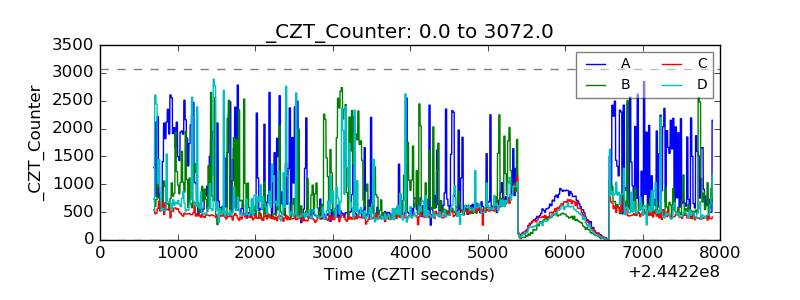 |
| +2.5 Volts monitor | 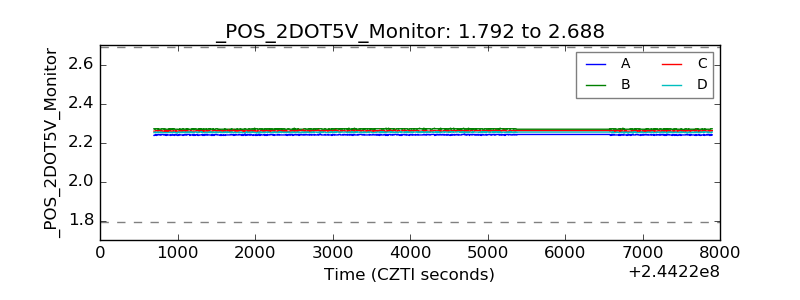 |
| +5 Volts monitor | 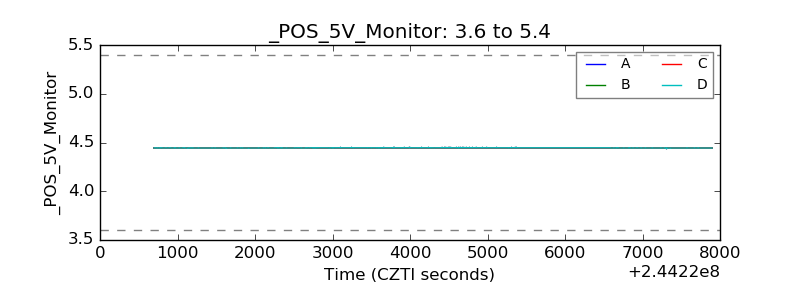 |
| _ROLL_ROT | 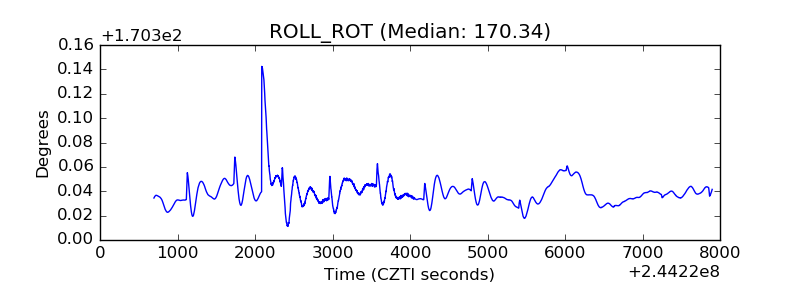 |
| _Roll_DEC | 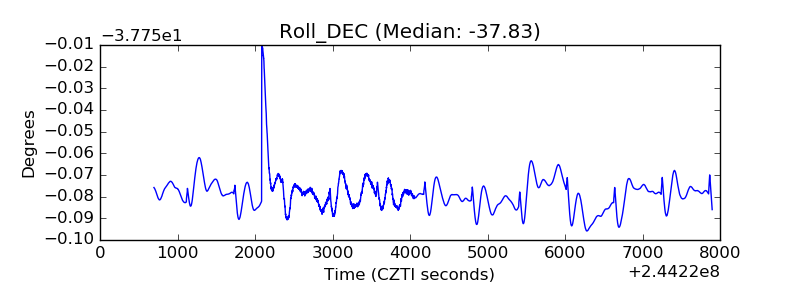 |
| _Roll_RA |  |
| Veto Counter | 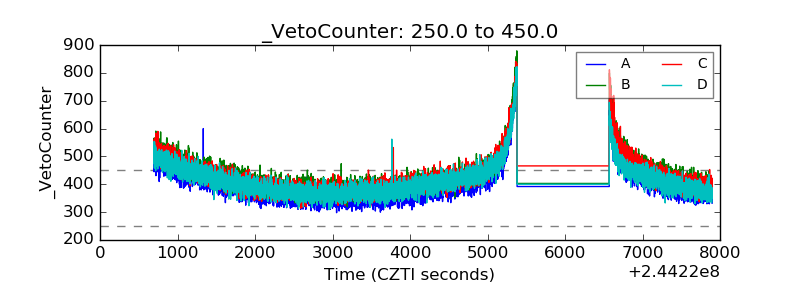 |