| Param | Original file | Final file |
|---|---|---|
| Filename | modeM0/AS1G07_053T01_9000001566_10814cztM0_level2.evt | modeM0/AS1G07_053T01_9000001566_10814cztM0_level2_quad_clean.evt |
| Size (bytes) | 630,037,440 | 80,455,680 |
| Size | 600.9 MB | 76.7 MB |
| Events in quadrant A | 7,436,333 | 437,801 |
| Events in quadrant B | 4,764,492 | 531,720 |
| Events in quadrant C | 2,757,889 | 540,350 |
| Events in quadrant D | 3,710,899 | 501,721 |
| Mode SS | |||
|---|---|---|---|
| Quadrant | BADHDUFLAG | Total packets | Discarded packets |
| A | 0 | 122 | 0 |
| B | 0 | 122 | 0 |
| C | 0 | 122 | 0 |
| D | 0 | 122 | 0 |
| Mode M9 | |||
|---|---|---|---|
| Quadrant | BADHDUFLAG | Total packets | Discarded packets |
| A | 0 | 11 | 0 |
| B | 0 | 11 | 0 |
| C | 0 | 11 | 0 |
| D | 0 | 11 | 0 |
| Mode M0 | |||
|---|---|---|---|
| Quadrant | BADHDUFLAG | Total packets | Discarded packets |
| A | 0 | 26304 | 2 |
| B | 0 | 18256 | 1 |
| C | 0 | 12572 | 1 |
| D | 0 | 15218 | 1 |
| Quadrant | Total seconds | Saturated seconds | Saturation percentage |
|---|---|---|---|
| A | 6076 | 1882 | 30.974325% |
| B | 6076 | 460 | 7.570770% |
| C | 6076 | 21 | 0.345622% |
| D | 6076 | 160 | 2.633311% |
Noise dominated data is calculated using 1-second bins in cleaned event files. If a bin has >2000 counts, and if more than 50% of those come from <1% of pixels, then it is considered to be noise-dominated and hence unusable.
| Quadrant | # 1 sec bins | Bins with >0 counts | Bins with >2000 counts | High rate bins dominated by noise | Noise dominated (total time) | Noise dominated (detector-on time) | Marked lightcurve |
|---|---|---|---|---|---|---|---|
| A | 7111 | 6076 | 1236 | 1236 | 17.38% | 20.34% | 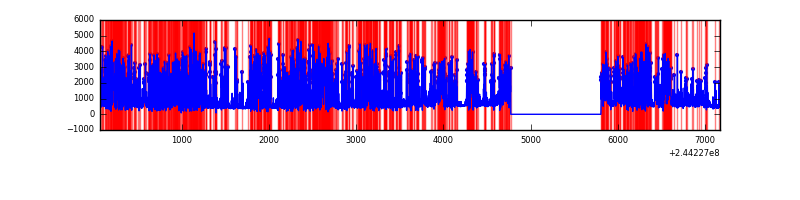 |
| B | 7111 | 6077 | 286 | 286 | 4.02% | 4.71% | 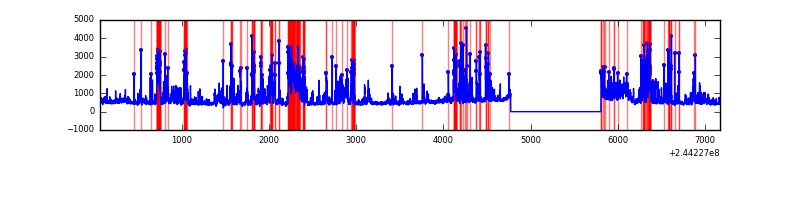 |
| C | 7111 | 6077 | 7 | 7 | 0.10% | 0.12% | 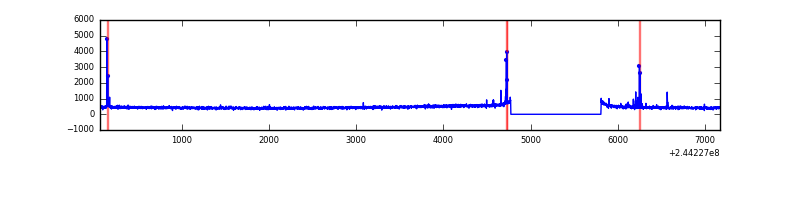 |
| D | 7111 | 6077 | 137 | 137 | 1.93% | 2.25% | 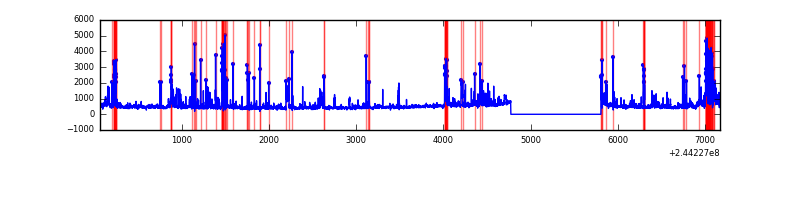 |
Top three noisy pixels from each quadrant. If the there are fewer than three noisy pixels in the level2.evt file, extra rows are filled as -1
| Pixel properties | Quadrant properties | ||||||
|---|---|---|---|---|---|---|---|
| Quadrant | DetID | PixID | Counts | Sigma | Mean | Median | Sigma |
| A | 8 | 5 | 4914769 | 40426.41 | 592 | 580 | 121.6 |
| A | 4 | 2 | 185383 | 1520.28 | 592 | 580 | 121.6 |
| A | 15 | 174 | 17156 | 136.36 | 592 | 580 | 121.6 |
| B | 4 | 239 | 1260863 | 9363.39 | 707 | 694 | 134.6 |
| B | 0 | 85 | 308712 | 2288.66 | 707 | 694 | 134.6 |
| B | 0 | 219 | 181328 | 1342.16 | 707 | 694 | 134.6 |
| C | 14 | 234 | 43756 | 268.01 | 691 | 695 | 160.7 |
| C | 0 | 207 | 18333 | 109.78 | 691 | 695 | 160.7 |
| C | 13 | 61 | 5144 | 27.69 | 691 | 695 | 160.7 |
| D | 10 | 199 | 271845 | 1632.65 | 678 | 660 | 166.1 |
| D | 1 | 52 | 169861 | 1018.66 | 678 | 660 | 166.1 |
| D | 13 | 138 | 99429 | 594.63 | 678 | 660 | 166.1 |
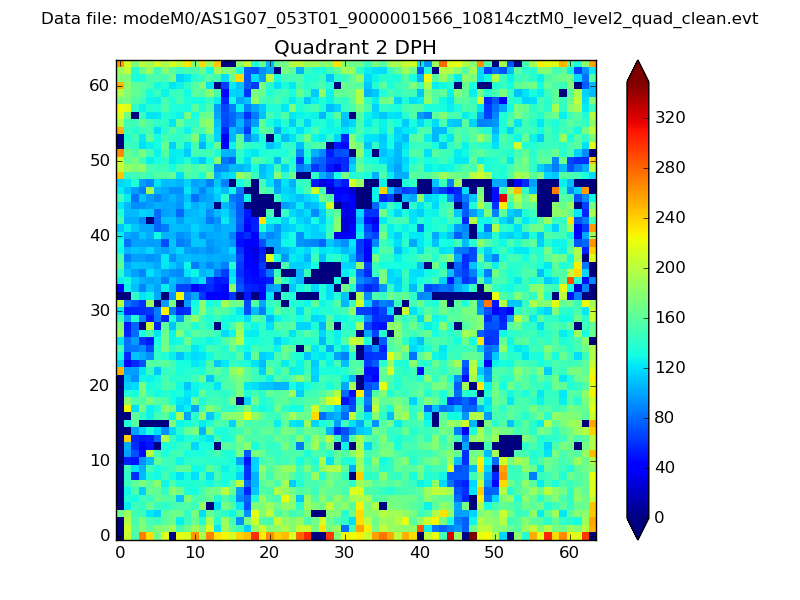
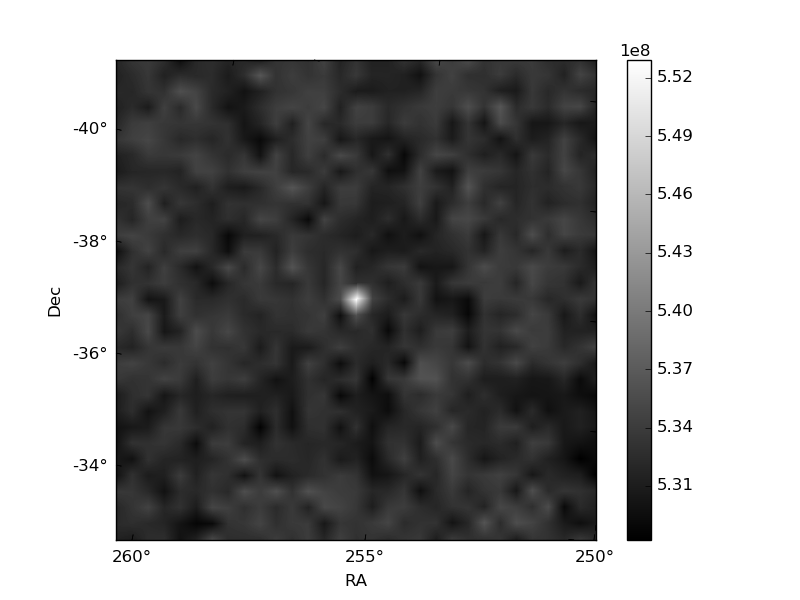
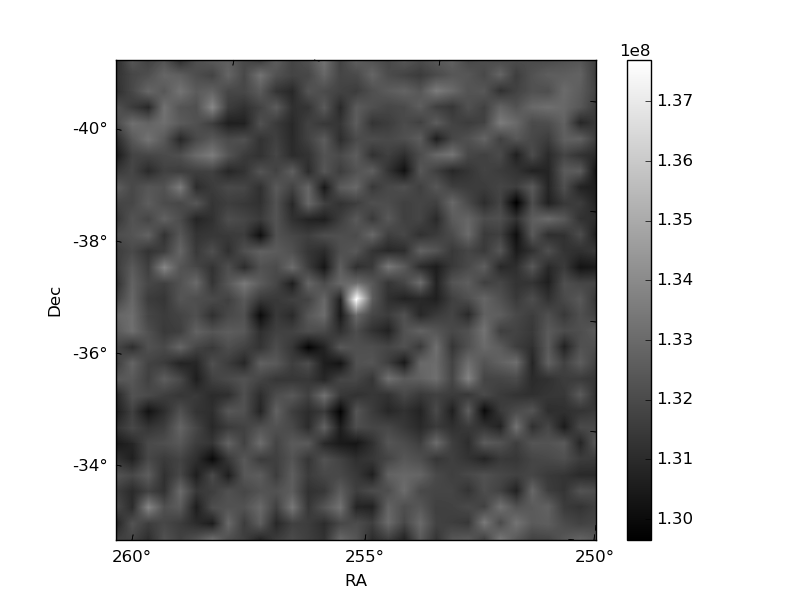
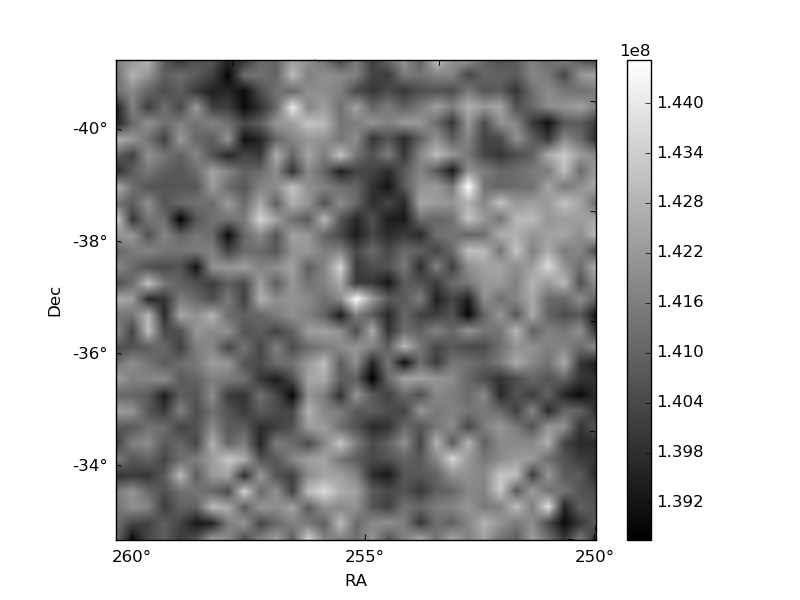
Histogram calculated using DETX and DETY for each event in the final _common_clean file
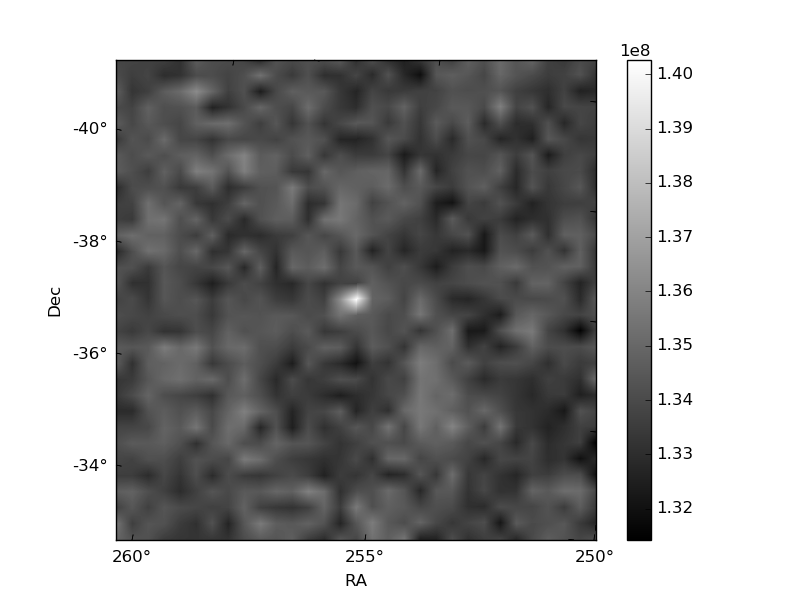
| Quadrant A | 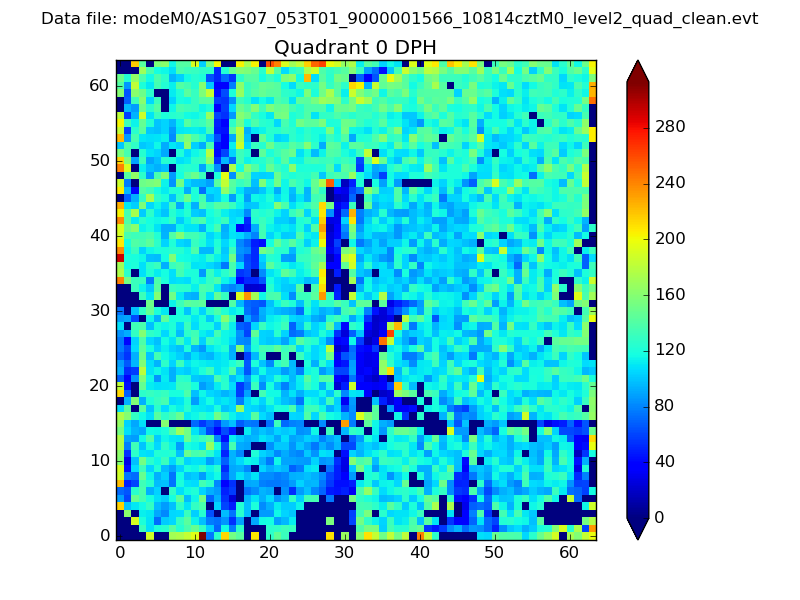 |
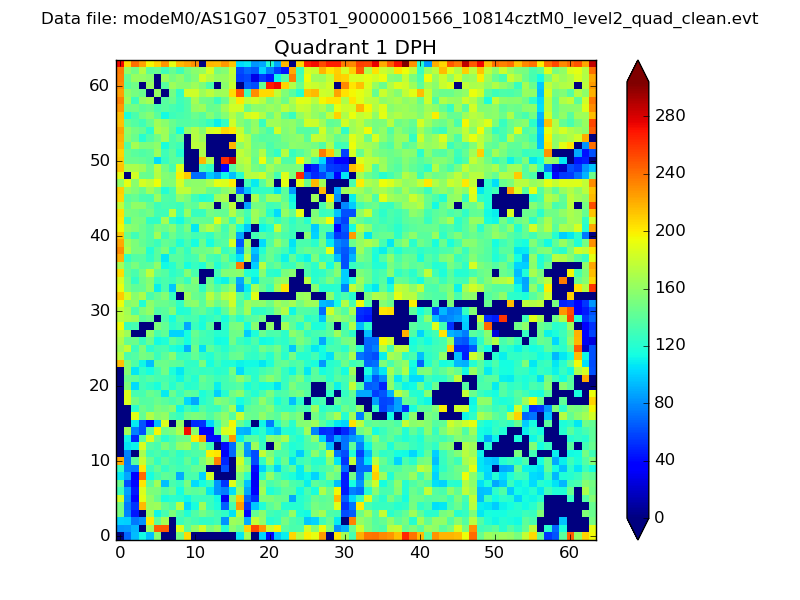 |
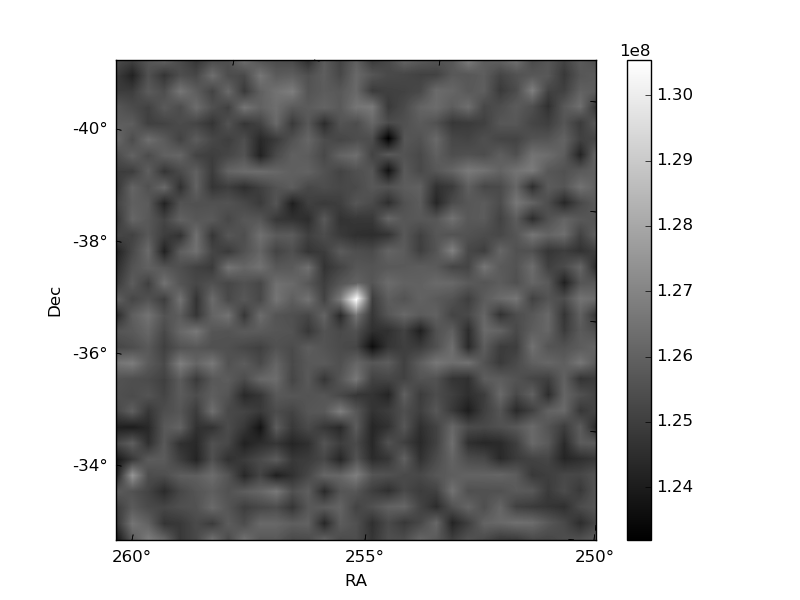
Quadrant B |
|---|---|---|---|
| Quadrant D | 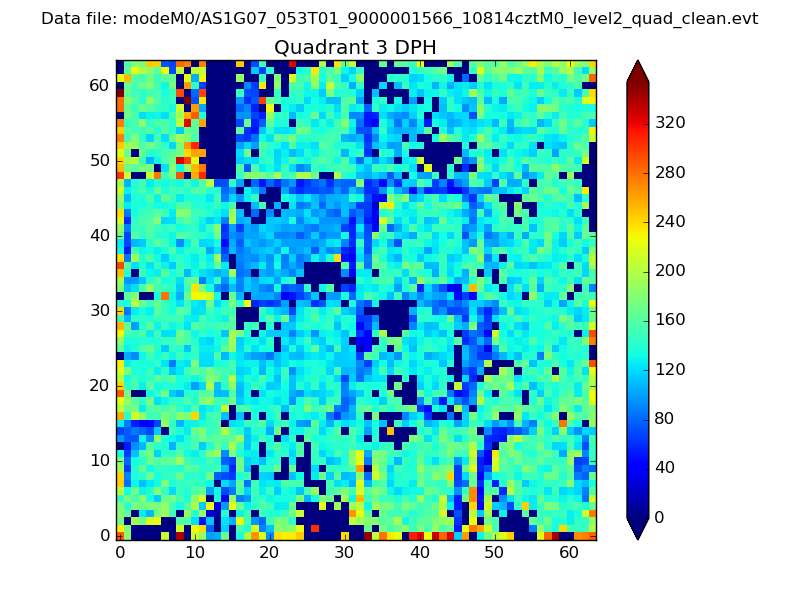 |
 |
Quadrant C |
| Plot type | Count rate plots | Images |
|---|---|---|
| Comparison with Poisson distribution Blue bars denote a histogram of data divided into 1 sec bins. Red curve is a Poisson curve with rate = median count rate of data. |
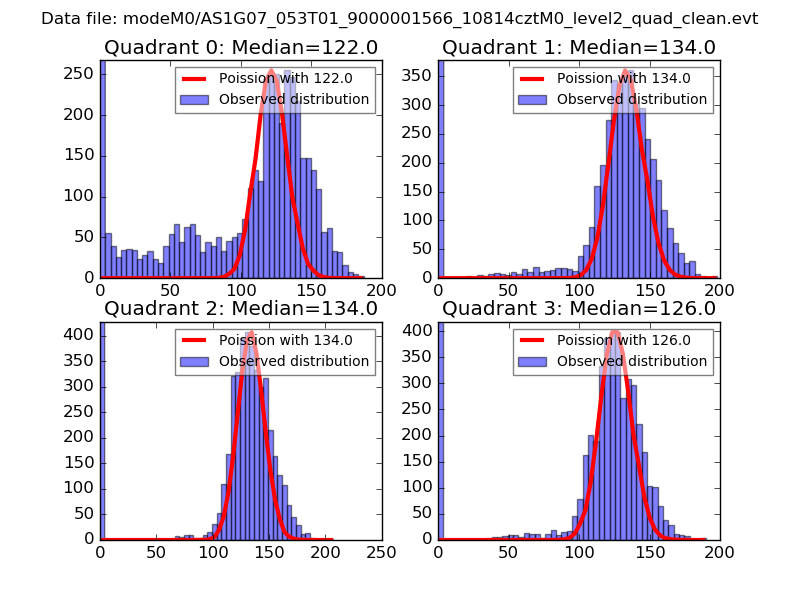 |
 |
| Quadrant-wise count rates Data is divided into 100 sec bins |
 |
|
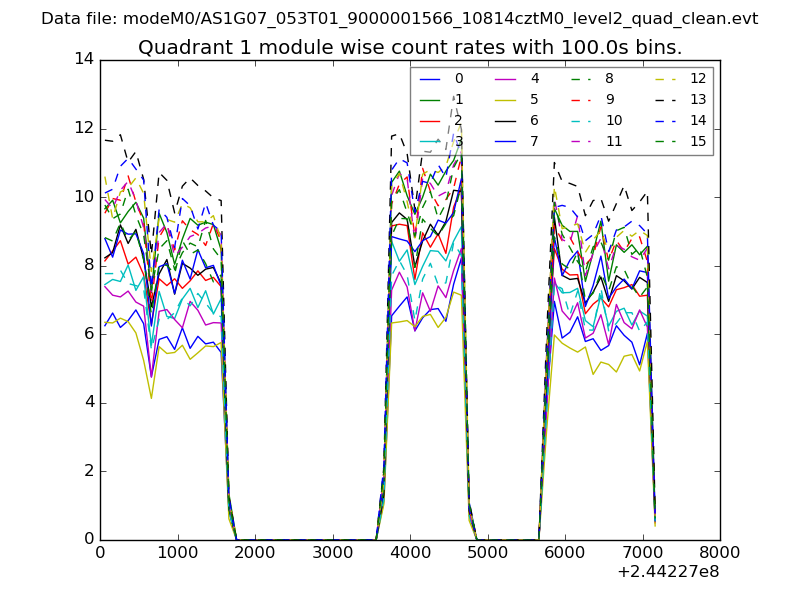
| Module-wise count rates for Quadrant A Data is divided into 100 sec bins |
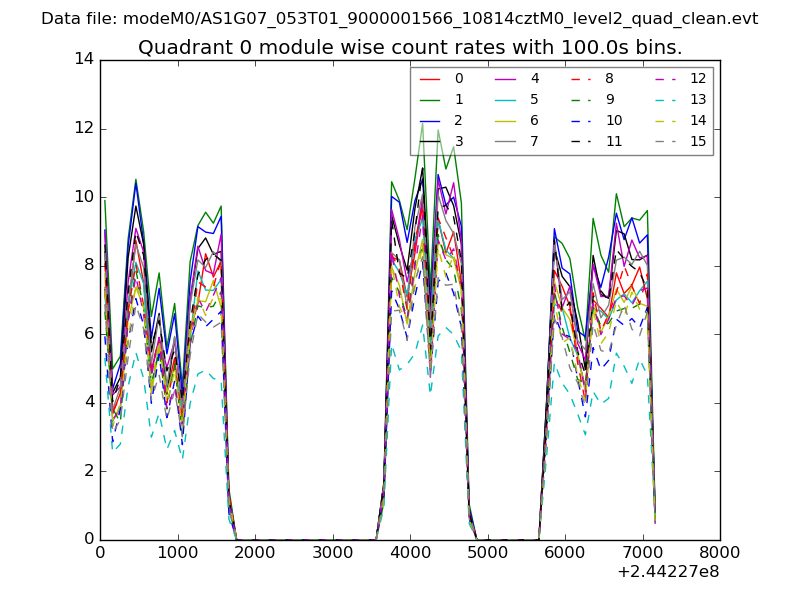 |
 |
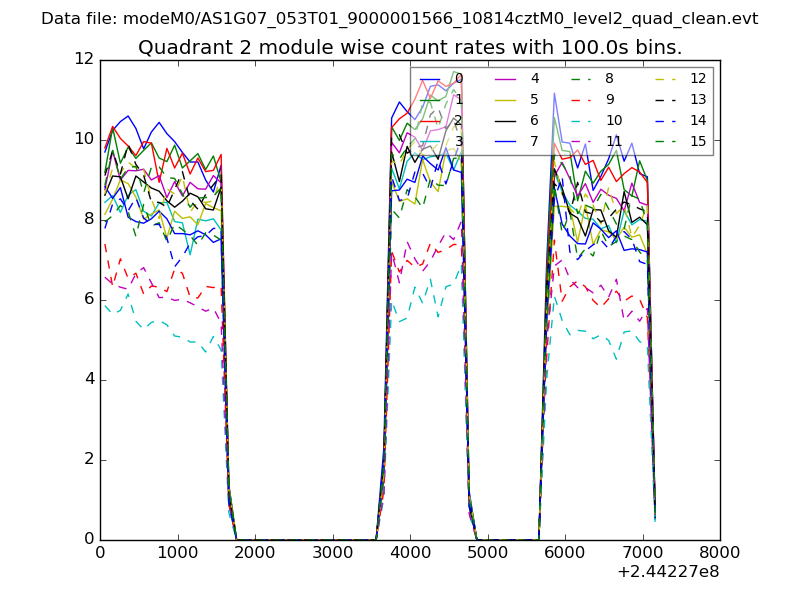
| Module-wise count rates for Quadrant B Data is divided into 100 sec bins |
 |
 |
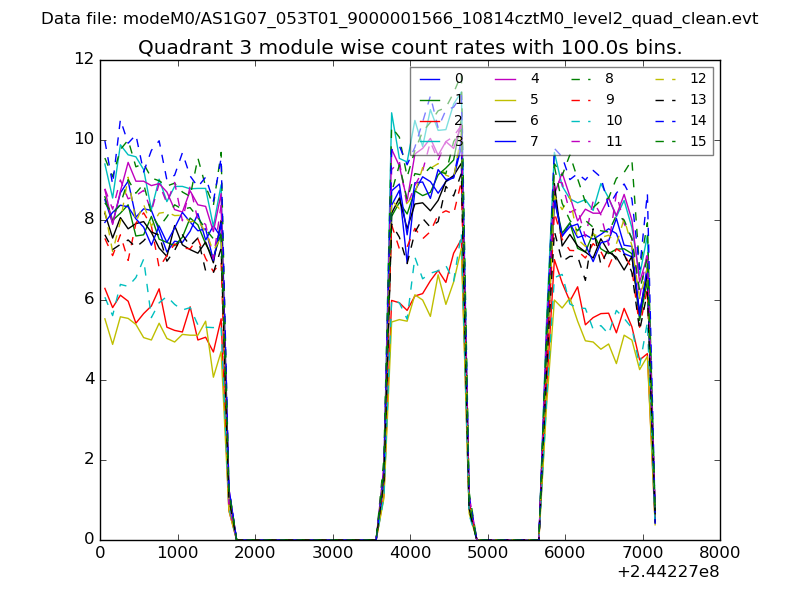
| Module-wise count rates for Quadrant C Data is divided into 100 sec bins |
 |
 |
| Module-wise count rates for Quadrant D Data is divided into 100 sec bins |
 |
 |
| Parameter | Plot |
|---|---|
| CZT HV Monitor |  |
| D_VDD |  |
| Temperature 1 | 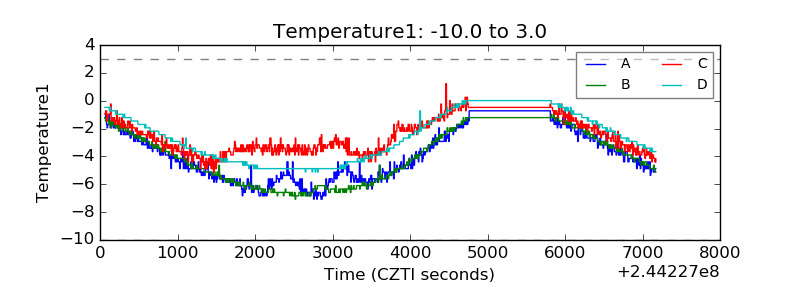 |
| Veto HV Monitor | 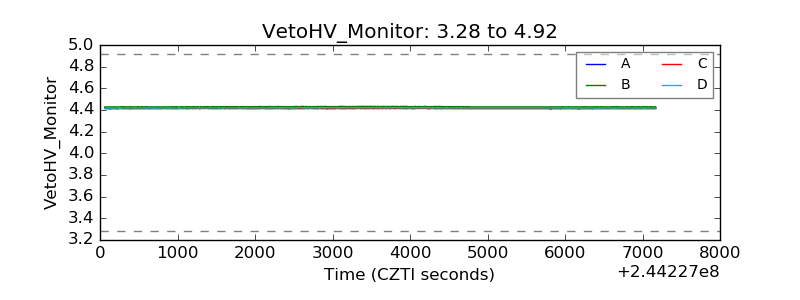 |
| Veto LLD | 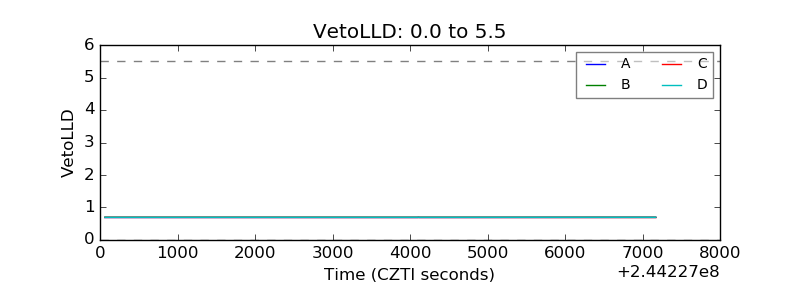 |
| Alpha Counter | 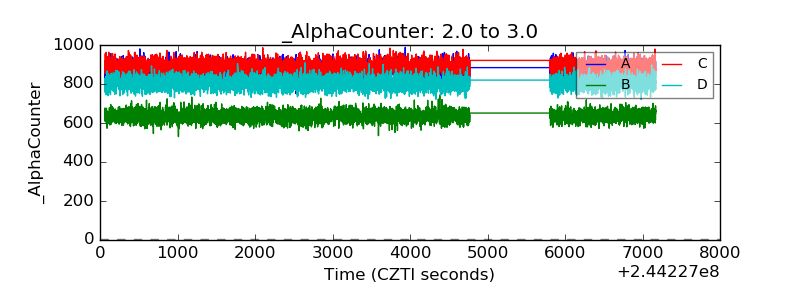 |
| _CPM_Rate | 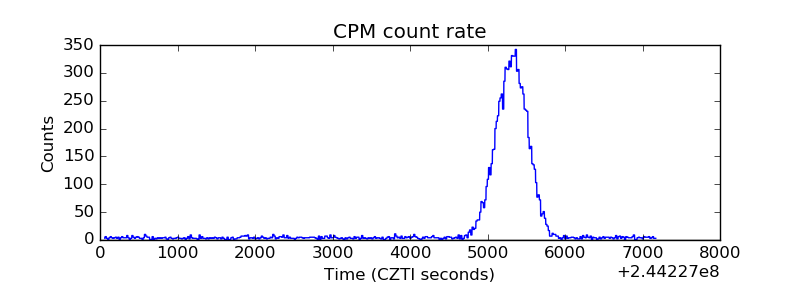 |
| CZT Counter | 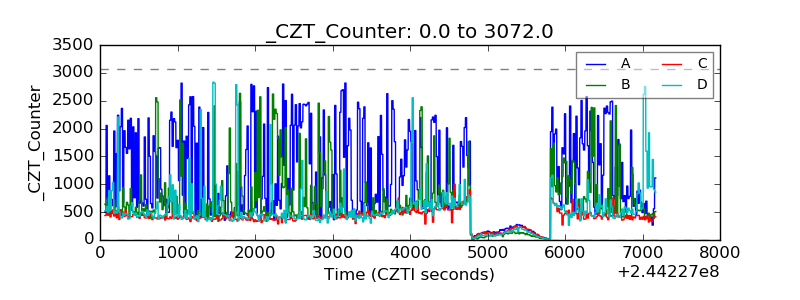 |
| +2.5 Volts monitor |  |
| +5 Volts monitor |  |
| _ROLL_ROT | 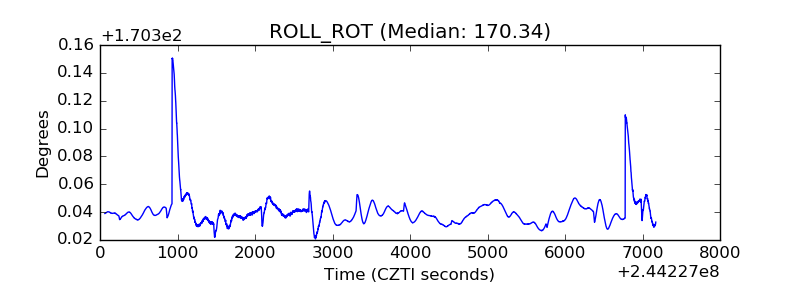 |
| _Roll_DEC | 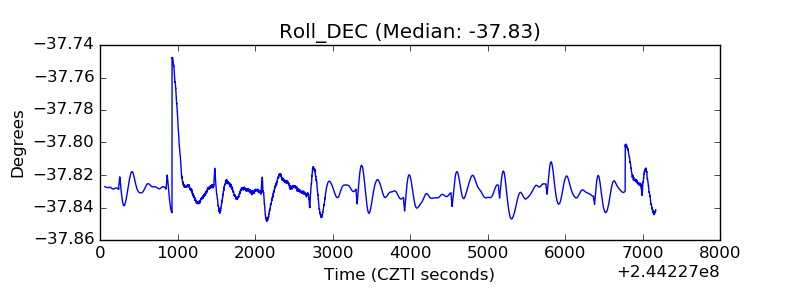 |
| _Roll_RA | 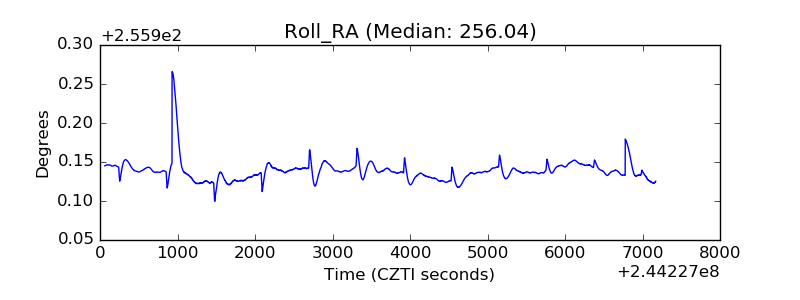 |
| Veto Counter | 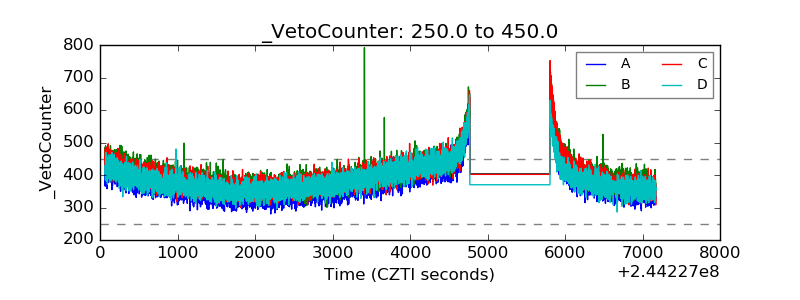 |