| Param | Original file | Final file |
|---|---|---|
| Filename | modeM0/AS1G07_053T01_9000001566_10816cztM0_level2.evt | modeM0/AS1G07_053T01_9000001566_10816cztM0_level2_quad_clean.evt |
| Size (bytes) | 368,173,440 | 39,121,920 |
| Size | 351.1 MB | 37.3 MB |
| Events in quadrant A | 3,779,032 | 215,482 |
| Events in quadrant B | 2,738,673 | 234,701 |
| Events in quadrant C | 1,680,380 | 235,292 |
| Events in quadrant D | 2,681,881 | 218,423 |
| Mode SS | |||
|---|---|---|---|
| Quadrant | BADHDUFLAG | Total packets | Discarded packets |
| A | 0 | 80 | 0 |
| B | 0 | 80 | 2 |
| C | 0 | 80 | 0 |
| D | 0 | 80 | 0 |
| Mode M0 | |||
|---|---|---|---|
| Quadrant | BADHDUFLAG | Total packets | Discarded packets |
| A | 0 | 14004 | 29 |
| B | 0 | 10907 | 11 |
| C | 0 | 8071 | 1 |
| D | 0 | 10811 | 11 |
| Quadrant | Total seconds | Saturated seconds | Saturation percentage |
|---|---|---|---|
| A | 3965 | 680 | 17.150063% |
| B | 3966 | 264 | 6.656581% |
| C | 3971 | 9 | 0.226643% |
| D | 3969 | 90 | 2.267574% |
Noise dominated data is calculated using 1-second bins in cleaned event files. If a bin has >2000 counts, and if more than 50% of those come from <1% of pixels, then it is considered to be noise-dominated and hence unusable.
| Quadrant | # 1 sec bins | Bins with >0 counts | Bins with >2000 counts | High rate bins dominated by noise | Noise dominated (total time) | Noise dominated (detector-on time) | Marked lightcurve |
|---|---|---|---|---|---|---|---|
| A | 3971 | 3971 | 526 | 526 | 13.25% | 13.25% | 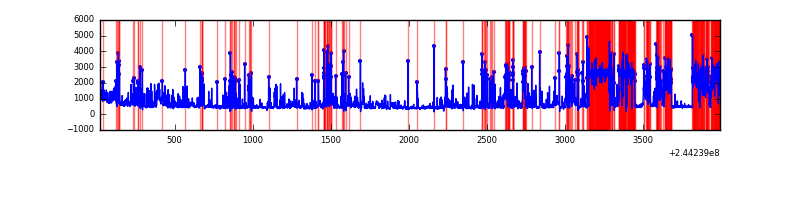 |
| B | 3971 | 3971 | 171 | 171 | 4.31% | 4.31% | 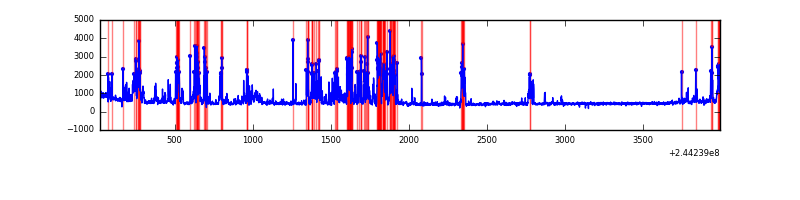 |
| C | 3971 | 3971 | 0 | 0 | 0.00% | 0.00% | 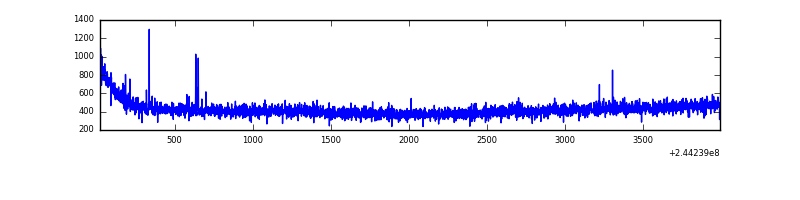 |
| D | 3972 | 3972 | 73 | 73 | 1.84% | 1.84% | 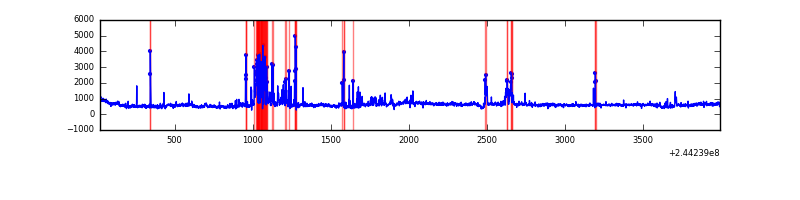 |
Top three noisy pixels from each quadrant. If the there are fewer than three noisy pixels in the level2.evt file, extra rows are filled as -1
| Pixel properties | Quadrant properties | ||||||
|---|---|---|---|---|---|---|---|
| Quadrant | DetID | PixID | Counts | Sigma | Mean | Median | Sigma |
| A | 8 | 5 | 2152425 | 25650.54 | 405 | 396 | 83.9 |
| A | 13 | 251 | 19680 | 229.85 | 405 | 396 | 83.9 |
| A | 3 | 1 | 15743 | 182.92 | 405 | 396 | 83.9 |
| B | 4 | 239 | 850741 | 10046.42 | 438 | 428 | 84.6 |
| B | 0 | 219 | 123537 | 1454.53 | 438 | 428 | 84.6 |
| B | 0 | 85 | 18796 | 217.02 | 438 | 428 | 84.6 |
| C | 14 | 234 | 6256 | 57.95 | 428 | 430 | 100.5 |
| C | 13 | 61 | 3344 | 28.99 | 428 | 430 | 100.5 |
| C | 8 | 222 | 1787 | 13.5 | 428 | 430 | 100.5 |
| D | 1 | 52 | 369234 | 3547.8 | 418 | 406 | 104.0 |
| D | 8 | 195 | 279441 | 2684.07 | 418 | 406 | 104.0 |
| D | 10 | 199 | 191353 | 1836.74 | 418 | 406 | 104.0 |
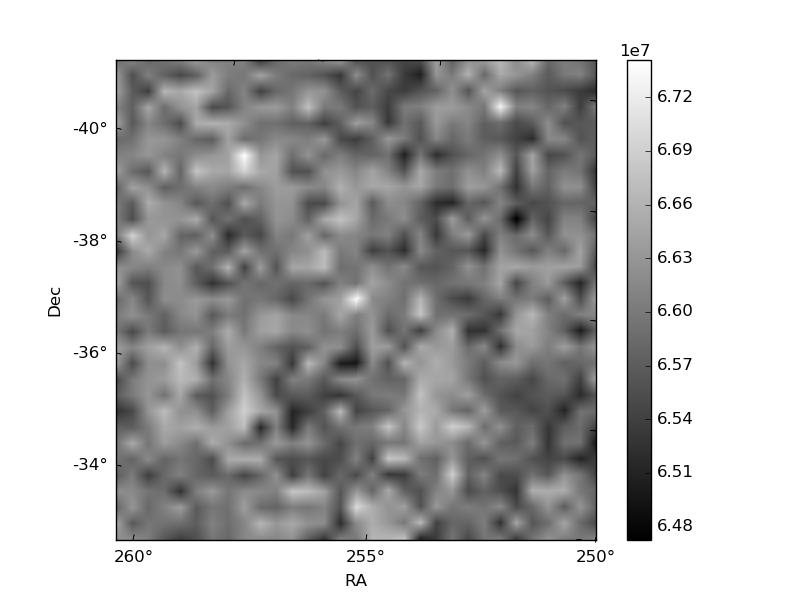
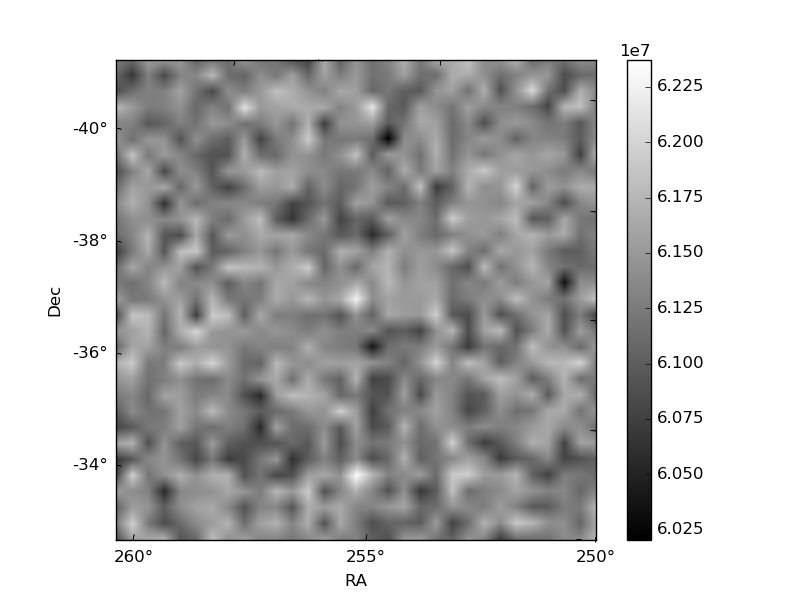
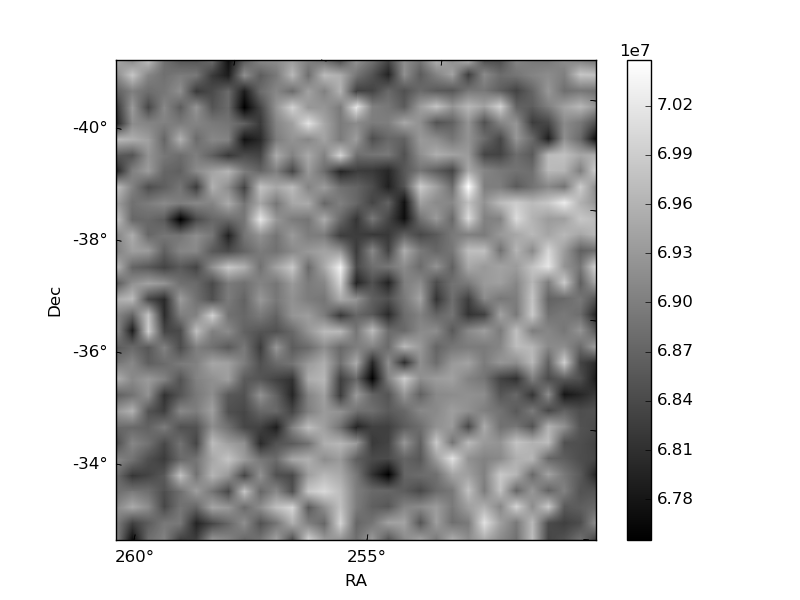
Histogram calculated using DETX and DETY for each event in the final _common_clean file
| Quadrant A | 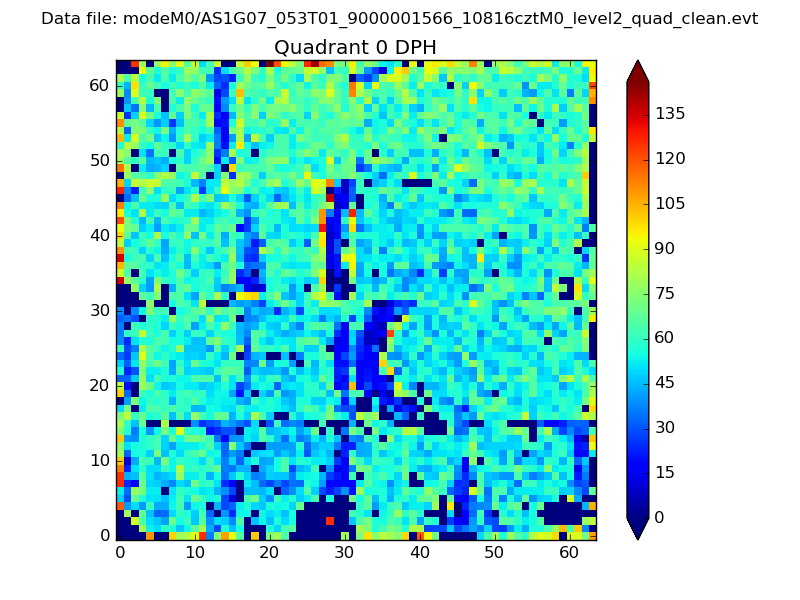 |
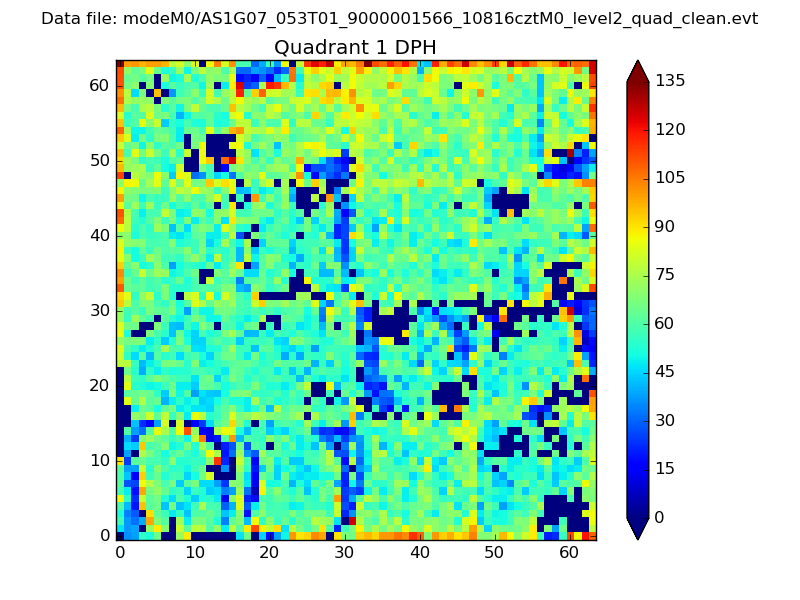 |
Quadrant B |
|---|---|---|---|
| Quadrant D | 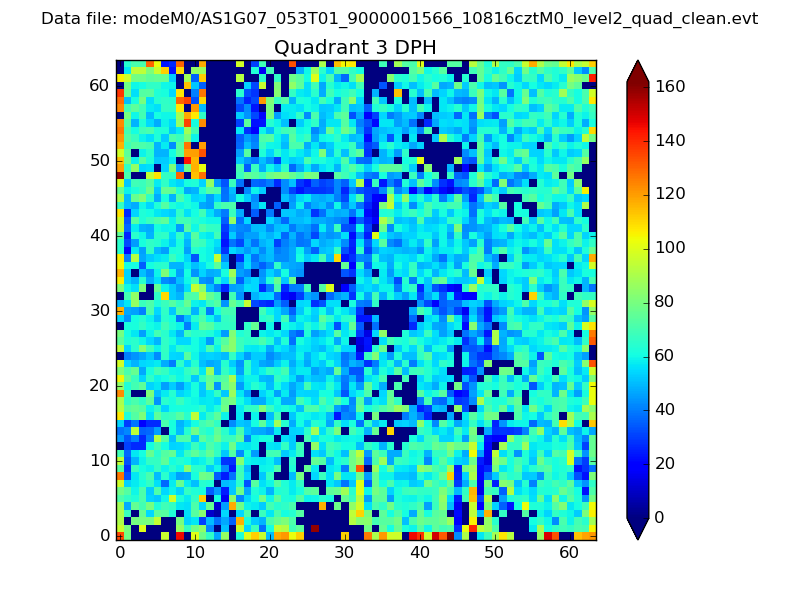 |
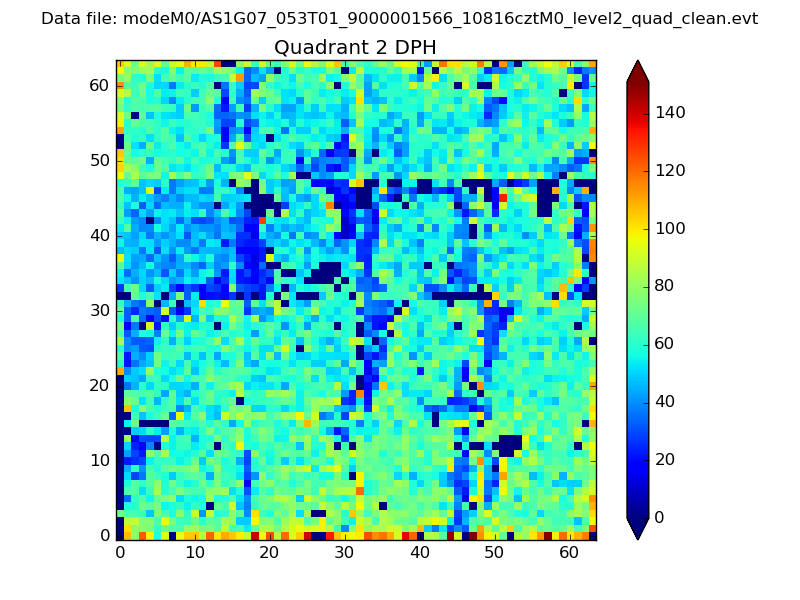 |
Quadrant C |
| Plot type | Count rate plots | Images |
|---|---|---|
| Comparison with Poisson distribution Blue bars denote a histogram of data divided into 1 sec bins. Red curve is a Poisson curve with rate = median count rate of data. |
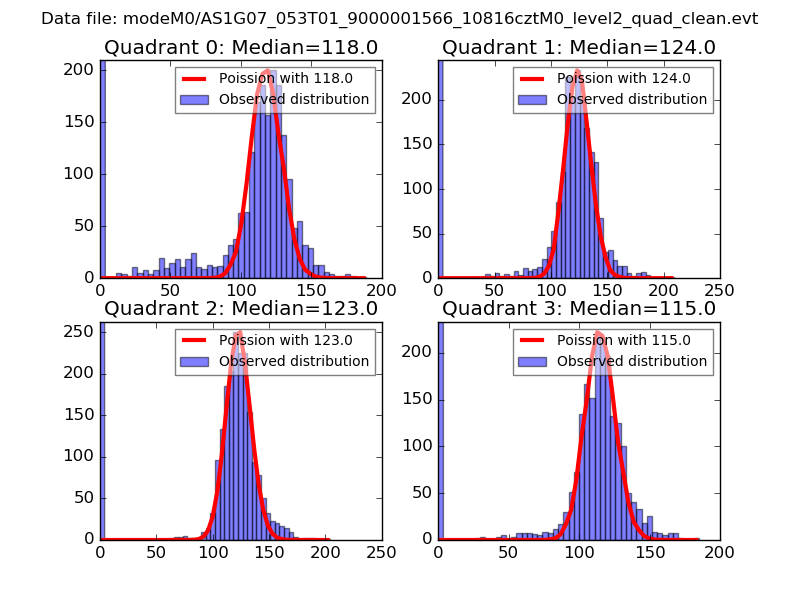 |
 |
| Quadrant-wise count rates Data is divided into 100 sec bins |
 |
|
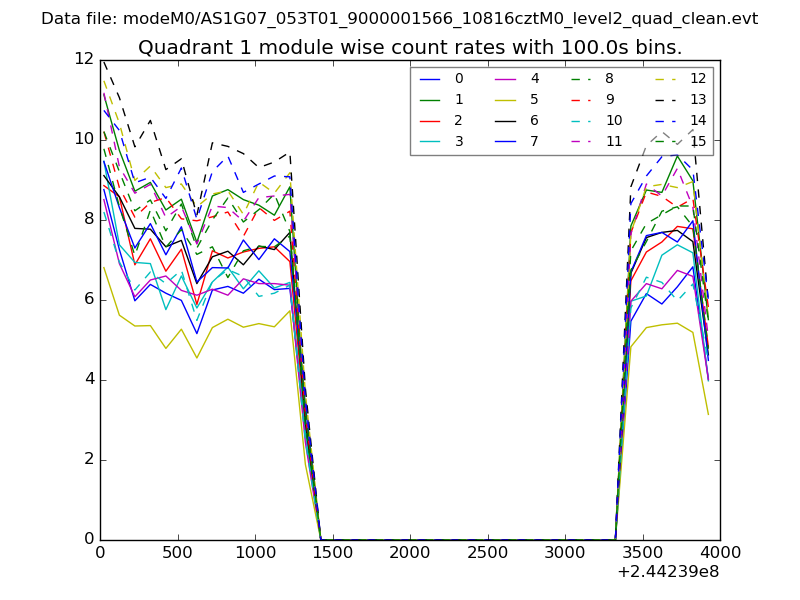
| Module-wise count rates for Quadrant A Data is divided into 100 sec bins |
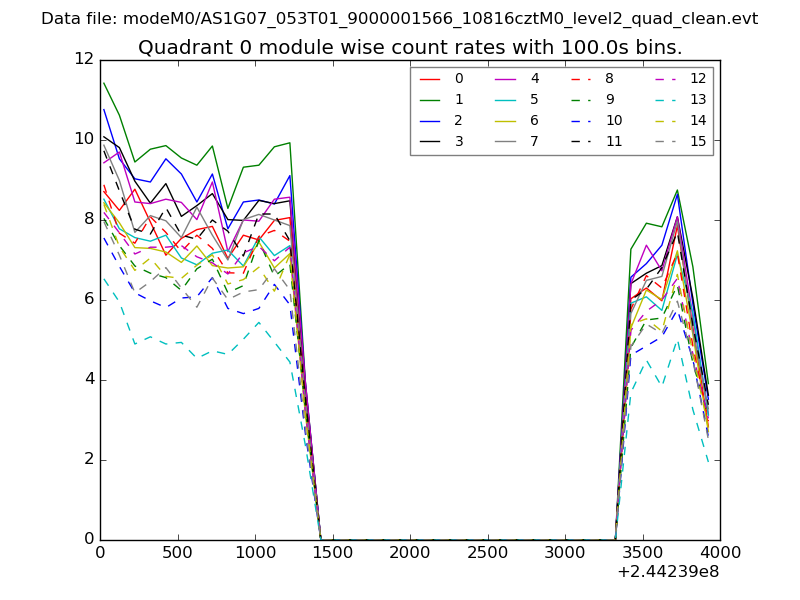 |
 |
| Module-wise count rates for Quadrant B Data is divided into 100 sec bins |
 |
 |
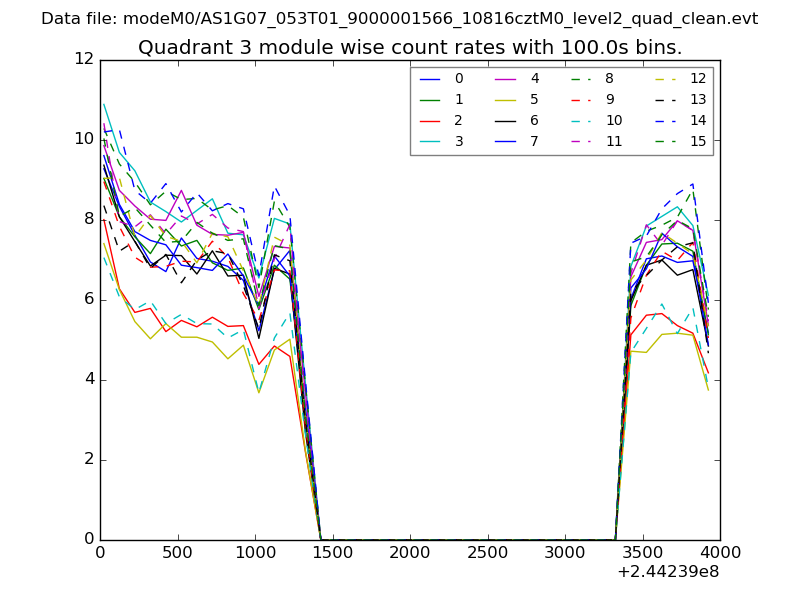
| Module-wise count rates for Quadrant C Data is divided into 100 sec bins |
 |
 |
| Module-wise count rates for Quadrant D Data is divided into 100 sec bins |
 |
 |
| Parameter | Plot |
|---|---|
| CZT HV Monitor | 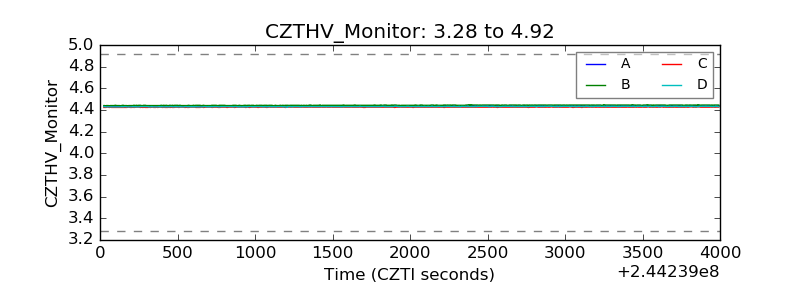 |
| D_VDD | 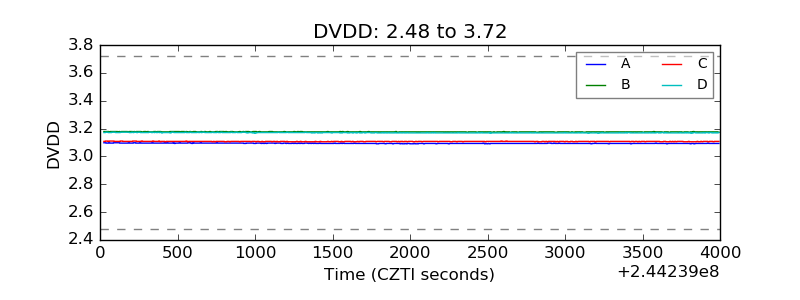 |
| Temperature 1 | 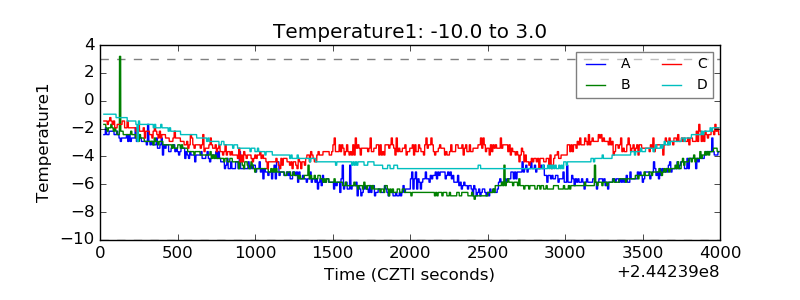 |
| Veto HV Monitor | 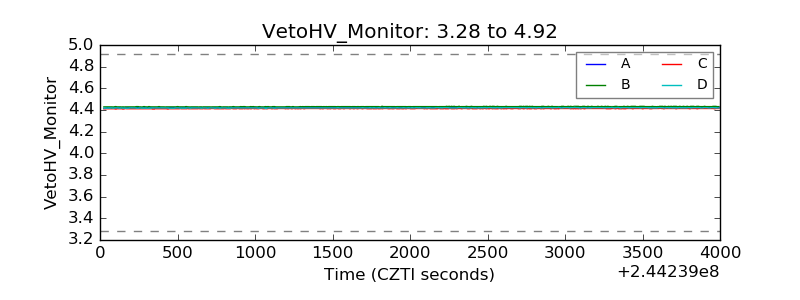 |
| Veto LLD | 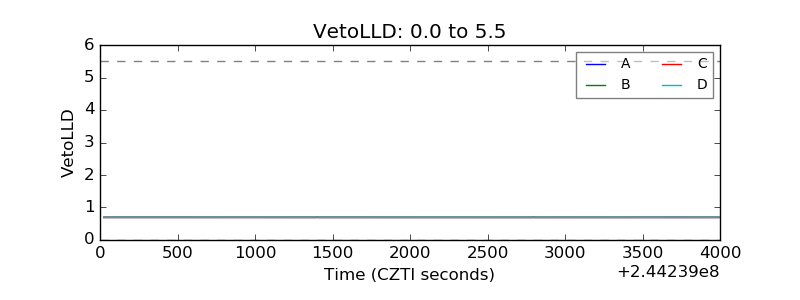 |
| Alpha Counter | 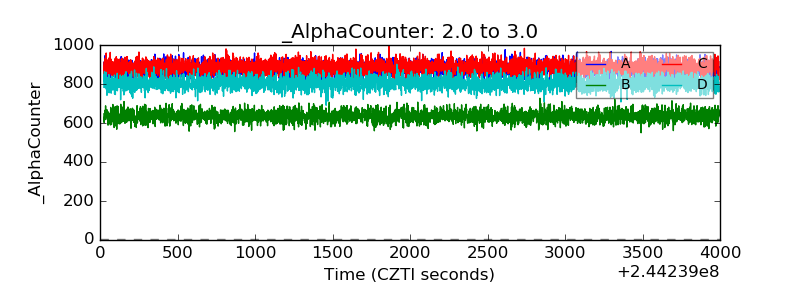 |
| _CPM_Rate | 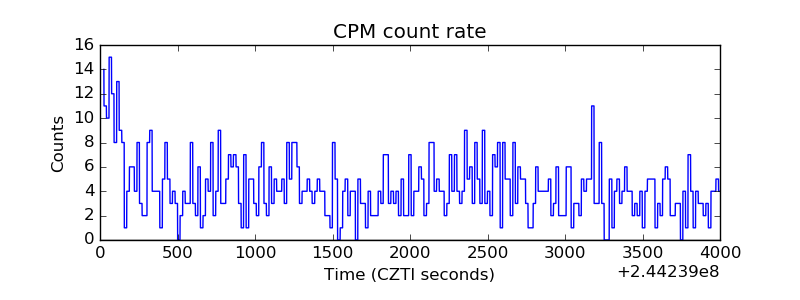 |
| CZT Counter | 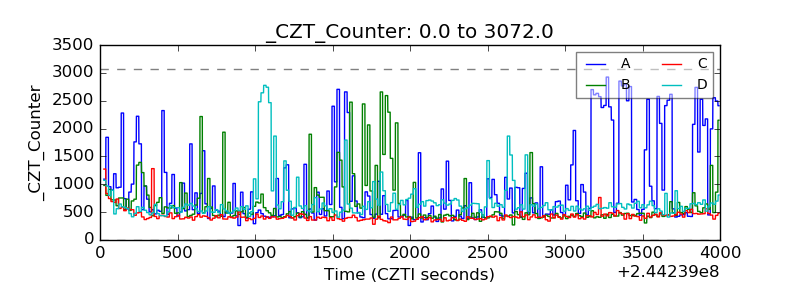 |
| +2.5 Volts monitor |  |
| +5 Volts monitor |  |
| _ROLL_ROT |  |
| _Roll_DEC | 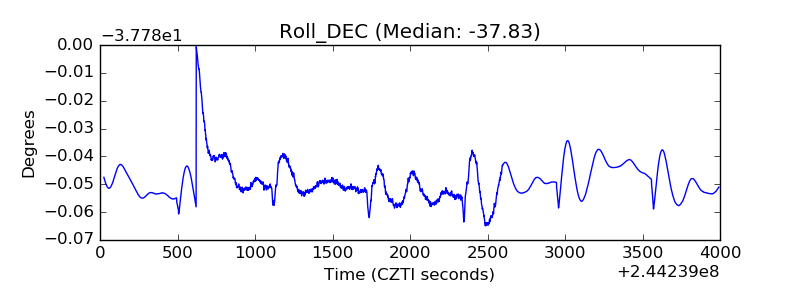 |
| _Roll_RA | 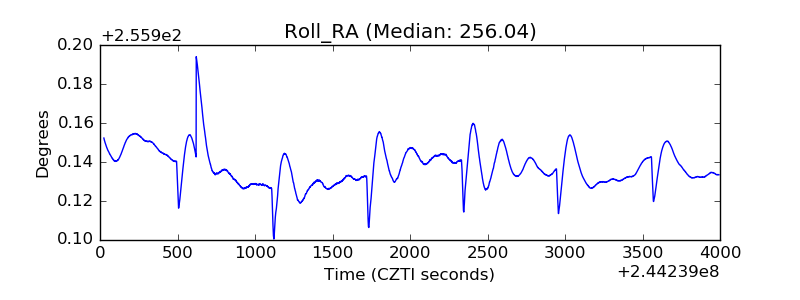 |
| Veto Counter | 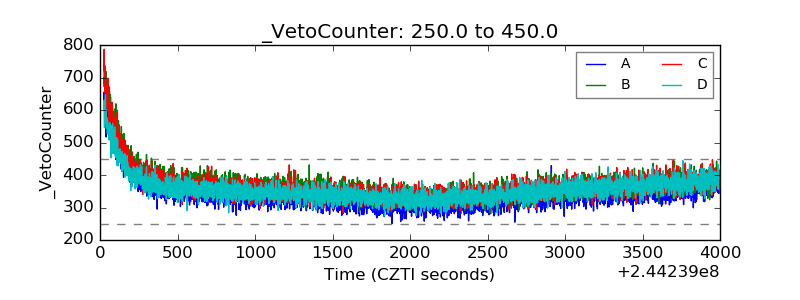 |