| Param | Original file | Final file |
|---|---|---|
| Filename | modeM0/AS1A03_118T01_9000001570cztM0_level2.fits | modeM0/AS1A03_118T01_9000001570cztM0_level2_quad_clean.evt |
| Size (bytes) | 25,539,840 | 21,384,000 |
| Size | 24.4 MB | 20.4 MB |
| Events in quadrant A | 148,286 | 117,097 |
| Events in quadrant B | 138,192 | 91,922 |
| Events in quadrant C | 146,968 | 116,574 |
| Events in quadrant D | 126,708 | 107,717 |
| Mode M9 | |||
|---|---|---|---|
| Quadrant | BADHDUFLAG | Total packets | Discarded packets |
| A | 0 | 99 | 0 |
| B | 0 | 99 | 0 |
| C | 0 | 99 | 0 |
| D | 0 | 100 | 0 |
| Mode SS | |||
|---|---|---|---|
| Quadrant | BADHDUFLAG | Total packets | Discarded packets |
| A | 0 | 62 | 0 |
| B | 0 | 62 | 0 |
| C | 0 | 60 | 0 |
| D | 0 | 62 | 0 |
| Mode M0 | |||
|---|---|---|---|
| Quadrant | BADHDUFLAG | Total packets | Discarded packets |
| A | 0 | 7007 | 0 |
| B | 0 | 8907 | 0 |
| C | 0 | 5996 | 0 |
| D | 0 | 7067 | 0 |
| Quadrant | Total seconds | Saturated seconds | Saturation percentage |
|---|---|---|---|
| A | 2988 | 61 | 2.041499% |
| B | 2988 | 355 | 11.880857% |
| C | 2986 | 5 | 0.167448% |
| D | 2984 | 59 | 1.977212% |
Noise dominated data is calculated using 1-second bins in cleaned event files. If a bin has >2000 counts, and if more than 50% of those come from <1% of pixels, then it is considered to be noise-dominated and hence unusable.
| Quadrant | # 1 sec bins | Bins with >0 counts | Bins with >2000 counts | High rate bins dominated by noise | Noise dominated (total time) | Noise dominated (detector-on time) | Marked lightcurve |
|---|---|---|---|---|---|---|---|
| A | 3018 | 3015 | 0 | 0 | 0.00% | 0.00% |  |
| B | 3018 | 3015 | 0 | 0 | 0.00% | 0.00% |  |
| C | 3018 | 3017 | 0 | 0 | 0.00% | 0.00% |  |
| D | 3018 | 3016 | 0 | 0 | 0.00% | 0.00% |  |
Top three noisy pixels from each quadrant. If the there are fewer than three noisy pixels in the level2.evt file, extra rows are filled as -1
| Pixel properties | Quadrant properties | ||||||
|---|---|---|---|---|---|---|---|
| Quadrant | DetID | PixID | Counts | Sigma | Mean | Median | Sigma |
| A | 0 | 29 | 163 | 10.92 | 38 | 36 | 11.6 |
| A | 7 | 110 | 139 | 8.86 | 38 | 36 | 11.6 |
| A | 0 | 30 | 130 | 8.09 | 38 | 36 | 11.6 |
| B | 2 | 9 | 143 | 11.4 | 36 | 35 | 9.5 |
| B | 5 | 128 | 104 | 7.28 | 36 | 35 | 9.5 |
| B | 2 | 8 | 101 | 6.96 | 36 | 35 | 9.5 |
| C | 15 | 65 | 106 | 5.89 | 38 | 36 | 11.9 |
| C | 1 | 80 | 106 | 5.89 | 38 | 36 | 11.9 |
| C | 9 | 188 | 104 | 5.72 | 38 | 36 | 11.9 |
| D | 14 | 238 | 103 | 6.22 | 36 | 32 | 11.4 |
| D | 7 | 3 | 102 | 6.13 | 36 | 32 | 11.4 |
| D | 6 | 231 | 98 | 5.78 | 36 | 32 | 11.4 |
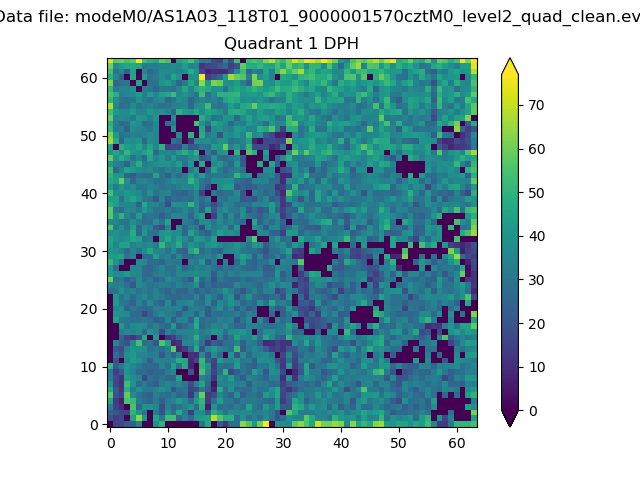
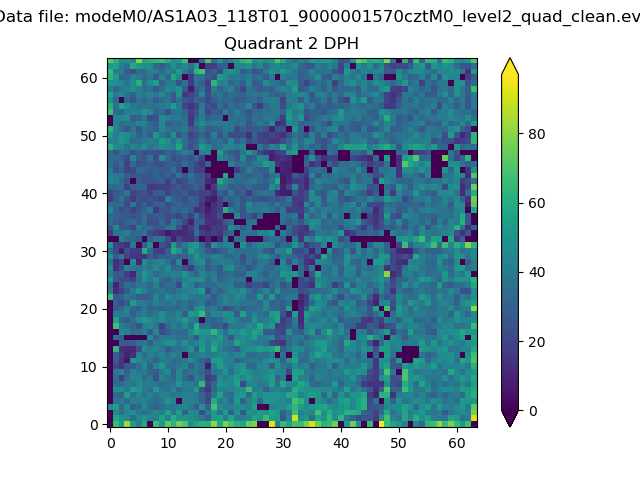
Histogram calculated using DETX and DETY for each event in the final _common_clean file
| Quadrant A |  |
 |
Quadrant B |
|---|---|---|---|
| Quadrant D |  |
 |
Quadrant C |
| Plot type | Count rate plots | Images |
|---|---|---|
| Comparison with Poisson distribution Blue bars denote a histogram of data divided into 1 sec bins. Red curve is a Poisson curve with rate = median count rate of data. |
 |
 |
| Quadrant-wise count rates Data is divided into 100 sec bins |
 |
|
| Module-wise count rates for Quadrant A Data is divided into 100 sec bins |
 |
 |
| Module-wise count rates for Quadrant B Data is divided into 100 sec bins |
 |
 |
| Module-wise count rates for Quadrant C Data is divided into 100 sec bins |
 |
 |
| Module-wise count rates for Quadrant D Data is divided into 100 sec bins |
 |
 |
| Parameter | Plot |
|---|---|
| CZT HV Monitor |  |
| D_VDD |  |
| Temperature 1 |  |
| Veto HV Monitor |  |
| Veto LLD |  |
| Alpha Counter |  |
| _CPM_Rate |  |
| CZT Counter |  |
| +2.5 Volts monitor |  |
| +5 Volts monitor |  |
| _ROLL_ROT |  |
| _Roll_DEC |  |
| _Roll_RA |  |
| Veto Counter |  |