| Param | Original file | Final file |
|---|---|---|
| Filename | modeM0/AS1A03_118T01_9000001570_10859cztM0_level2.evt | modeM0/AS1A03_118T01_9000001570_10859cztM0_level2_quad_clean.evt |
| Size (bytes) | 631,598,400 | 103,783,680 |
| Size | 602.3 MB | 99.0 MB |
| Events in quadrant A | 6,066,846 | 629,159 |
| Events in quadrant B | 5,170,506 | 665,485 |
| Events in quadrant C | 3,247,938 | 684,729 |
| Events in quadrant D | 4,142,815 | 649,536 |
| Mode M9 | |||
|---|---|---|---|
| Quadrant | BADHDUFLAG | Total packets | Discarded packets |
| A | 0 | 4 | 0 |
| B | 0 | 4 | 0 |
| C | 0 | 4 | 0 |
| D | 0 | 5 | 0 |
| Mode SS | |||
|---|---|---|---|
| Quadrant | BADHDUFLAG | Total packets | Discarded packets |
| A | 0 | 150 | 0 |
| B | 0 | 150 | 0 |
| C | 0 | 150 | 0 |
| D | 0 | 150 | 0 |
| Mode M0 | |||
|---|---|---|---|
| Quadrant | BADHDUFLAG | Total packets | Discarded packets |
| A | 0 | 22990 | 3 |
| B | 0 | 20311 | 2 |
| C | 0 | 15066 | 2 |
| D | 0 | 17112 | 2 |
| Quadrant | Total seconds | Saturated seconds | Saturation percentage |
|---|---|---|---|
| A | 7381 | 749 | 10.147676% |
| B | 7381 | 485 | 6.570925% |
| C | 7381 | 13 | 0.176128% |
| D | 7381 | 54 | 0.731608% |
Noise dominated data is calculated using 1-second bins in cleaned event files. If a bin has >2000 counts, and if more than 50% of those come from <1% of pixels, then it is considered to be noise-dominated and hence unusable.
| Quadrant | # 1 sec bins | Bins with >0 counts | Bins with >2000 counts | High rate bins dominated by noise | Noise dominated (total time) | Noise dominated (detector-on time) | Marked lightcurve |
|---|---|---|---|---|---|---|---|
| A | 7771 | 7382 | 484 | 484 | 6.23% | 6.56% | 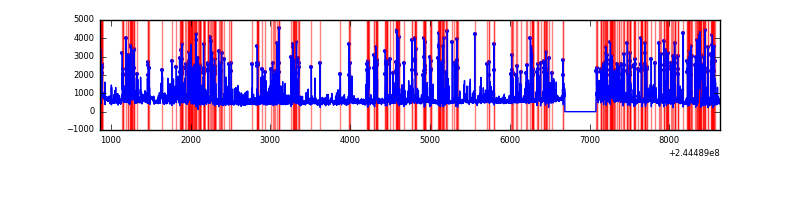 |
| B | 7771 | 7382 | 264 | 264 | 3.40% | 3.58% | 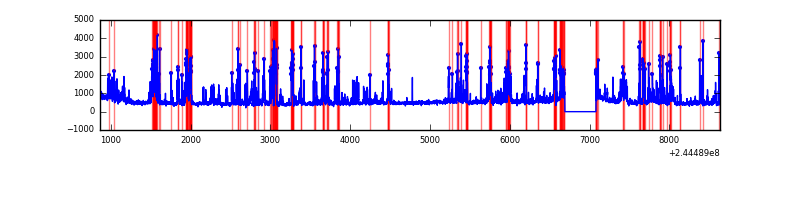 |
| C | 7771 | 7382 | 0 | 0 | 0.00% | 0.00% | 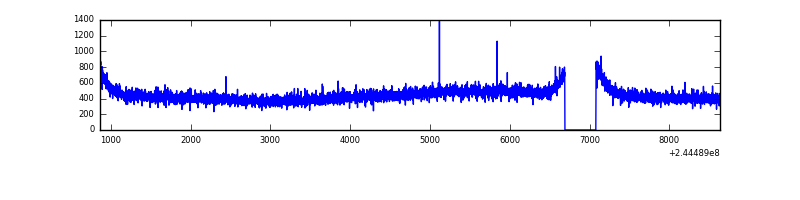 |
| D | 7771 | 7382 | 30 | 30 | 0.39% | 0.41% | 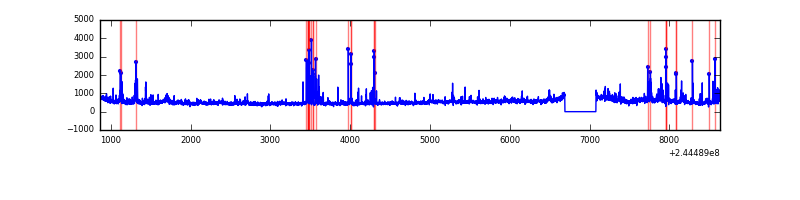 |
Top three noisy pixels from each quadrant. If the there are fewer than three noisy pixels in the level2.evt file, extra rows are filled as -1
| Pixel properties | Quadrant properties | ||||||
|---|---|---|---|---|---|---|---|
| Quadrant | DetID | PixID | Counts | Sigma | Mean | Median | Sigma |
| A | 8 | 5 | 2784060 | 16750.44 | 815 | 797 | 166.2 |
| A | 15 | 223 | 55146 | 327.09 | 815 | 797 | 166.2 |
| A | 15 | 239 | 29877 | 175.01 | 815 | 797 | 166.2 |
| B | 4 | 239 | 1644823 | 10239.49 | 842 | 824 | 160.6 |
| B | 0 | 219 | 63499 | 390.37 | 842 | 824 | 160.6 |
| B | 3 | 189 | 43952 | 268.62 | 842 | 824 | 160.6 |
| C | 13 | 61 | 6258 | 27.99 | 830 | 833 | 193.8 |
| C | 14 | 234 | 3631 | 14.44 | 830 | 833 | 193.8 |
| C | 8 | 128 | 3551 | 14.02 | 830 | 833 | 193.8 |
| D | 8 | 195 | 536070 | 2674.76 | 825 | 800 | 200.1 |
| D | 13 | 249 | 142437 | 707.76 | 825 | 800 | 200.1 |
| D | 1 | 52 | 88933 | 440.4 | 825 | 800 | 200.1 |
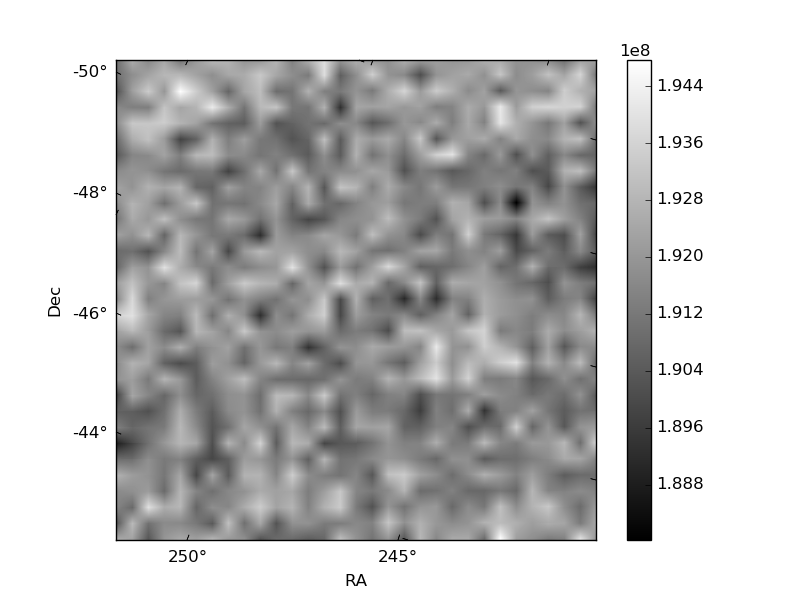
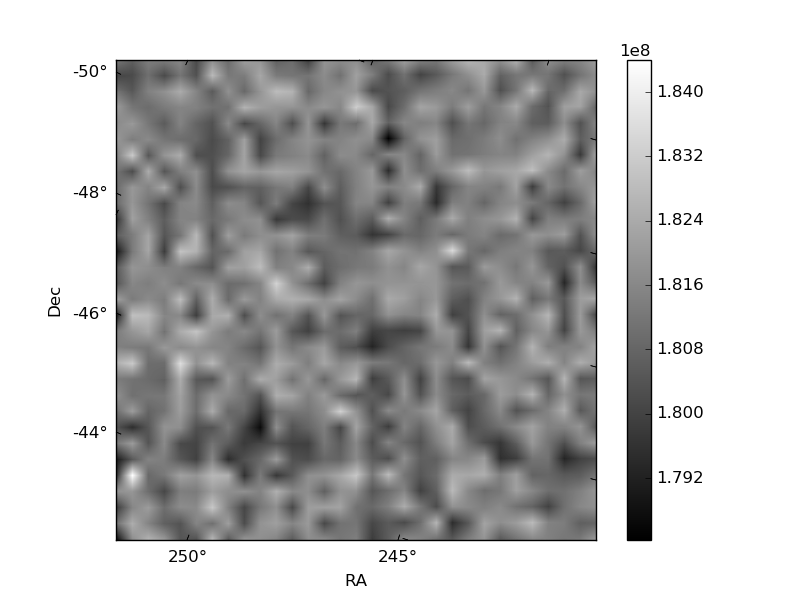
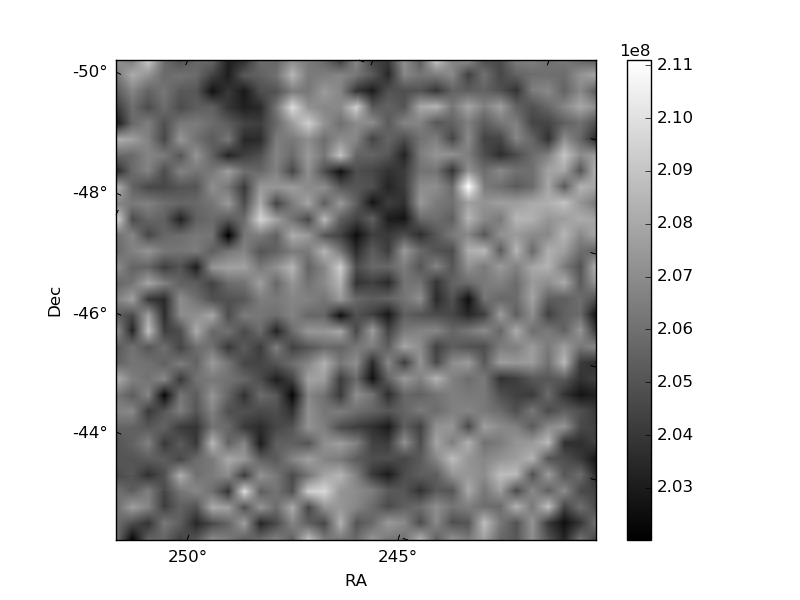
Histogram calculated using DETX and DETY for each event in the final _common_clean file
| Quadrant A |  |
 |
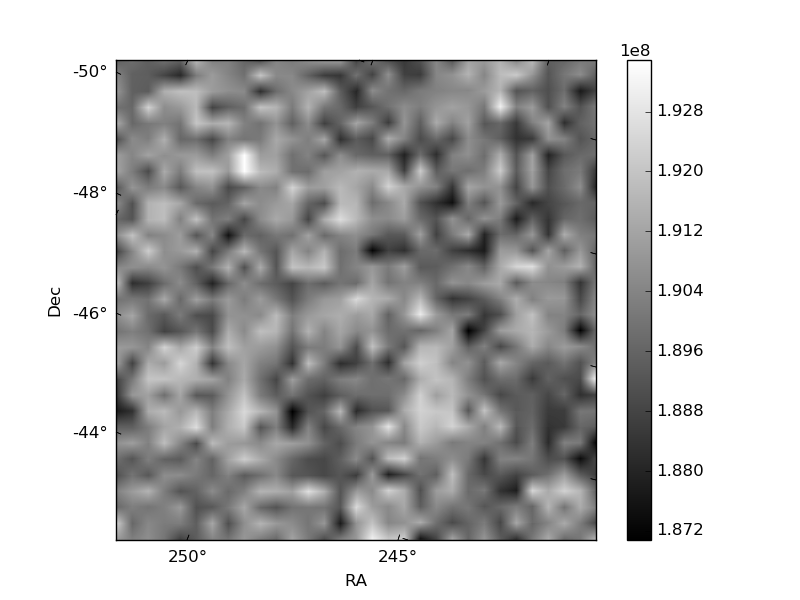
Quadrant B |
|---|---|---|---|
| Quadrant D |  |
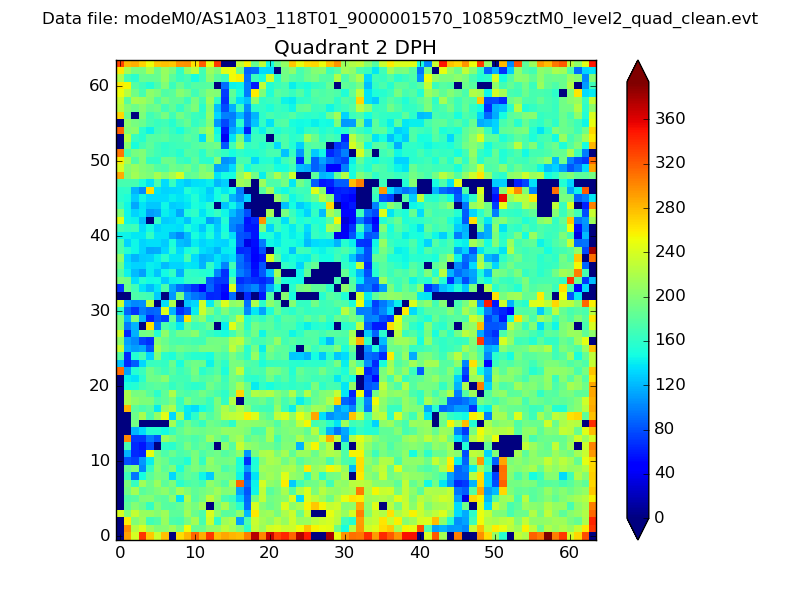 |
Quadrant C |
| Plot type | Count rate plots | Images |
|---|---|---|
| Comparison with Poisson distribution Blue bars denote a histogram of data divided into 1 sec bins. Red curve is a Poisson curve with rate = median count rate of data. |
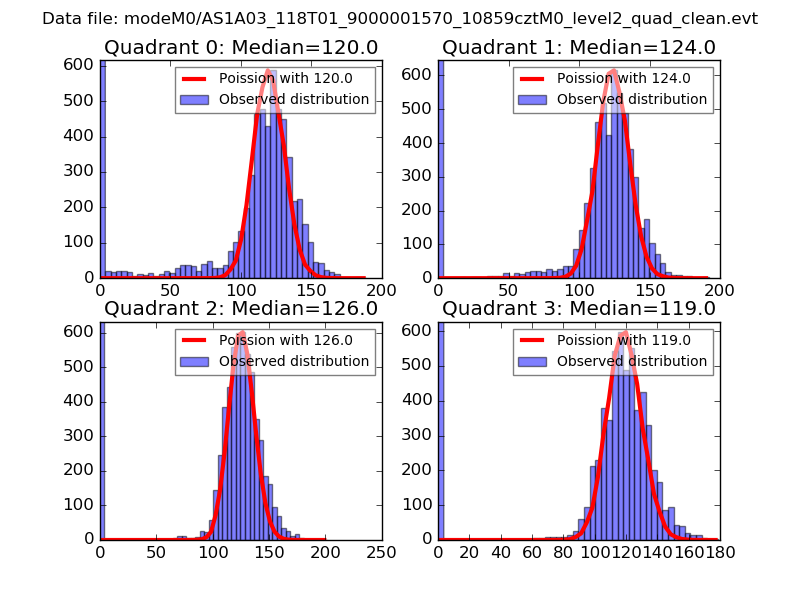 |
 |
| Quadrant-wise count rates Data is divided into 100 sec bins |
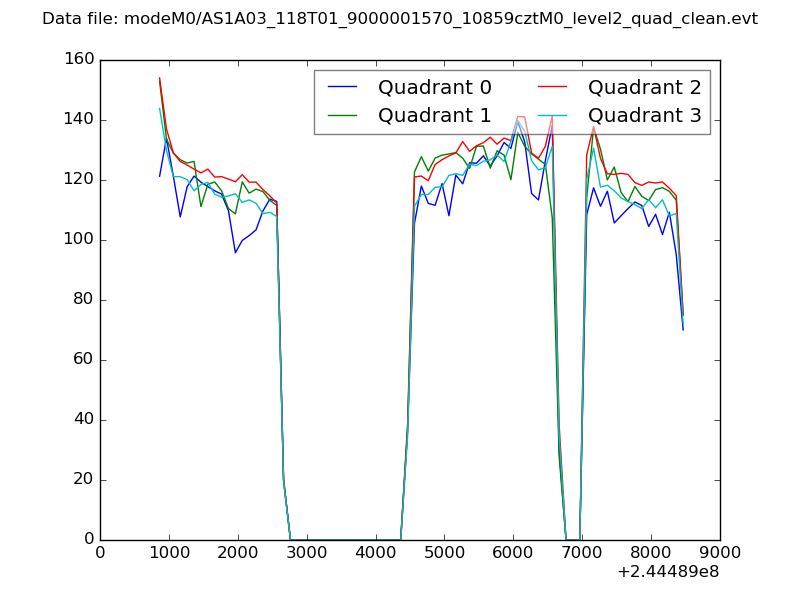 |
|
| Module-wise count rates for Quadrant A Data is divided into 100 sec bins |
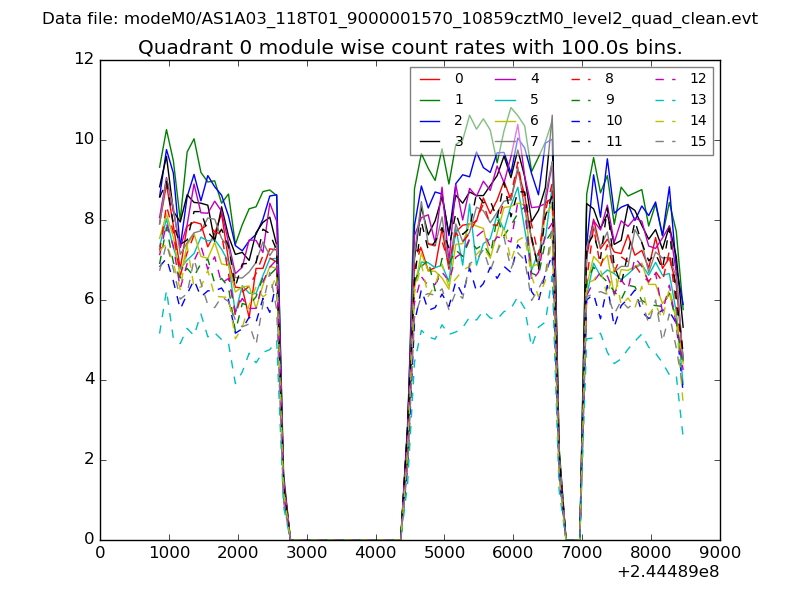 |
 |
| Module-wise count rates for Quadrant B Data is divided into 100 sec bins |
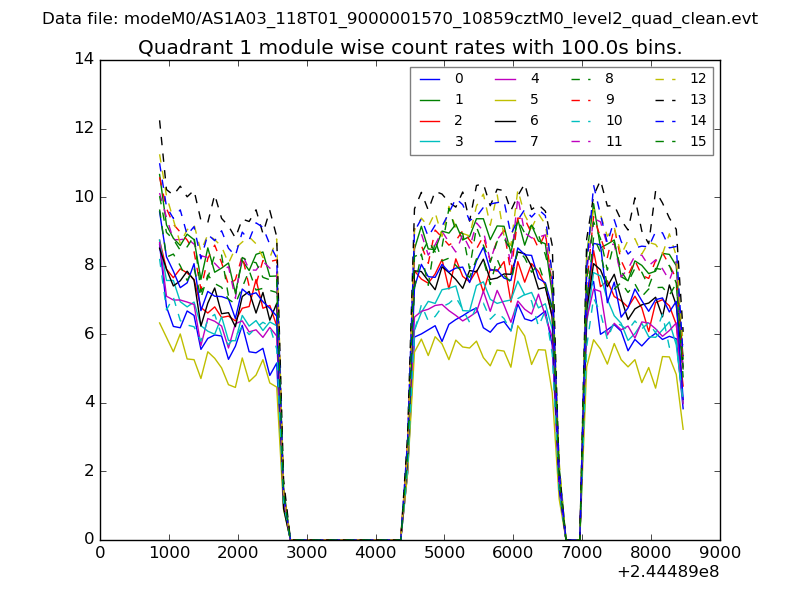 |
 |
| Module-wise count rates for Quadrant C Data is divided into 100 sec bins |
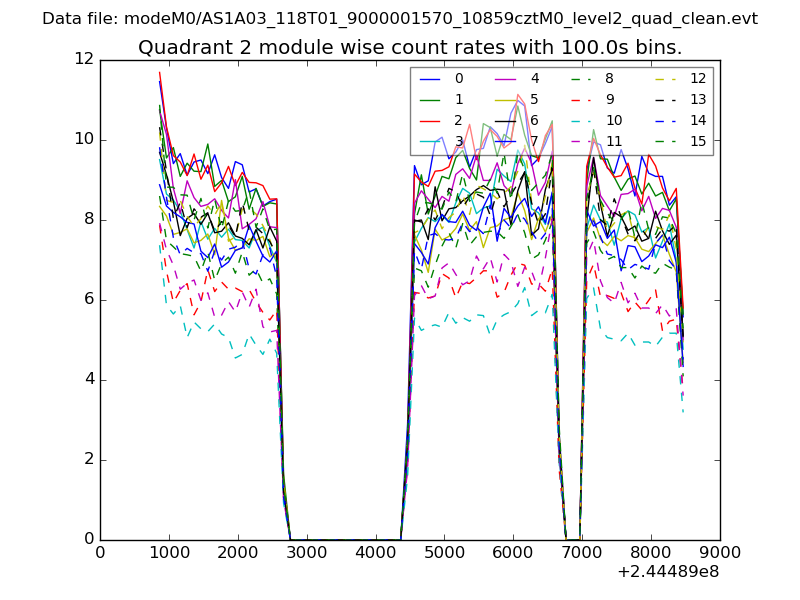 |
 |
| Module-wise count rates for Quadrant D Data is divided into 100 sec bins |
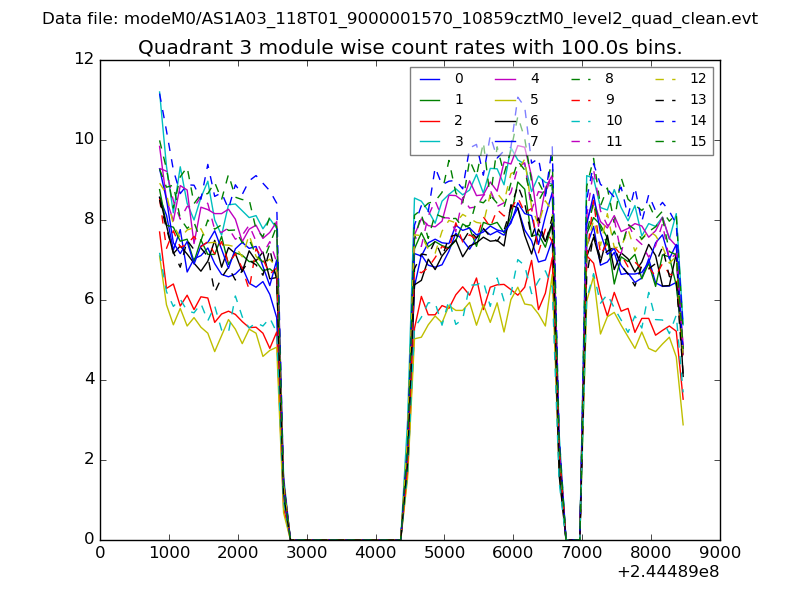 |
 |
| Parameter | Plot |
|---|---|
| CZT HV Monitor |  |
| D_VDD | 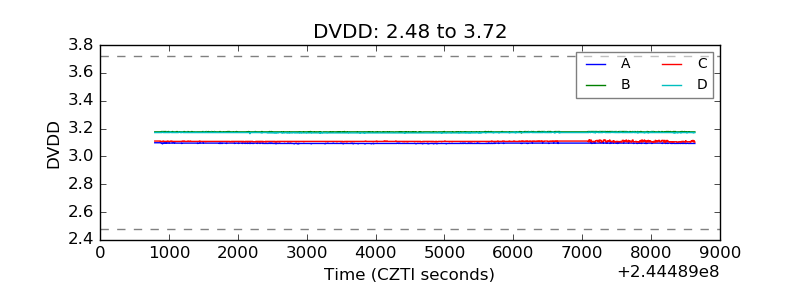 |
| Temperature 1 | 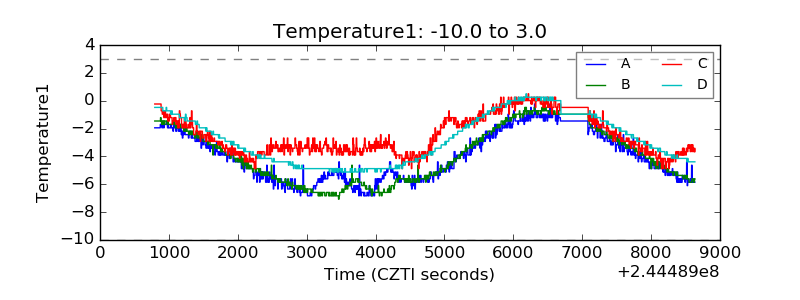 |
| Veto HV Monitor | 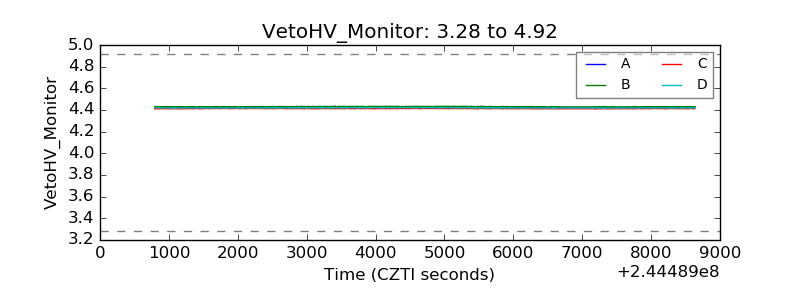 |
| Veto LLD | 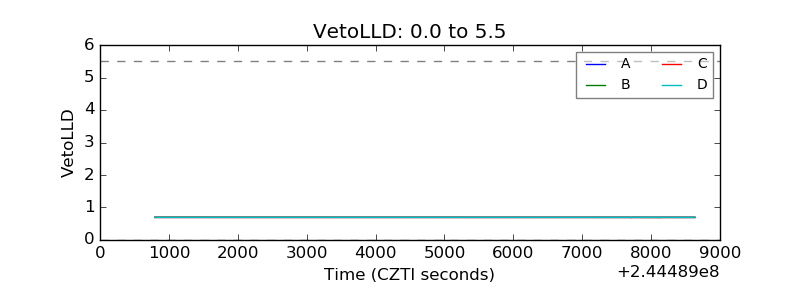 |
| Alpha Counter | 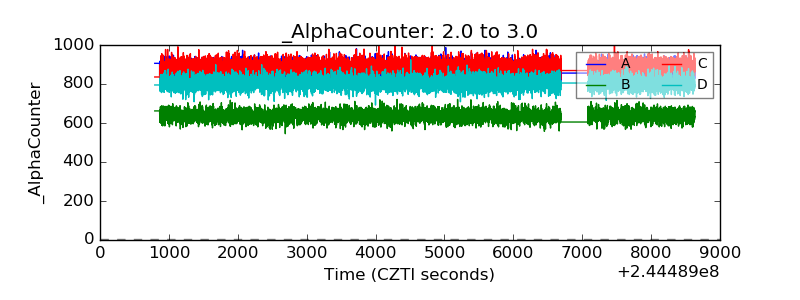 |
| _CPM_Rate | 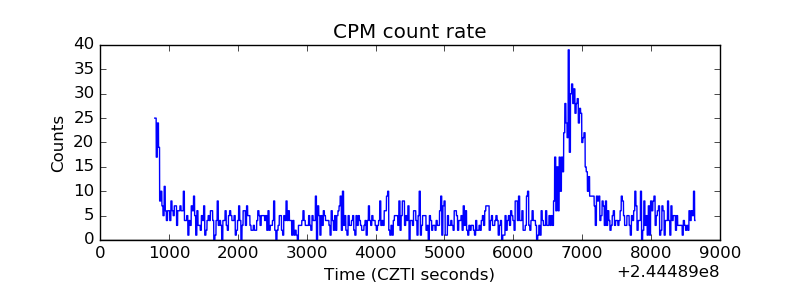 |
| CZT Counter | 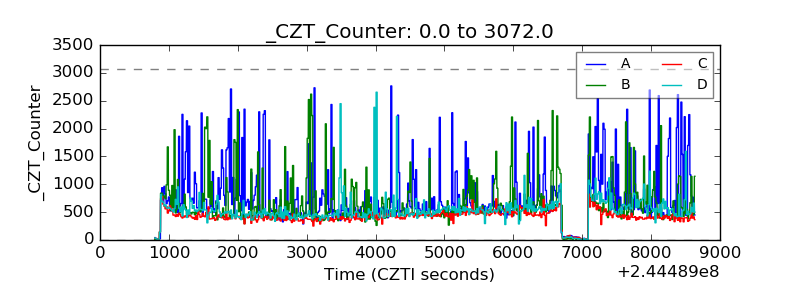 |
| +2.5 Volts monitor |  |
| +5 Volts monitor |  |
| _ROLL_ROT | 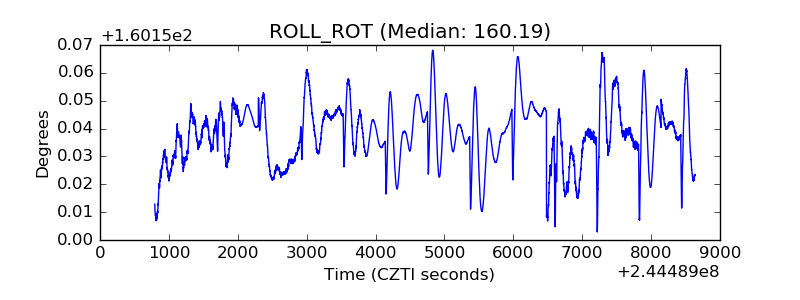 |
| _Roll_DEC | 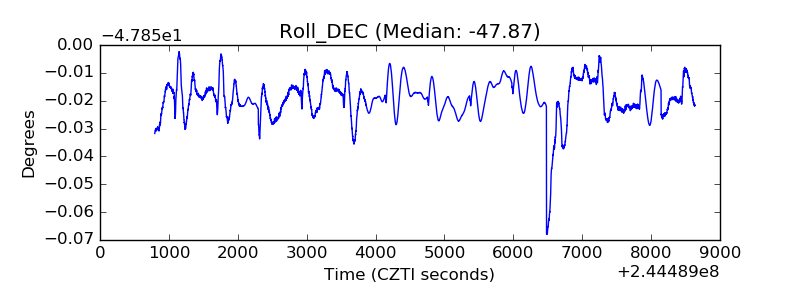 |
| _Roll_RA | 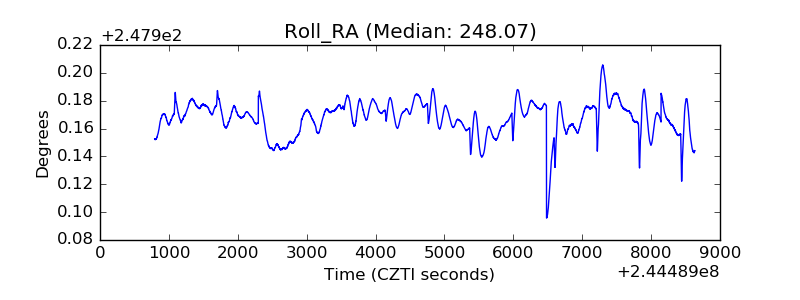 |
| Veto Counter | 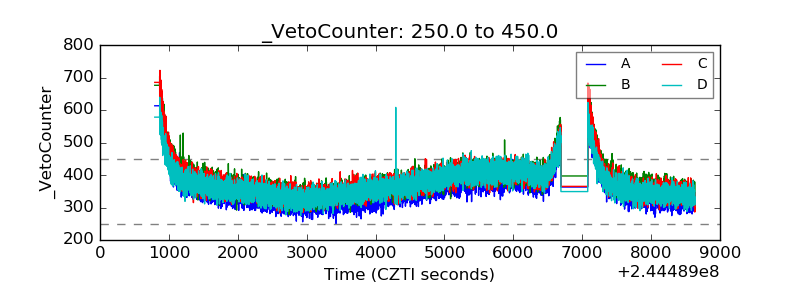 |