| Param | Original file | Final file |
|---|---|---|
| Filename | modeM0/AS1A03_118T01_9000001570_10860cztM0_level2.evt | modeM0/AS1A03_118T01_9000001570_10860cztM0_level2_quad_clean.evt |
| Size (bytes) | 689,002,560 | 104,457,600 |
| Size | 657.1 MB | 99.6 MB |
| Events in quadrant A | 6,798,192 | 630,860 |
| Events in quadrant B | 5,337,935 | 657,384 |
| Events in quadrant C | 3,515,147 | 682,074 |
| Events in quadrant D | 4,685,049 | 647,838 |
| Mode M9 | |||
|---|---|---|---|
| Quadrant | BADHDUFLAG | Total packets | Discarded packets |
| A | 0 | 5 | 0 |
| B | 0 | 5 | 0 |
| C | 0 | 5 | 0 |
| D | 0 | 5 | 0 |
| Mode SS | |||
|---|---|---|---|
| Quadrant | BADHDUFLAG | Total packets | Discarded packets |
| A | 0 | 162 | 0 |
| B | 0 | 162 | 0 |
| C | 0 | 162 | 0 |
| D | 0 | 162 | 0 |
| Mode M0 | |||
|---|---|---|---|
| Quadrant | BADHDUFLAG | Total packets | Discarded packets |
| A | 0 | 25623 | 3 |
| B | 0 | 21223 | 2 |
| C | 0 | 16234 | 2 |
| D | 0 | 19113 | 2 |
| Quadrant | Total seconds | Saturated seconds | Saturation percentage |
|---|---|---|---|
| A | 7829 | 955 | 12.198237% |
| B | 7829 | 621 | 7.932048% |
| C | 7829 | 68 | 0.868566% |
| D | 7829 | 133 | 1.698812% |
Noise dominated data is calculated using 1-second bins in cleaned event files. If a bin has >2000 counts, and if more than 50% of those come from <1% of pixels, then it is considered to be noise-dominated and hence unusable.
| Quadrant | # 1 sec bins | Bins with >0 counts | Bins with >2000 counts | High rate bins dominated by noise | Noise dominated (total time) | Noise dominated (detector-on time) | Marked lightcurve |
|---|---|---|---|---|---|---|---|
| A | 8389 | 7831 | 529 | 529 | 6.31% | 6.76% | 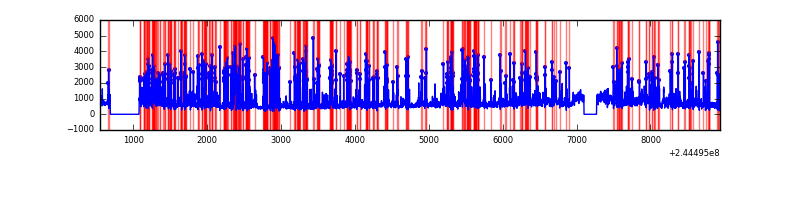 |
| B | 8388 | 7830 | 290 | 290 | 3.46% | 3.70% | 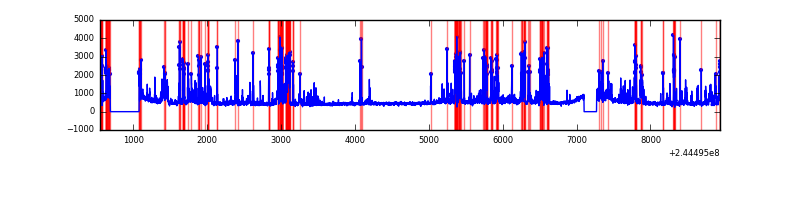 |
| C | 8389 | 7831 | 0 | 0 | 0.00% | 0.00% | 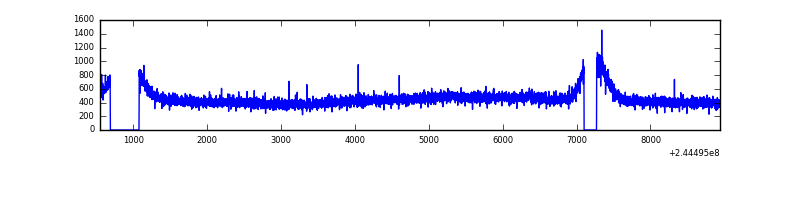 |
| D | 8389 | 7831 | 59 | 59 | 0.70% | 0.75% | 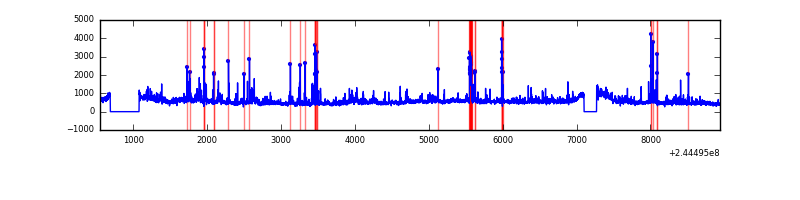 |
Top three noisy pixels from each quadrant. If the there are fewer than three noisy pixels in the level2.evt file, extra rows are filled as -1
| Pixel properties | Quadrant properties | ||||||
|---|---|---|---|---|---|---|---|
| Quadrant | DetID | PixID | Counts | Sigma | Mean | Median | Sigma |
| A | 8 | 5 | 3273062 | 18091.39 | 878 | 855 | 180.9 |
| A | 15 | 223 | 56282 | 306.44 | 878 | 855 | 180.9 |
| A | 13 | 251 | 28373 | 152.14 | 878 | 855 | 180.9 |
| B | 4 | 239 | 1615170 | 9173.91 | 906 | 882 | 176.0 |
| B | 3 | 189 | 48108 | 268.38 | 906 | 882 | 176.0 |
| B | 0 | 214 | 44525 | 248.02 | 906 | 882 | 176.0 |
| C | 8 | 128 | 10013 | 43.85 | 894 | 899 | 207.8 |
| C | 13 | 61 | 6852 | 28.64 | 894 | 899 | 207.8 |
| C | 8 | 112 | 6550 | 27.19 | 894 | 899 | 207.8 |
| D | 8 | 195 | 651748 | 3008.96 | 891 | 863 | 216.3 |
| D | 1 | 52 | 272775 | 1257.01 | 891 | 863 | 216.3 |
| D | 7 | 71 | 82864 | 379.08 | 891 | 863 | 216.3 |
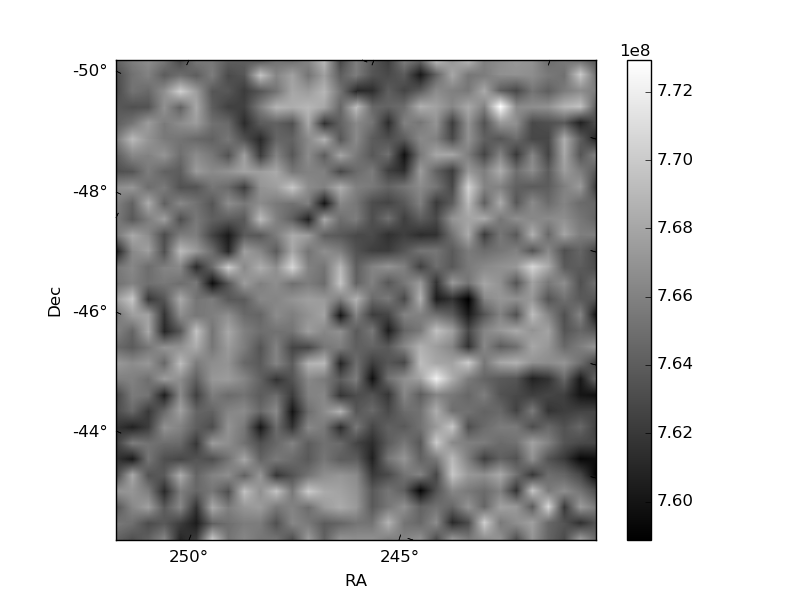
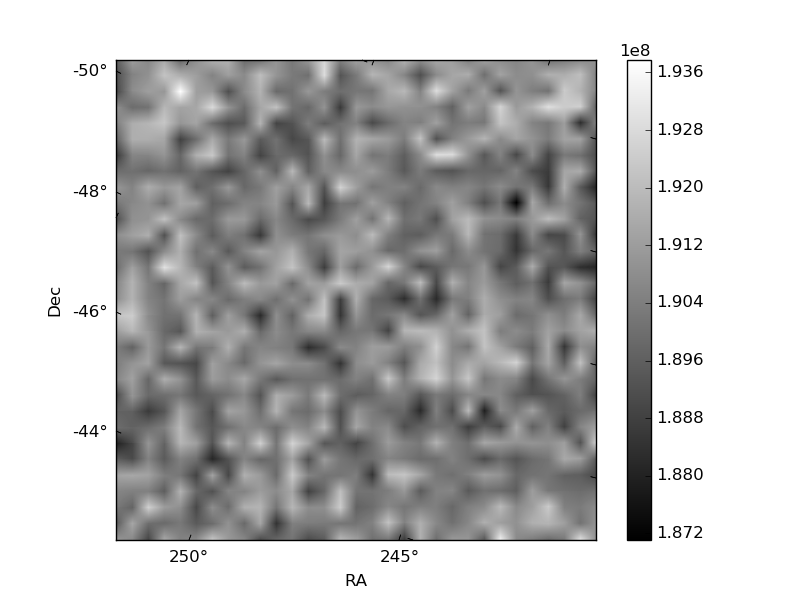
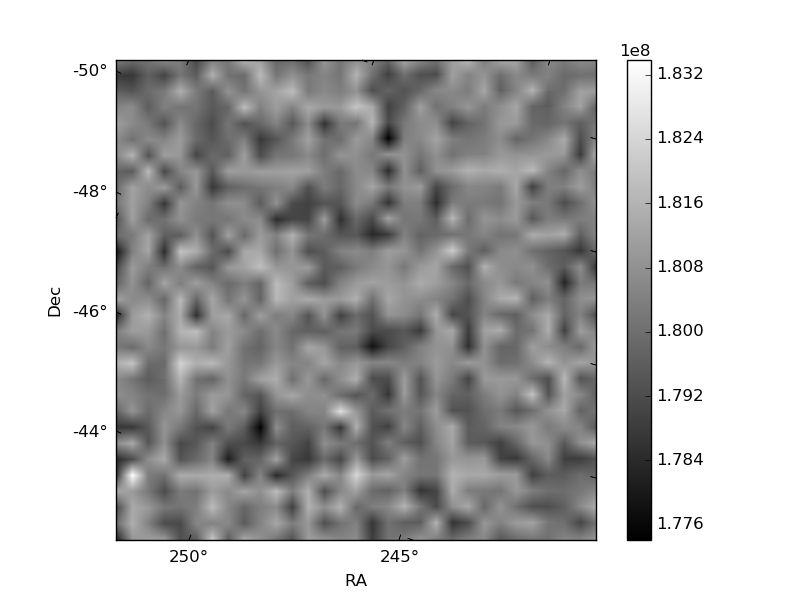
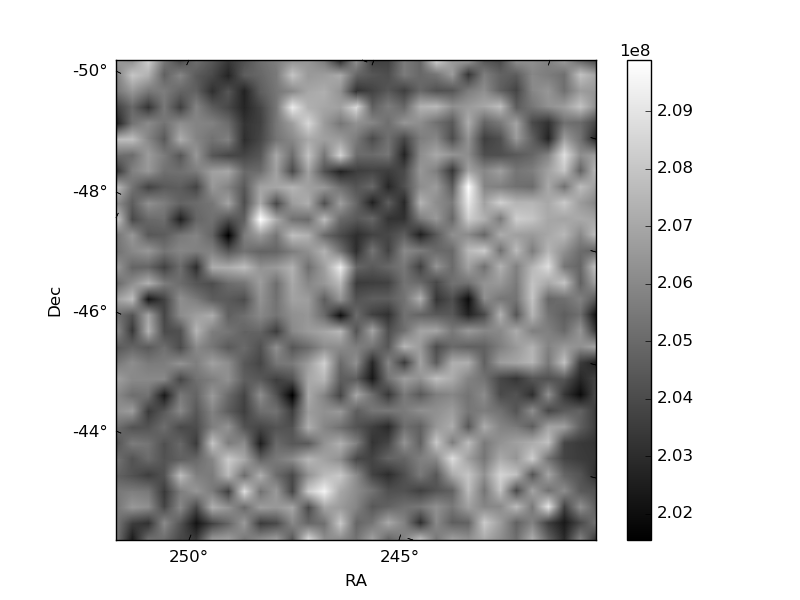
Histogram calculated using DETX and DETY for each event in the final _common_clean file
| Quadrant A | 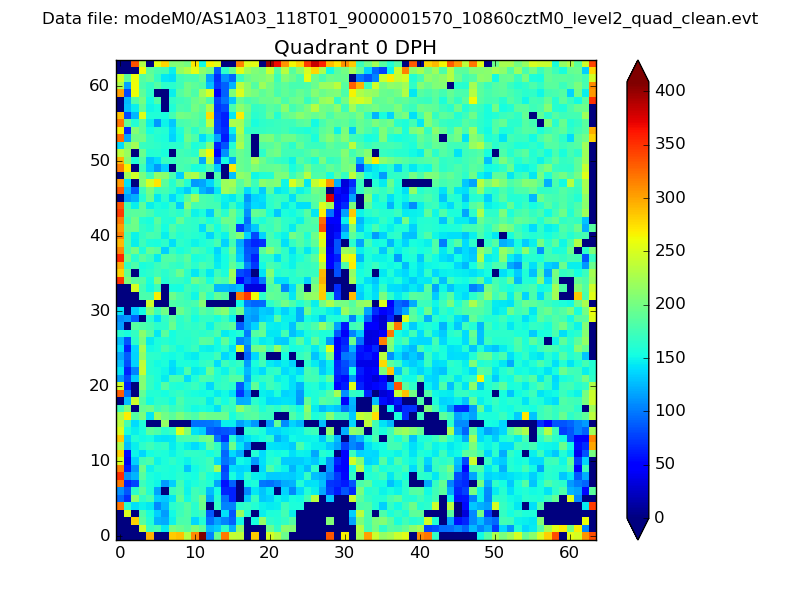 |
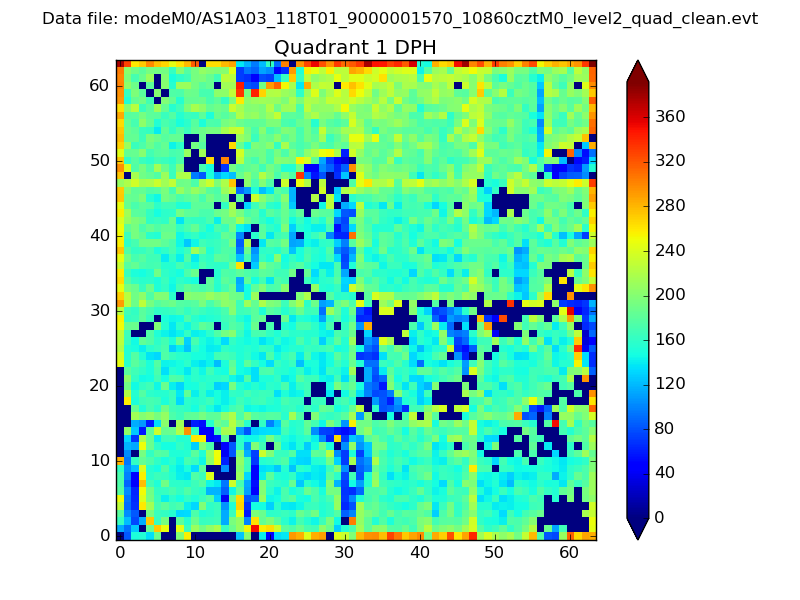 |
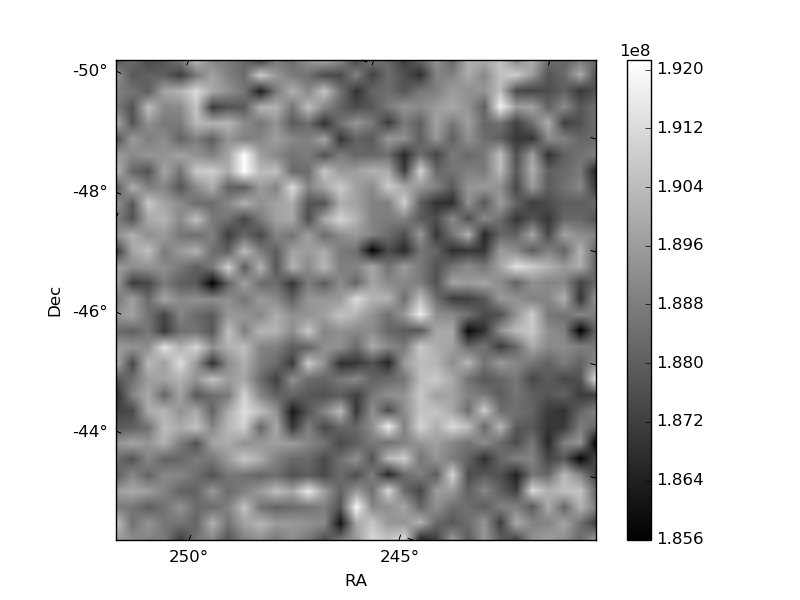
Quadrant B |
|---|---|---|---|
| Quadrant D | 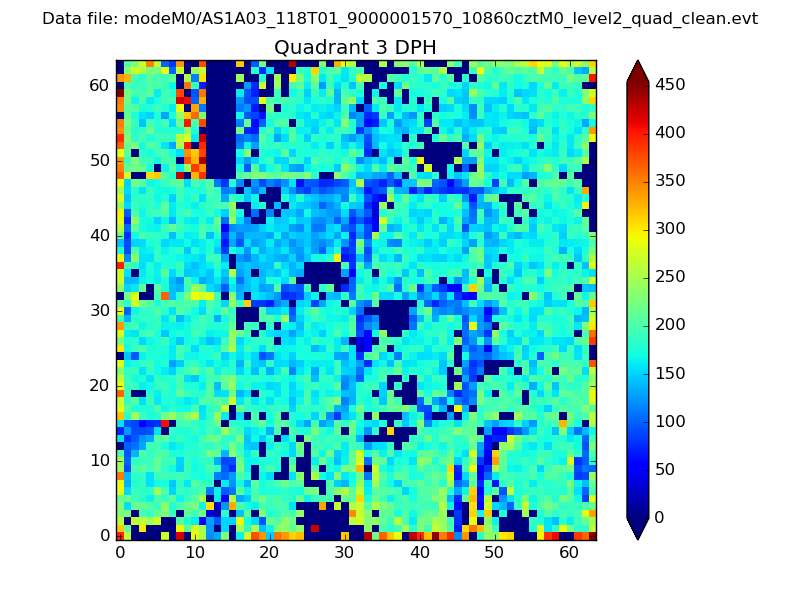 |
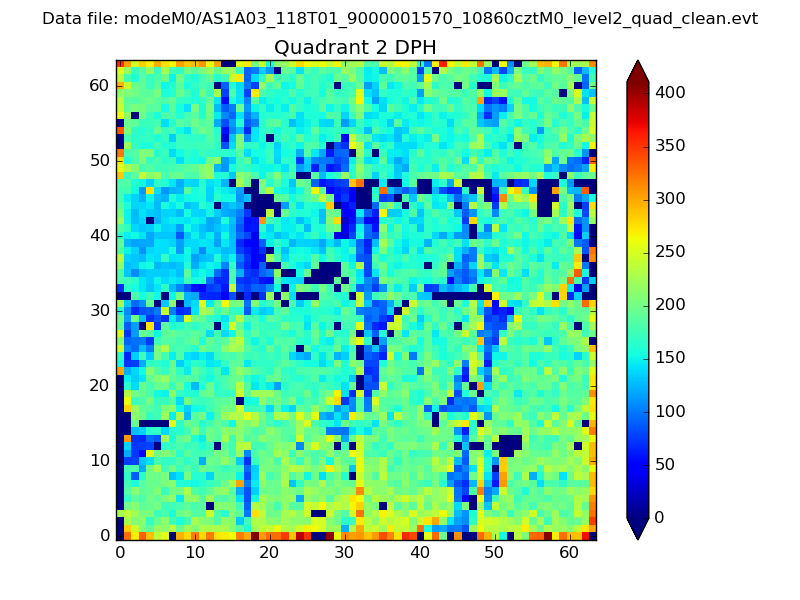 |
Quadrant C |
| Plot type | Count rate plots | Images |
|---|---|---|
| Comparison with Poisson distribution Blue bars denote a histogram of data divided into 1 sec bins. Red curve is a Poisson curve with rate = median count rate of data. |
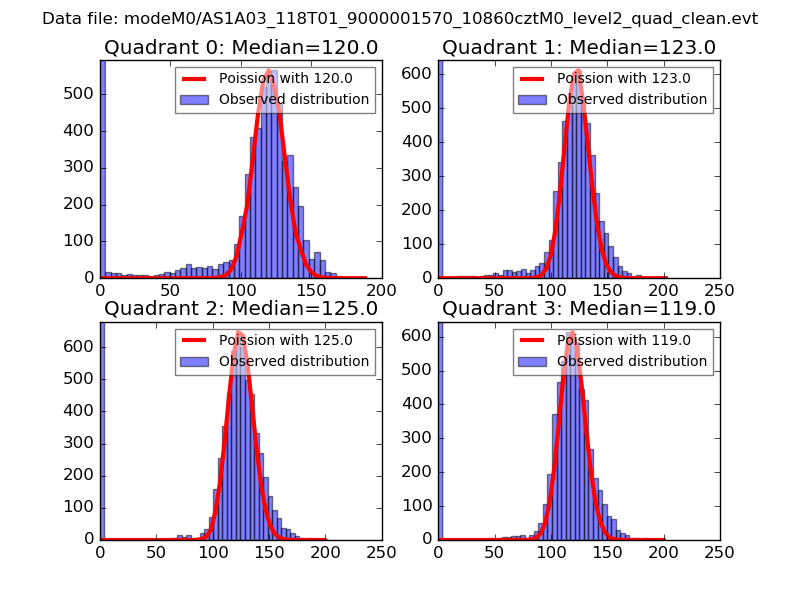 |
 |
| Quadrant-wise count rates Data is divided into 100 sec bins |
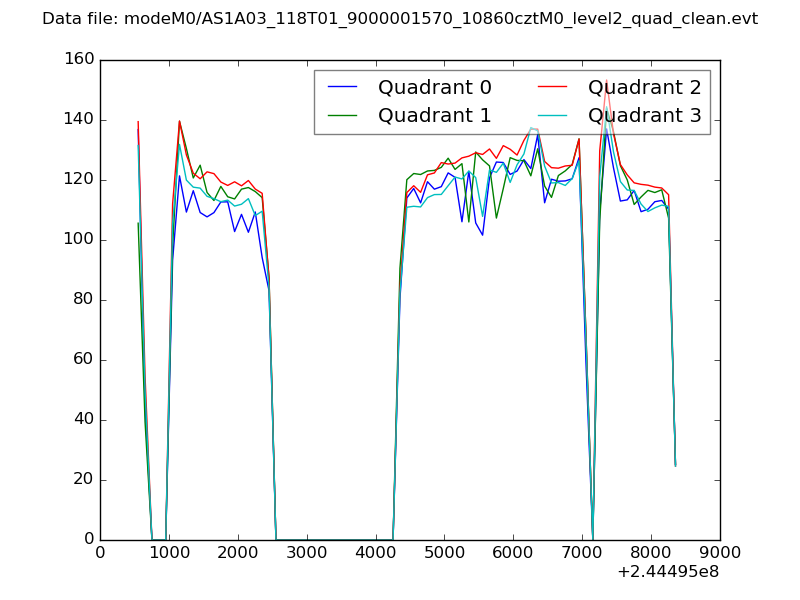 |
|
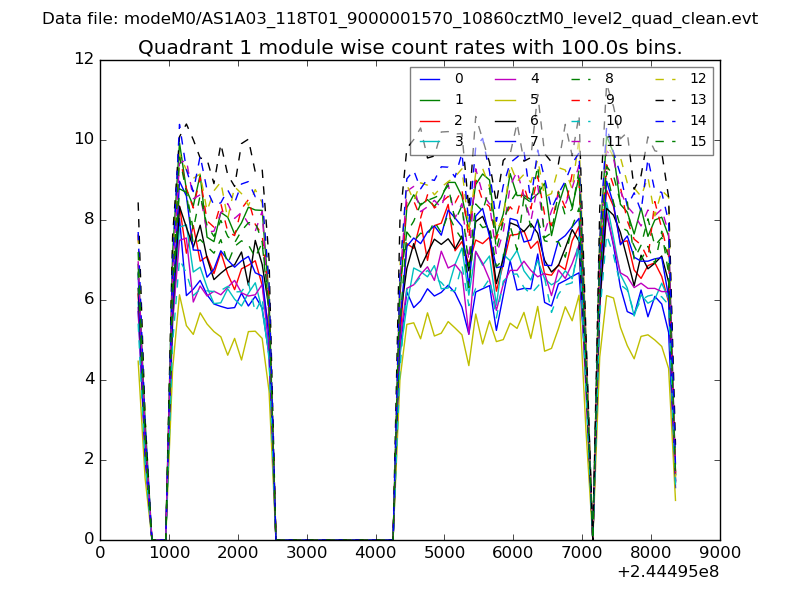
| Module-wise count rates for Quadrant A Data is divided into 100 sec bins |
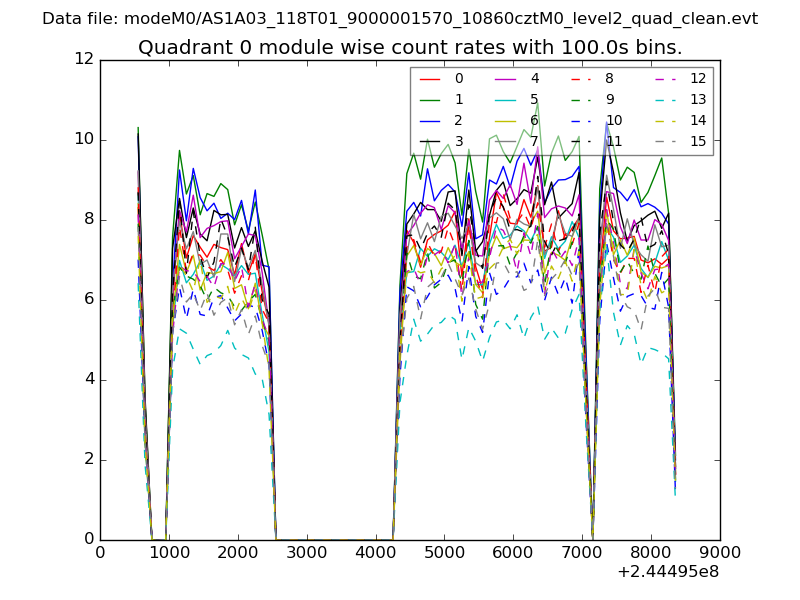 |
 |
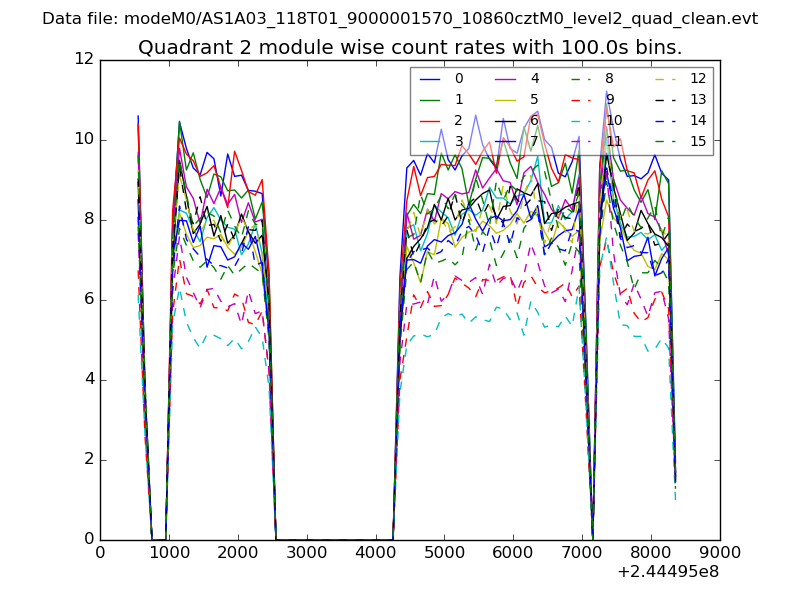
| Module-wise count rates for Quadrant B Data is divided into 100 sec bins |
 |
 |
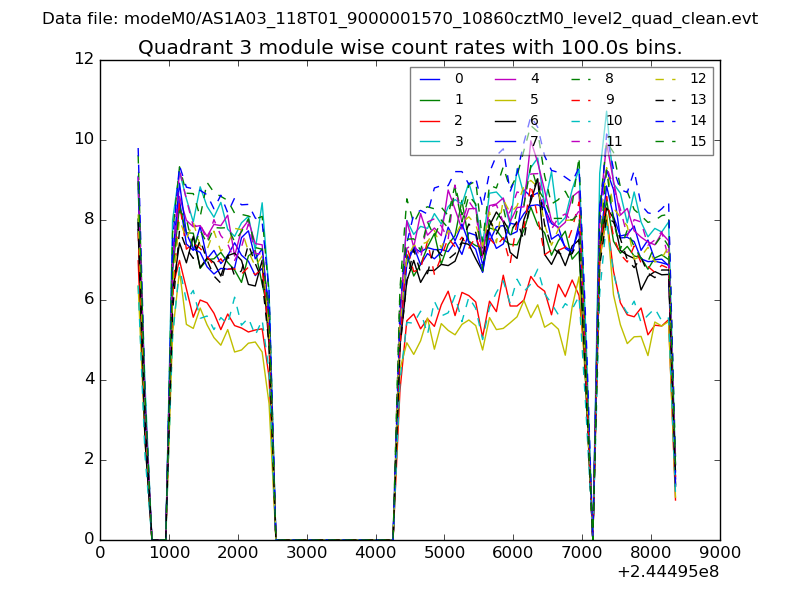
| Module-wise count rates for Quadrant C Data is divided into 100 sec bins |
 |
 |
| Module-wise count rates for Quadrant D Data is divided into 100 sec bins |
 |
 |
| Parameter | Plot |
|---|---|
| CZT HV Monitor | 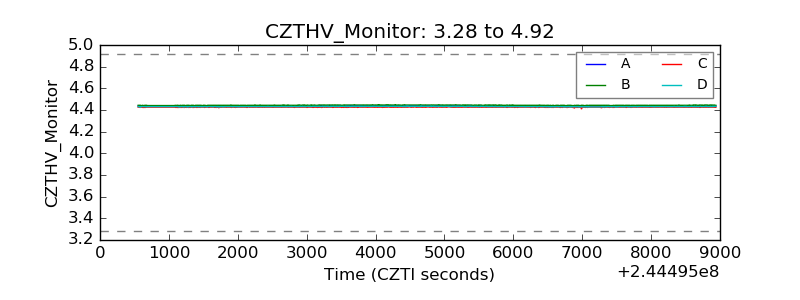 |
| D_VDD | 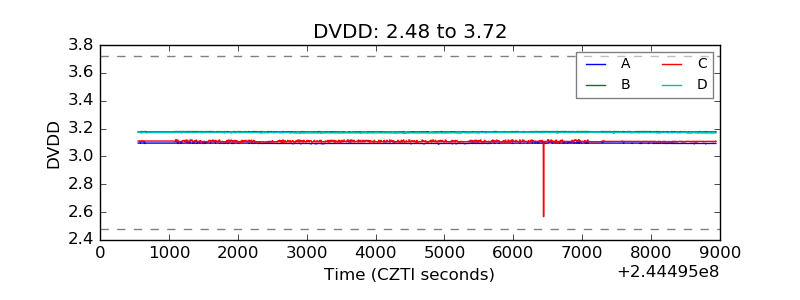 |
| Temperature 1 | 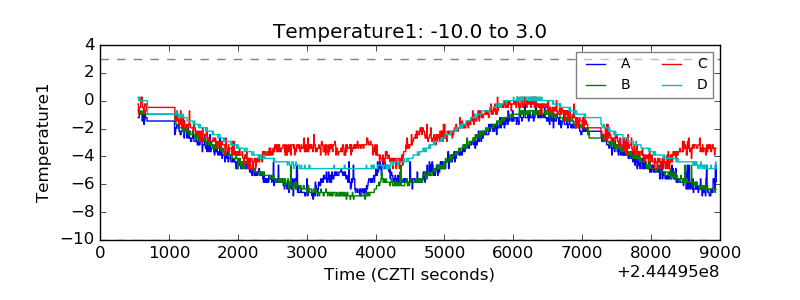 |
| Veto HV Monitor |  |
| Veto LLD |  |
| Alpha Counter | 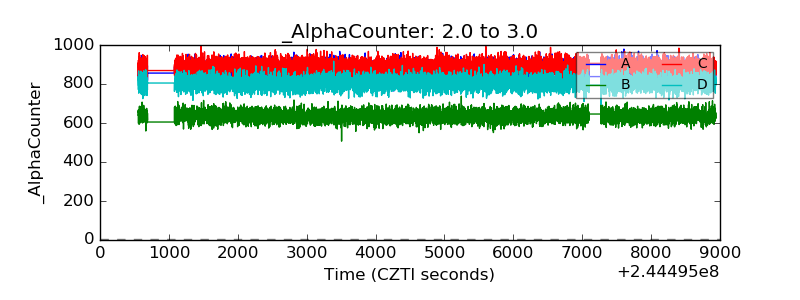 |
| _CPM_Rate | 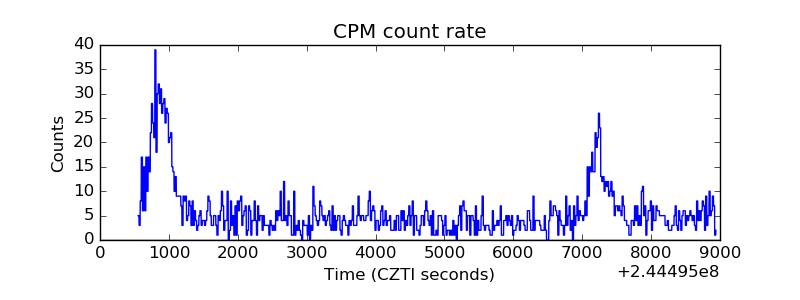 |
| CZT Counter | 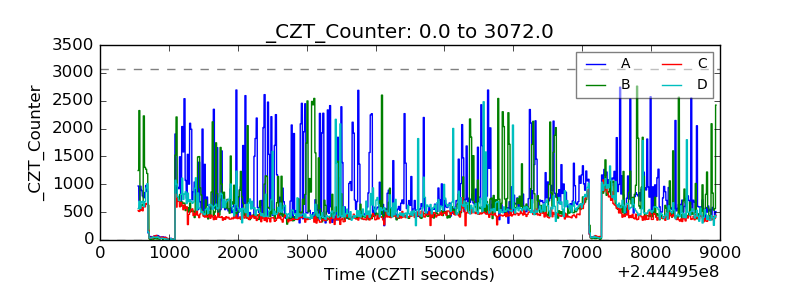 |
| +2.5 Volts monitor |  |
| +5 Volts monitor |  |
| _ROLL_ROT | 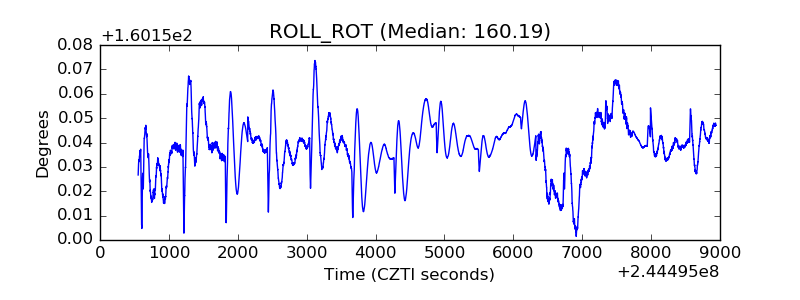 |
| _Roll_DEC | 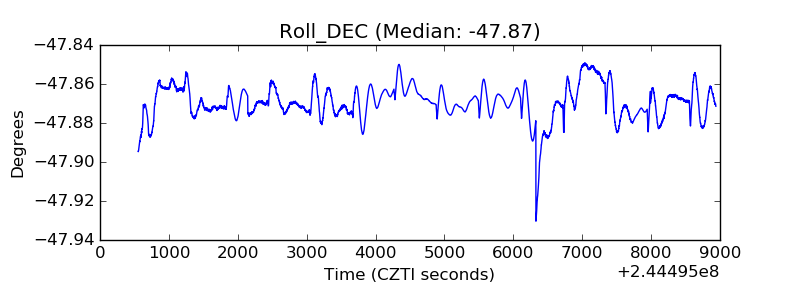 |
| _Roll_RA | 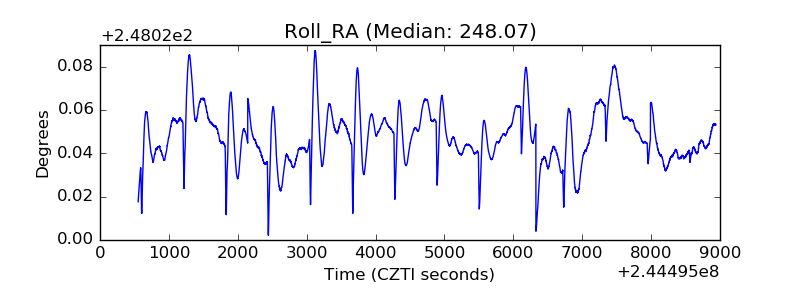 |
| Veto Counter | 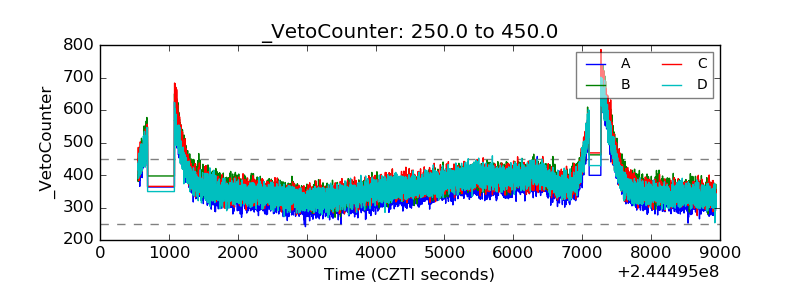 |