| Param | Original file | Final file |
|---|---|---|
| Filename | modeM0/AS1A03_118T01_9000001570_10861cztM0_level2.evt | modeM0/AS1A03_118T01_9000001570_10861cztM0_level2_quad_clean.evt |
| Size (bytes) | 642,026,880 | 93,686,400 |
| Size | 612.3 MB | 89.3 MB |
| Events in quadrant A | 6,181,243 | 557,310 |
| Events in quadrant B | 4,980,966 | 584,516 |
| Events in quadrant C | 3,437,807 | 596,155 |
| Events in quadrant D | 4,321,341 | 562,406 |
| Mode M9 | |||
|---|---|---|---|
| Quadrant | BADHDUFLAG | Total packets | Discarded packets |
| A | 0 | 5 | 0 |
| B | 0 | 5 | 0 |
| C | 0 | 5 | 0 |
| D | 0 | 5 | 0 |
| Mode SS | |||
|---|---|---|---|
| Quadrant | BADHDUFLAG | Total packets | Discarded packets |
| A | 0 | 160 | 0 |
| B | 0 | 160 | 0 |
| C | 0 | 160 | 0 |
| D | 0 | 160 | 0 |
| Mode M0 | |||
|---|---|---|---|
| Quadrant | BADHDUFLAG | Total packets | Discarded packets |
| A | 0 | 23709 | 3 |
| B | 0 | 19925 | 2 |
| C | 0 | 15942 | 2 |
| D | 0 | 18041 | 2 |
| Quadrant | Total seconds | Saturated seconds | Saturation percentage |
|---|---|---|---|
| A | 7705 | 789 | 10.240104% |
| B | 7705 | 472 | 6.125892% |
| C | 7705 | 89 | 1.155094% |
| D | 7705 | 147 | 1.907852% |
Noise dominated data is calculated using 1-second bins in cleaned event files. If a bin has >2000 counts, and if more than 50% of those come from <1% of pixels, then it is considered to be noise-dominated and hence unusable.
| Quadrant | # 1 sec bins | Bins with >0 counts | Bins with >2000 counts | High rate bins dominated by noise | Noise dominated (total time) | Noise dominated (detector-on time) | Marked lightcurve |
|---|---|---|---|---|---|---|---|
| A | 8245 | 7707 | 398 | 398 | 4.83% | 5.16% | 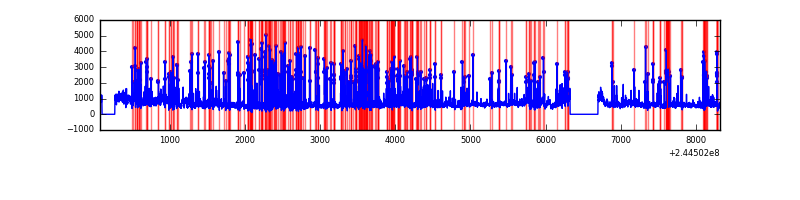 |
| B | 8245 | 7707 | 212 | 212 | 2.57% | 2.75% | 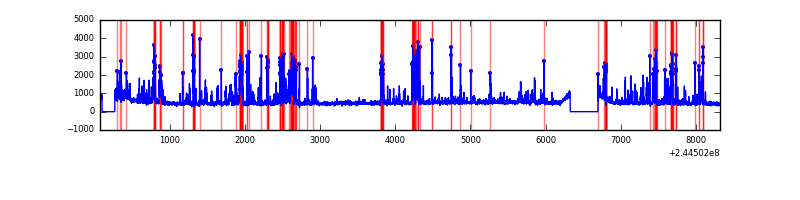 |
| C | 8245 | 7707 | 0 | 0 | 0.00% | 0.00% | 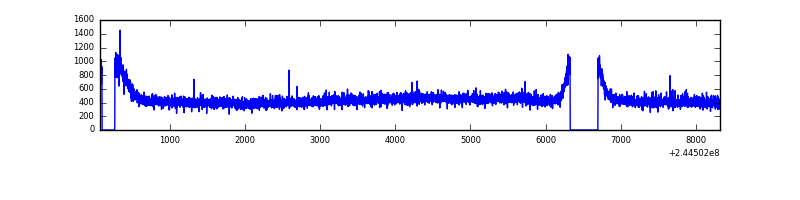 |
| D | 8245 | 7707 | 66 | 66 | 0.80% | 0.86% | 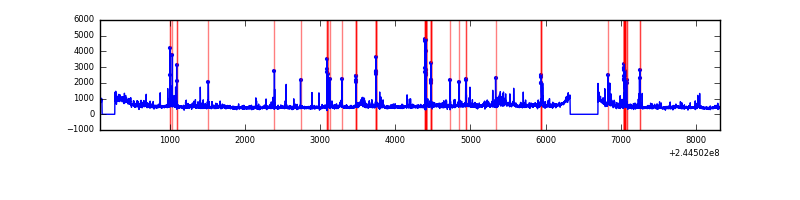 |
Top three noisy pixels from each quadrant. If the there are fewer than three noisy pixels in the level2.evt file, extra rows are filled as -1
| Pixel properties | Quadrant properties | ||||||
|---|---|---|---|---|---|---|---|
| Quadrant | DetID | PixID | Counts | Sigma | Mean | Median | Sigma |
| A | 8 | 5 | 2569517 | 14550.14 | 864 | 845 | 176.5 |
| A | 15 | 223 | 159492 | 898.65 | 864 | 845 | 176.5 |
| A | 15 | 239 | 67639 | 378.35 | 864 | 845 | 176.5 |
| B | 4 | 239 | 1324548 | 7598.6 | 894 | 870 | 174.2 |
| B | 15 | 255 | 37856 | 212.32 | 894 | 870 | 174.2 |
| B | 0 | 214 | 35639 | 199.59 | 894 | 870 | 174.2 |
| C | 8 | 208 | 7932 | 34.35 | 877 | 880 | 205.3 |
| C | 13 | 61 | 6720 | 28.45 | 877 | 880 | 205.3 |
| C | 14 | 234 | 3574 | 13.12 | 877 | 880 | 205.3 |
| D | 8 | 195 | 393312 | 1856.26 | 868 | 842 | 211.4 |
| D | 1 | 52 | 325210 | 1534.16 | 868 | 842 | 211.4 |
| D | 7 | 71 | 64198 | 299.65 | 868 | 842 | 211.4 |
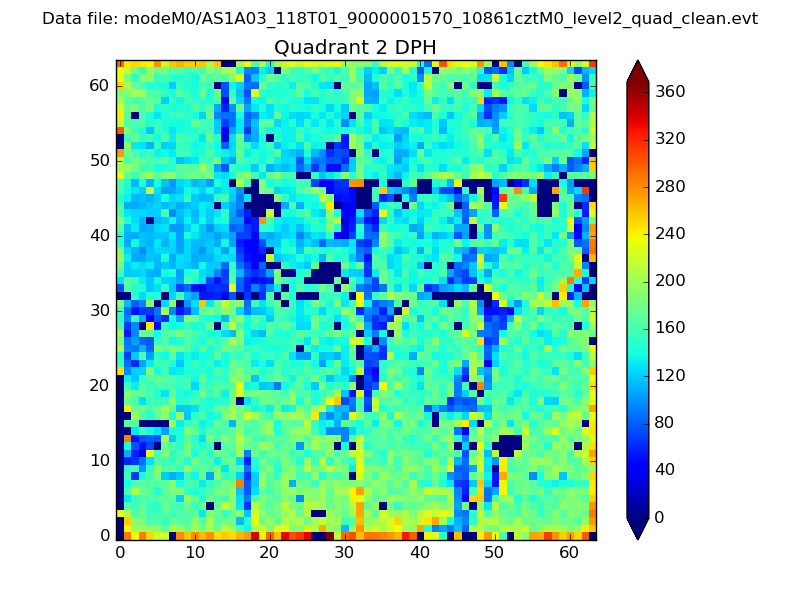
Histogram calculated using DETX and DETY for each event in the final _common_clean file
| Quadrant A | 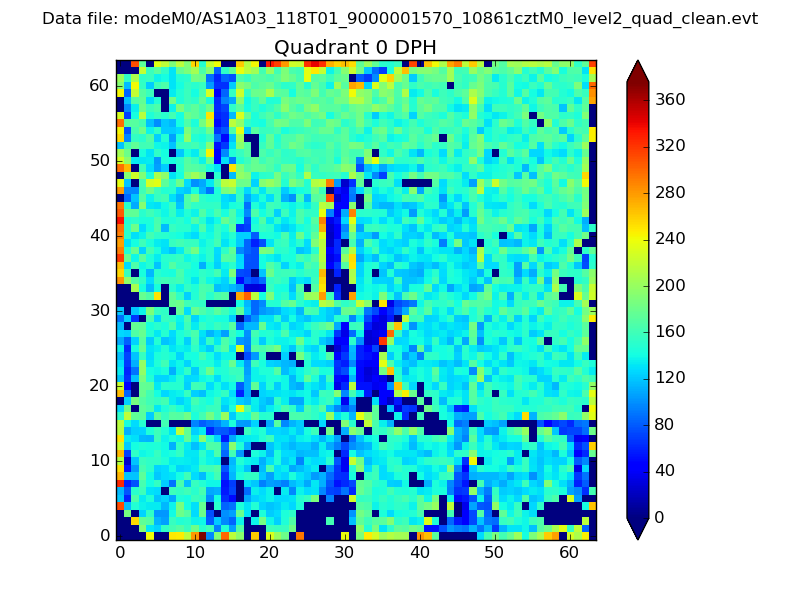 |
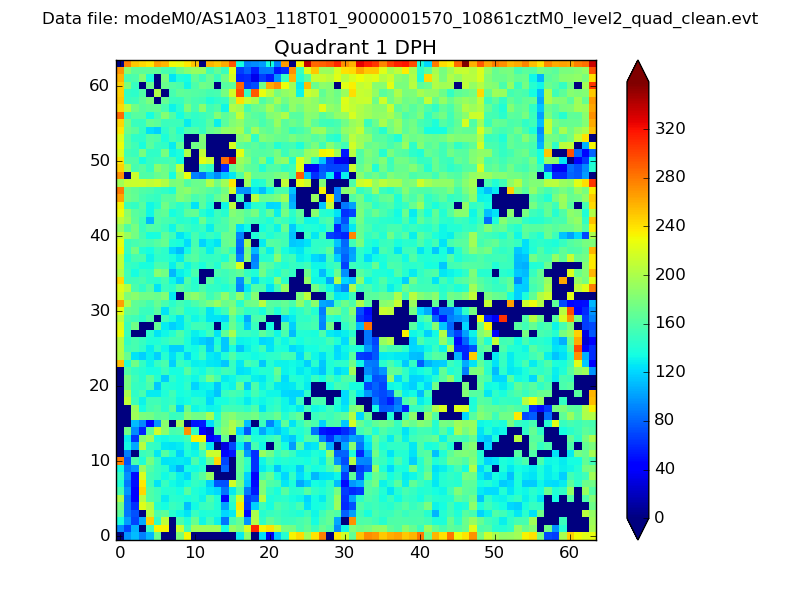 |
Quadrant B |
|---|---|---|---|
| Quadrant D | 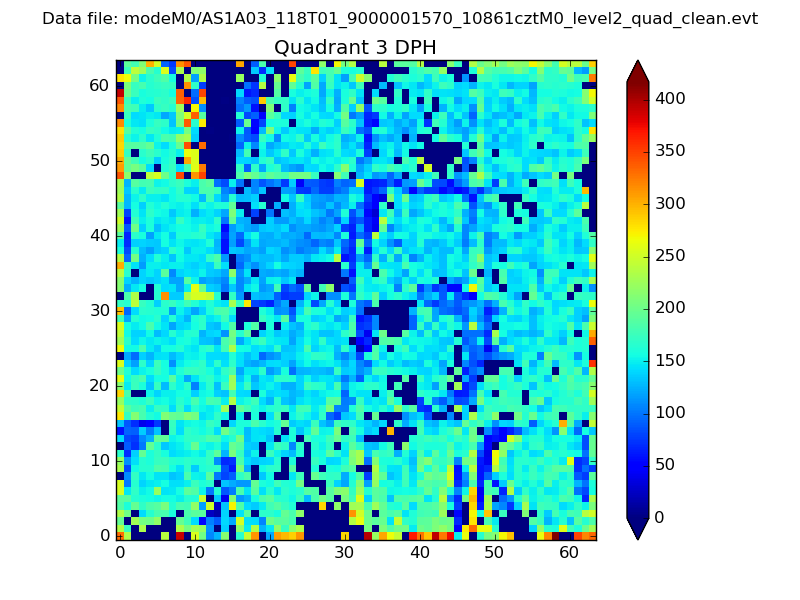 |
 |
Quadrant C |
| Plot type | Count rate plots | Images |
|---|---|---|
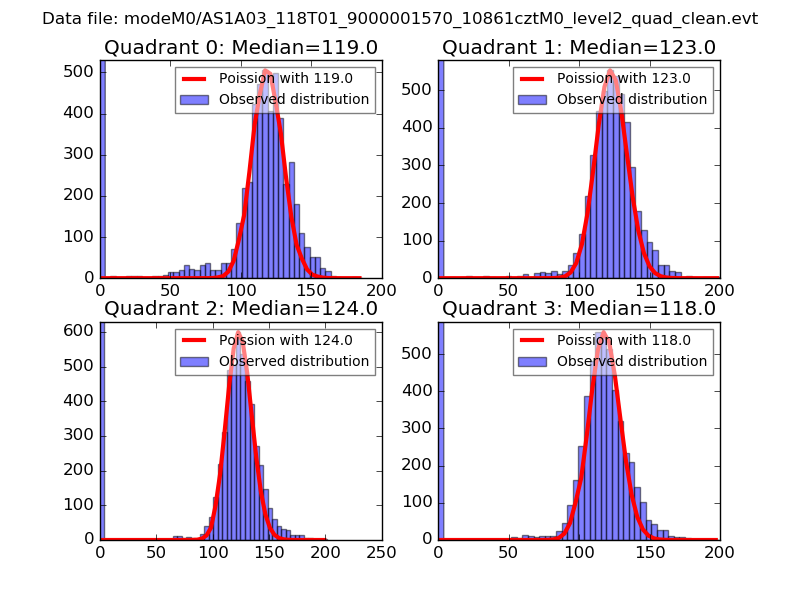
| Comparison with Poisson distribution Blue bars denote a histogram of data divided into 1 sec bins. Red curve is a Poisson curve with rate = median count rate of data. |
 |
 |
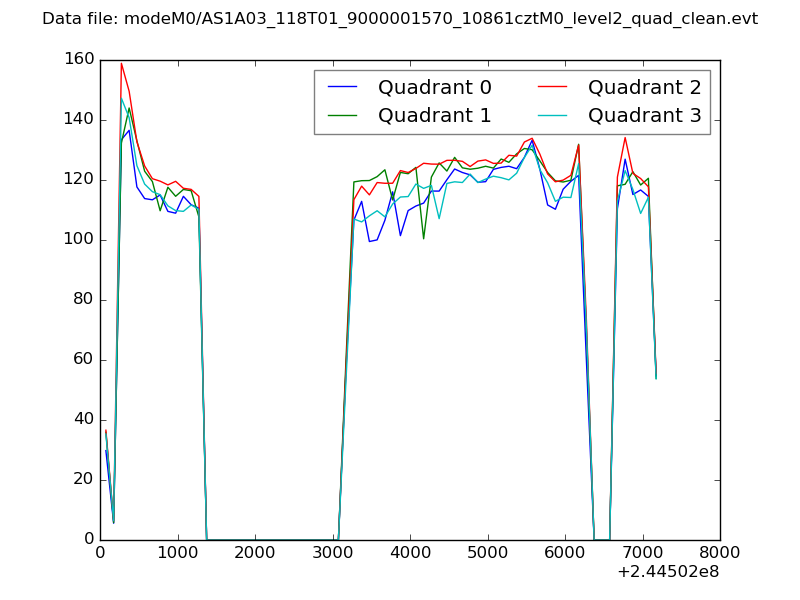
| Quadrant-wise count rates Data is divided into 100 sec bins |
 |
|
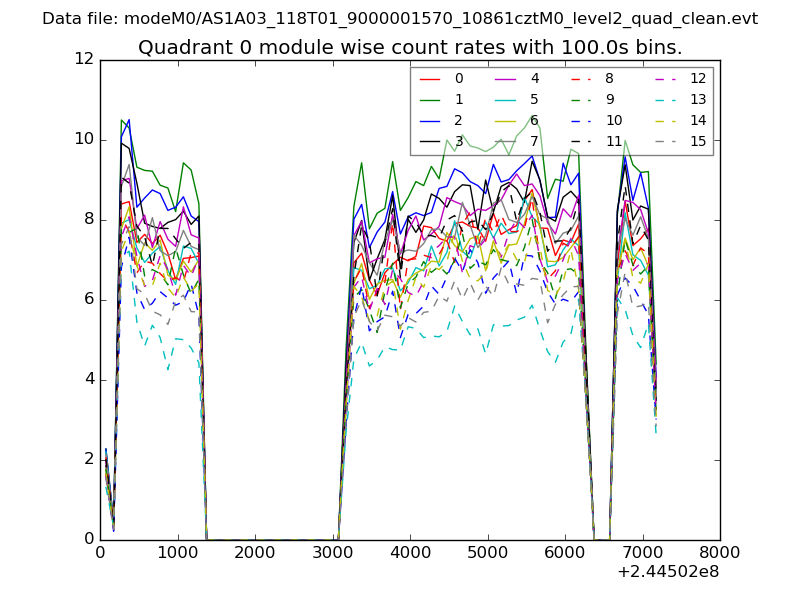
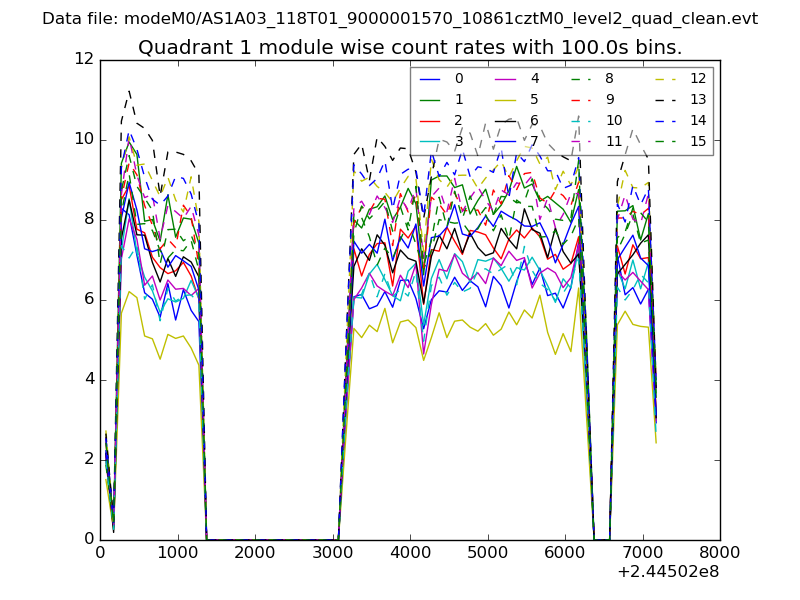
| Module-wise count rates for Quadrant A Data is divided into 100 sec bins |
 |
 |
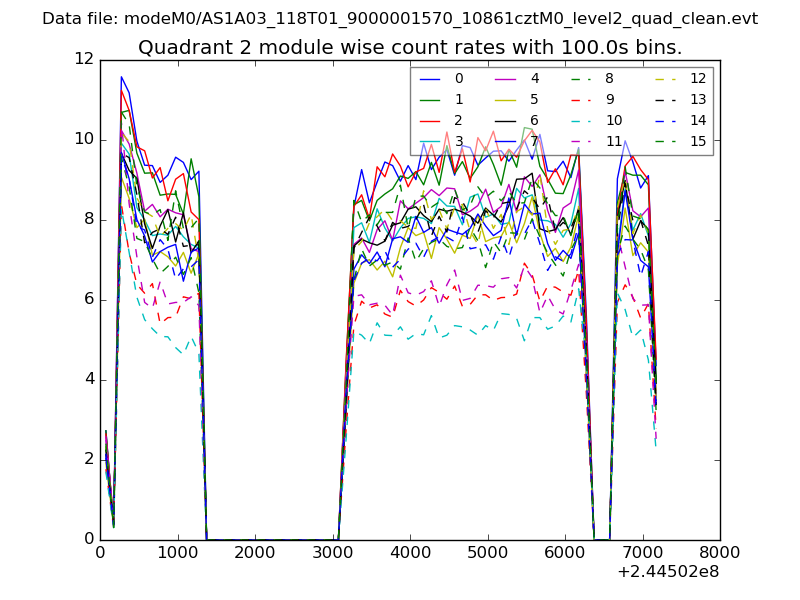
| Module-wise count rates for Quadrant B Data is divided into 100 sec bins |
 |
 |
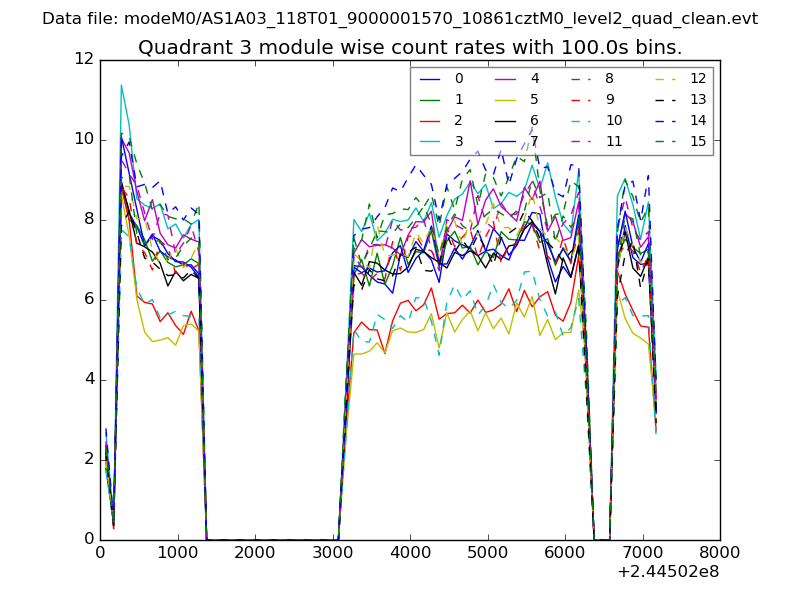
| Module-wise count rates for Quadrant C Data is divided into 100 sec bins |
 |
 |
| Module-wise count rates for Quadrant D Data is divided into 100 sec bins |
 |
 |
| Parameter | Plot |
|---|---|
| CZT HV Monitor | 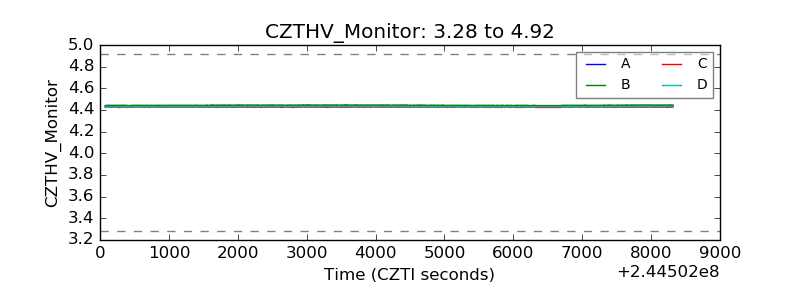 |
| D_VDD | 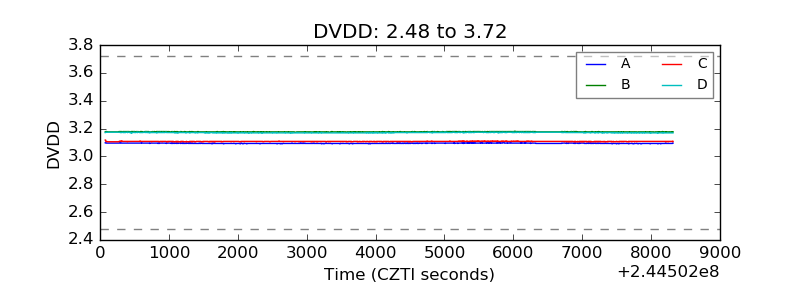 |
| Temperature 1 | 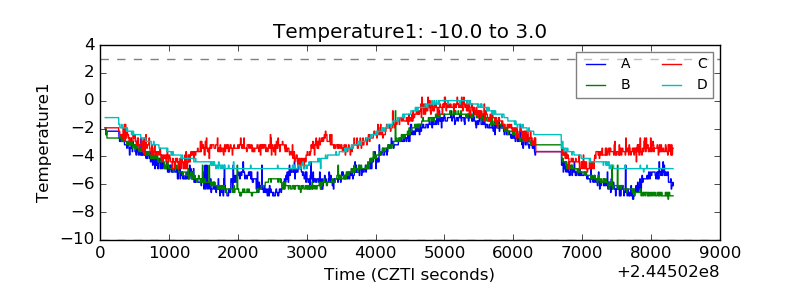 |
| Veto HV Monitor | 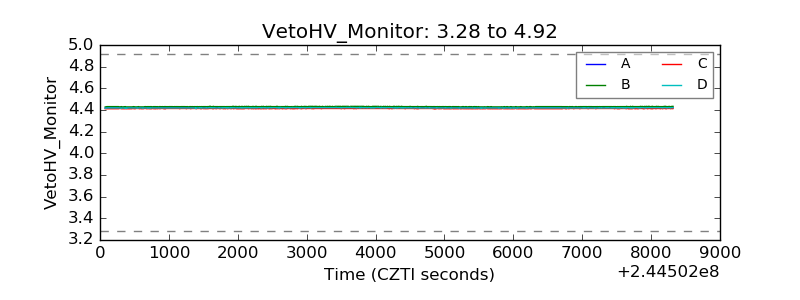 |
| Veto LLD | 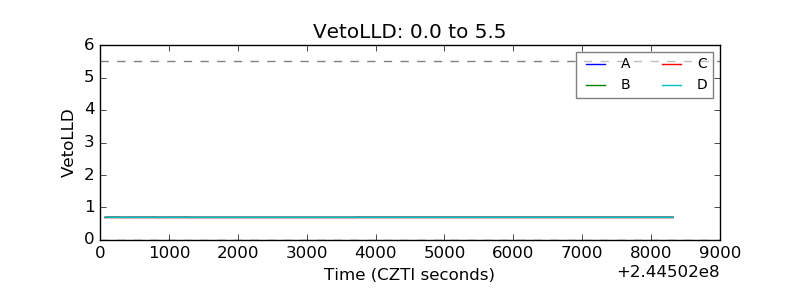 |
| Alpha Counter | 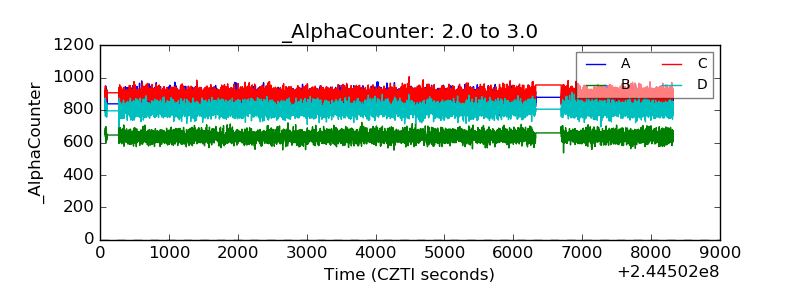 |
| _CPM_Rate | 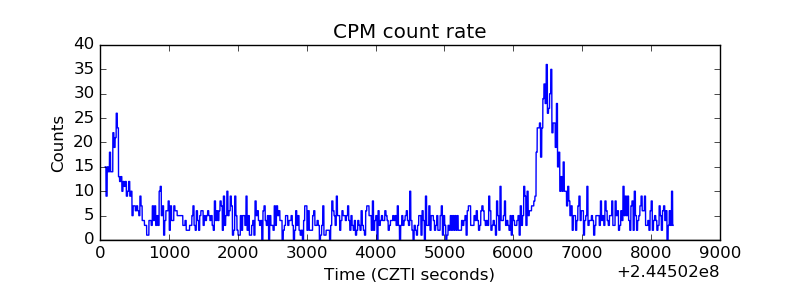 |
| CZT Counter | 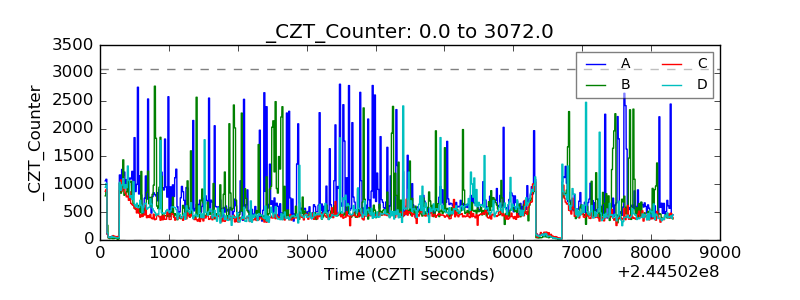 |
| +2.5 Volts monitor | 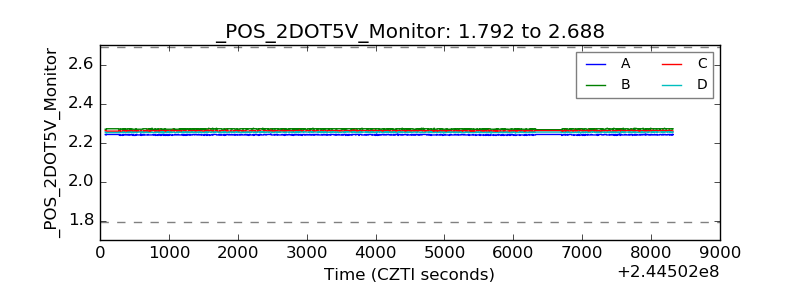 |
| +5 Volts monitor | 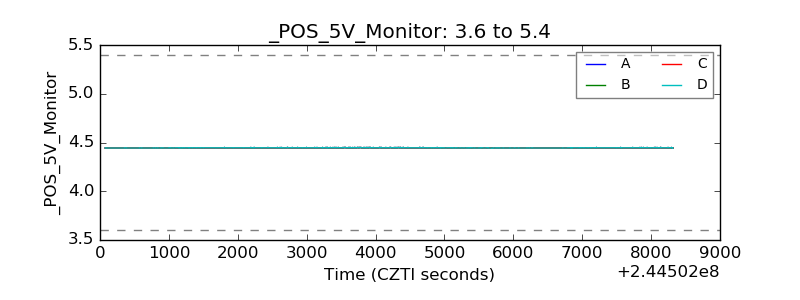 |
| _ROLL_ROT | 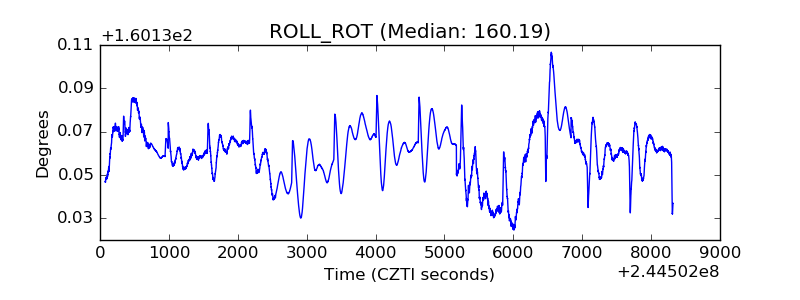 |
| _Roll_DEC | 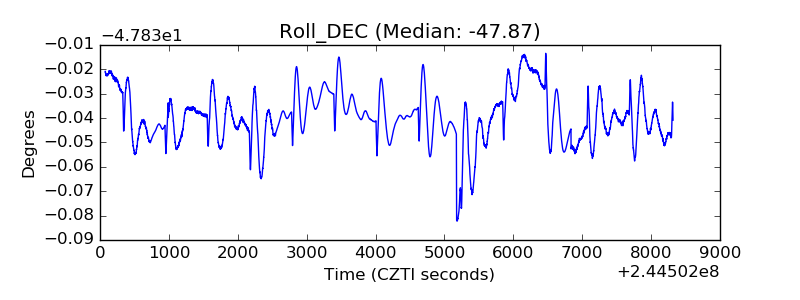 |
| _Roll_RA | 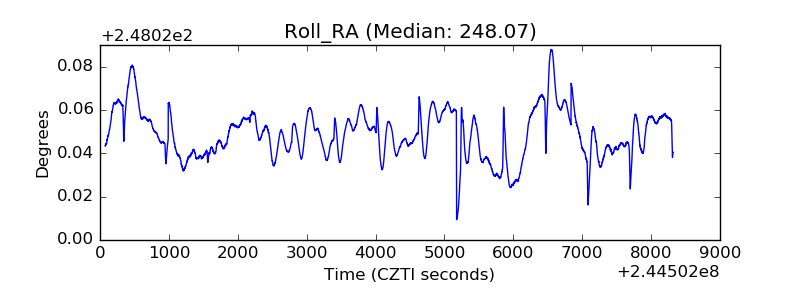 |
| Veto Counter | 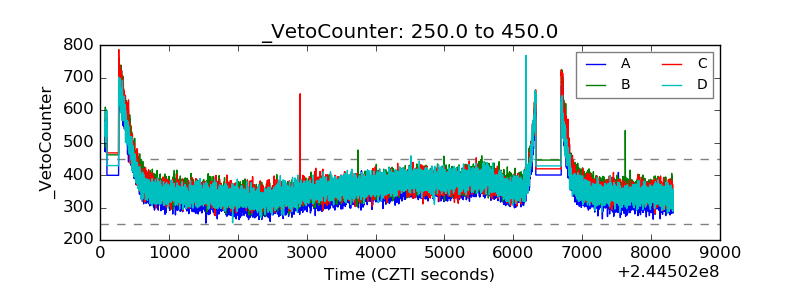 |