| Param | Original file | Final file |
|---|---|---|
| Filename | modeM0/AS1A03_118T01_9000001570_10863cztM0_level2.evt | modeM0/AS1A03_118T01_9000001570_10863cztM0_level2_quad_clean.evt |
| Size (bytes) | 791,009,280 | 111,355,200 |
| Size | 754.4 MB | 106.2 MB |
| Events in quadrant A | 7,761,780 | 670,765 |
| Events in quadrant B | 6,290,134 | 679,147 |
| Events in quadrant C | 4,179,692 | 701,643 |
| Events in quadrant D | 5,084,358 | 664,636 |
| Mode M9 | |||
|---|---|---|---|
| Quadrant | BADHDUFLAG | Total packets | Discarded packets |
| A | 0 | 10 | 0 |
| B | 0 | 10 | 0 |
| C | 0 | 10 | 0 |
| D | 0 | 10 | 0 |
| Mode SS | |||
|---|---|---|---|
| Quadrant | BADHDUFLAG | Total packets | Discarded packets |
| A | 0 | 192 | 0 |
| B | 0 | 192 | 0 |
| C | 0 | 192 | 0 |
| D | 0 | 192 | 0 |
| Mode M0 | |||
|---|---|---|---|
| Quadrant | BADHDUFLAG | Total packets | Discarded packets |
| A | 0 | 29755 | 3 |
| B | 0 | 25121 | 2 |
| C | 0 | 19326 | 2 |
| D | 0 | 21667 | 2 |
| Quadrant | Total seconds | Saturated seconds | Saturation percentage |
|---|---|---|---|
| A | 9462 | 807 | 8.528852% |
| B | 9462 | 626 | 6.615937% |
| C | 9462 | 39 | 0.412175% |
| D | 9462 | 114 | 1.204819% |
Noise dominated data is calculated using 1-second bins in cleaned event files. If a bin has >2000 counts, and if more than 50% of those come from <1% of pixels, then it is considered to be noise-dominated and hence unusable.
| Quadrant | # 1 sec bins | Bins with >0 counts | Bins with >2000 counts | High rate bins dominated by noise | Noise dominated (total time) | Noise dominated (detector-on time) | Marked lightcurve |
|---|---|---|---|---|---|---|---|
| A | 10397 | 9464 | 518 | 518 | 4.98% | 5.47% | 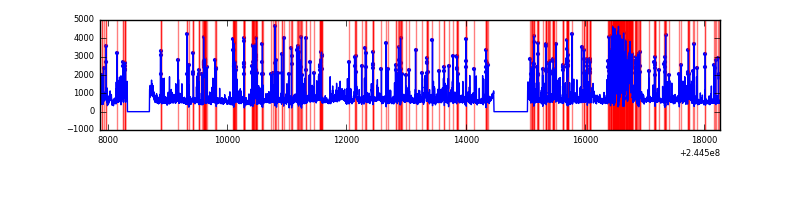 |
| B | 10397 | 9464 | 377 | 377 | 3.63% | 3.98% | 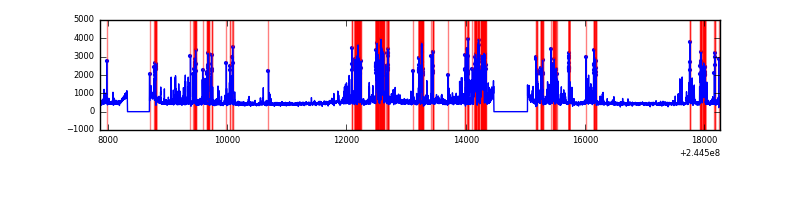 |
| C | 10397 | 9464 | 1 | 1 | 0.01% | 0.01% | 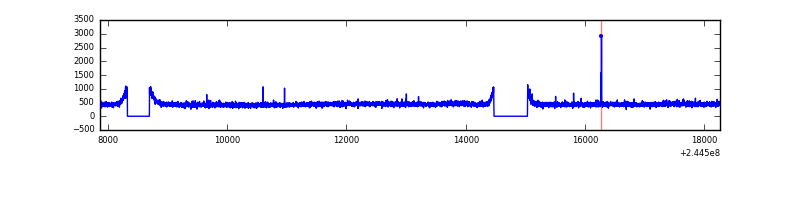 |
| D | 10397 | 9464 | 55 | 55 | 0.53% | 0.58% | 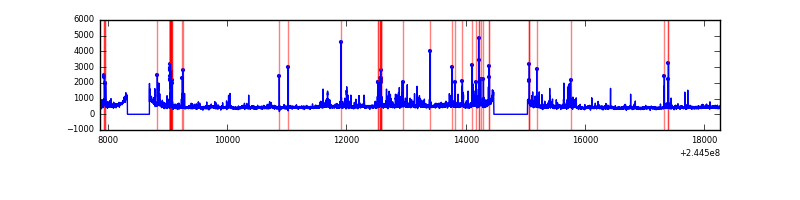 |
Top three noisy pixels from each quadrant. If the there are fewer than three noisy pixels in the level2.evt file, extra rows are filled as -1
| Pixel properties | Quadrant properties | ||||||
|---|---|---|---|---|---|---|---|
| Quadrant | DetID | PixID | Counts | Sigma | Mean | Median | Sigma |
| A | 8 | 5 | 2631190 | 12352.01 | 1045 | 1022 | 212.9 |
| A | 0 | 254 | 735584 | 3449.71 | 1045 | 1022 | 212.9 |
| A | 15 | 223 | 213684 | 998.72 | 1045 | 1022 | 212.9 |
| B | 4 | 239 | 1741576 | 8452.23 | 1070 | 1043 | 205.9 |
| B | 0 | 231 | 132237 | 637.09 | 1070 | 1043 | 205.9 |
| B | 15 | 204 | 128212 | 617.55 | 1070 | 1043 | 205.9 |
| C | 8 | 208 | 24564 | 95.62 | 1059 | 1063 | 245.8 |
| C | 12 | 4 | 12342 | 45.89 | 1059 | 1063 | 245.8 |
| C | 13 | 61 | 7692 | 26.97 | 1059 | 1063 | 245.8 |
| D | 1 | 52 | 352739 | 1380.28 | 1048 | 1017 | 254.8 |
| D | 8 | 195 | 284628 | 1112.99 | 1048 | 1017 | 254.8 |
| D | 5 | 222 | 208930 | 815.92 | 1048 | 1017 | 254.8 |
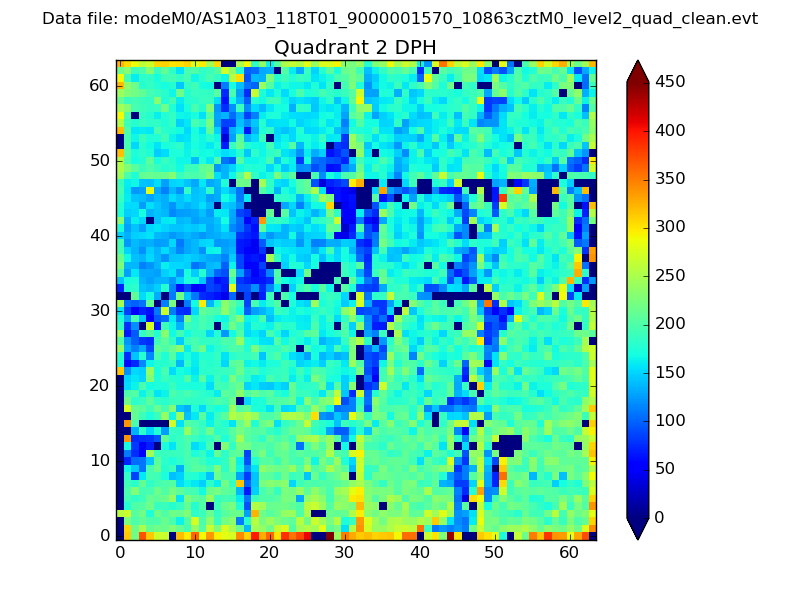
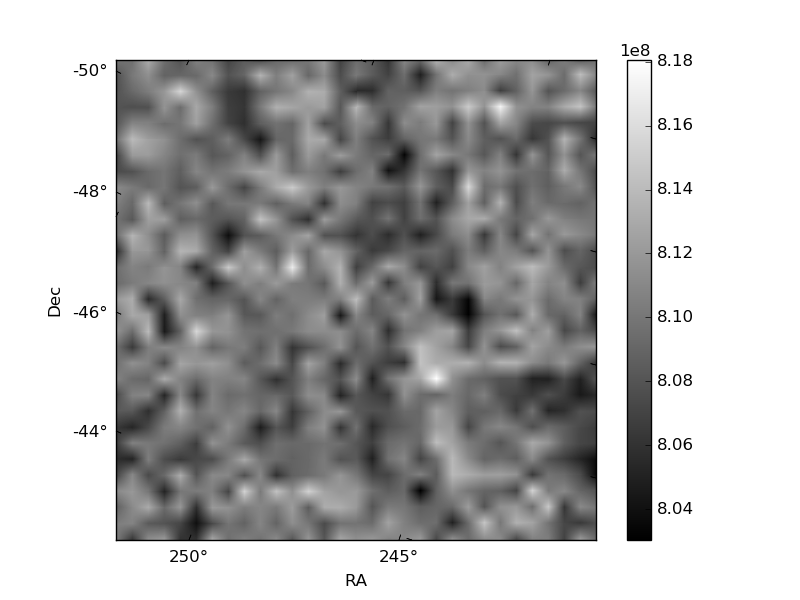
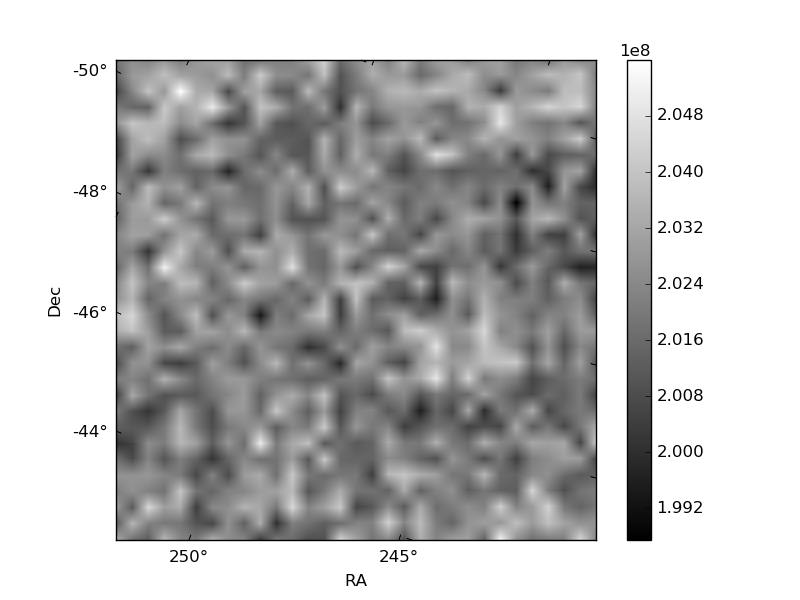
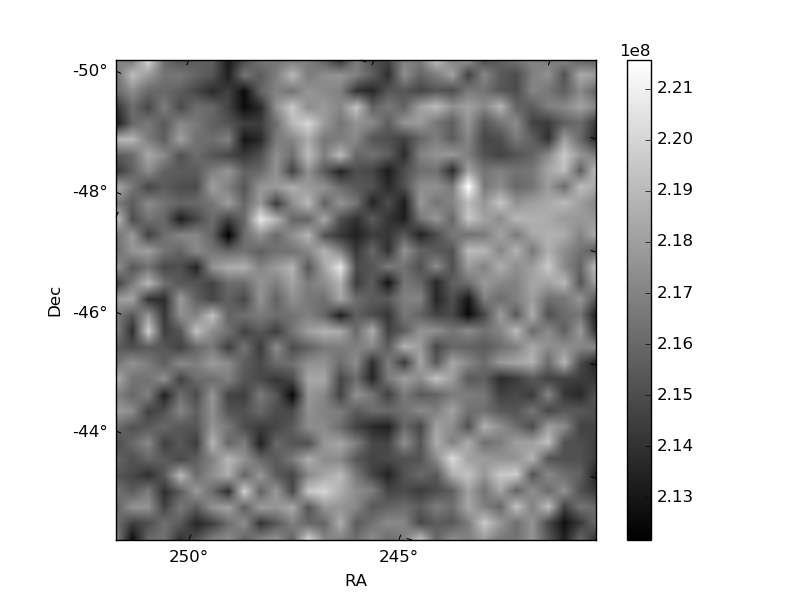
Histogram calculated using DETX and DETY for each event in the final _common_clean file
| Quadrant A | 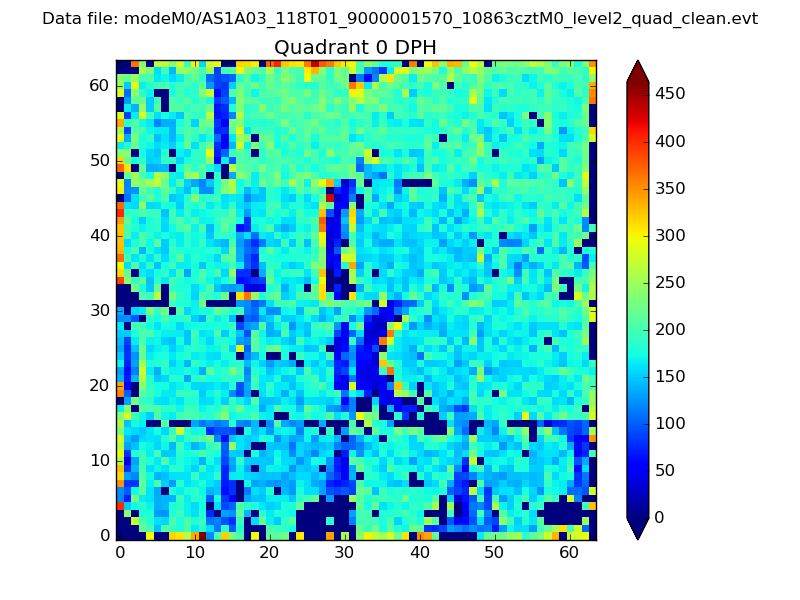 |
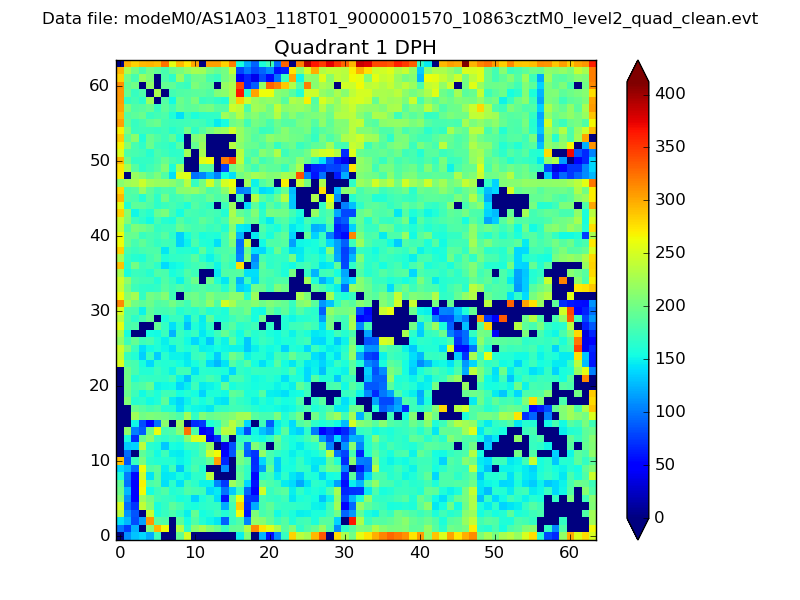 |
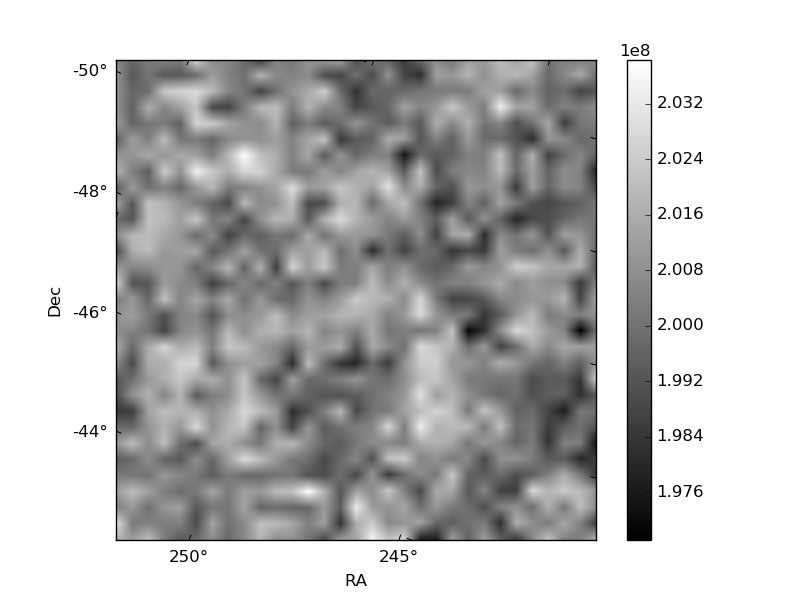
Quadrant B |
|---|---|---|---|
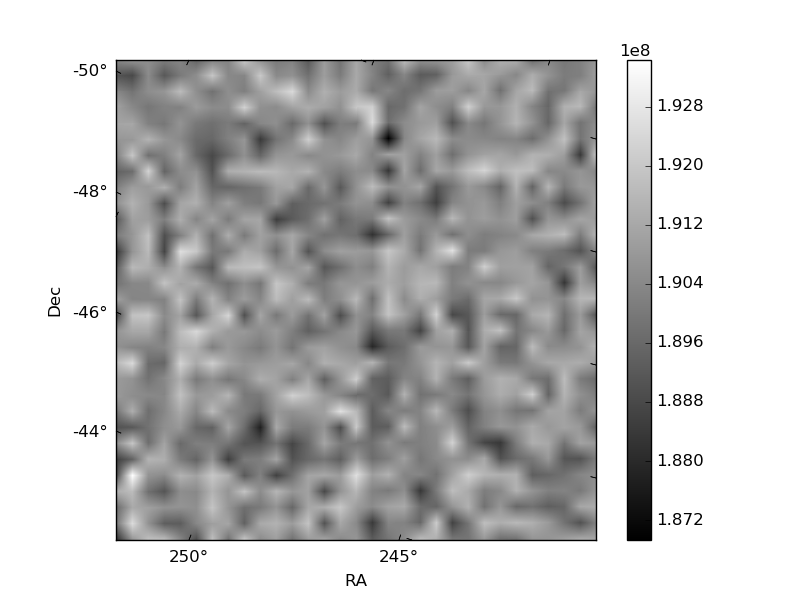
| Quadrant D | 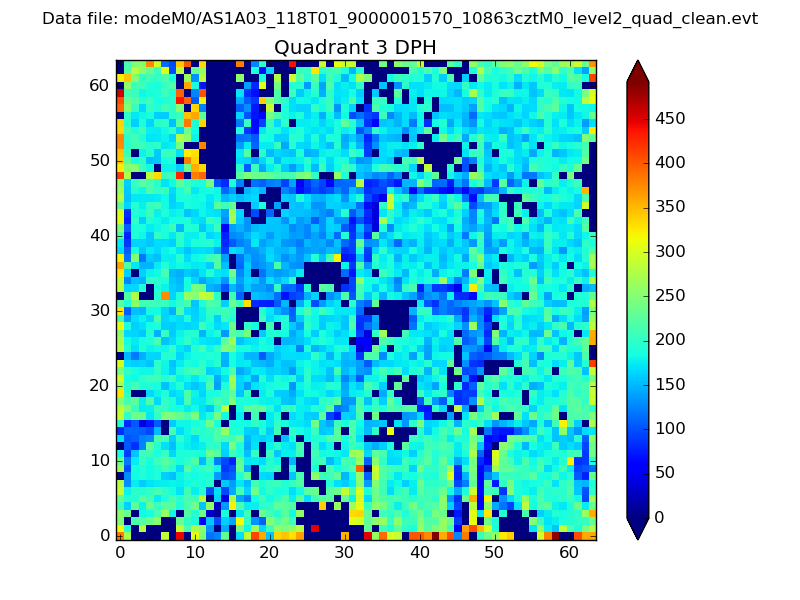 |
 |
Quadrant C |
| Plot type | Count rate plots | Images |
|---|---|---|
| Comparison with Poisson distribution Blue bars denote a histogram of data divided into 1 sec bins. Red curve is a Poisson curve with rate = median count rate of data. |
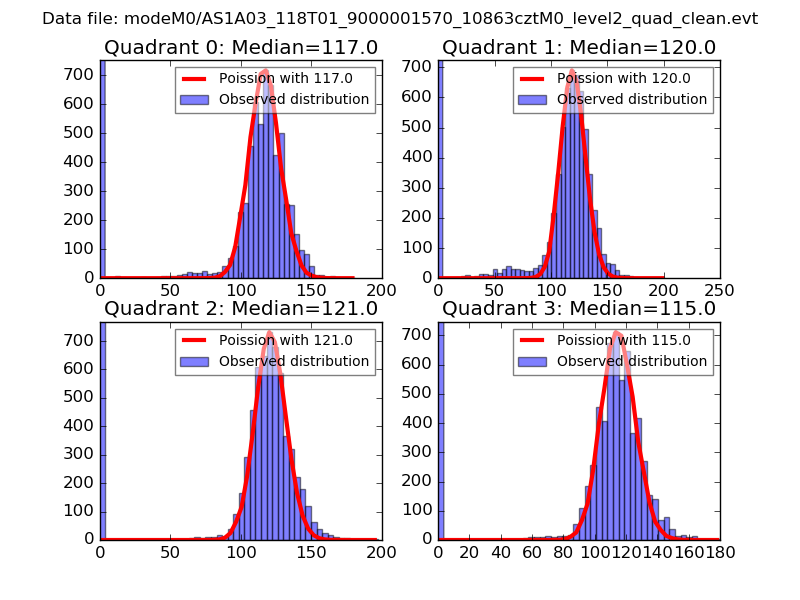 |
 |
| Quadrant-wise count rates Data is divided into 100 sec bins |
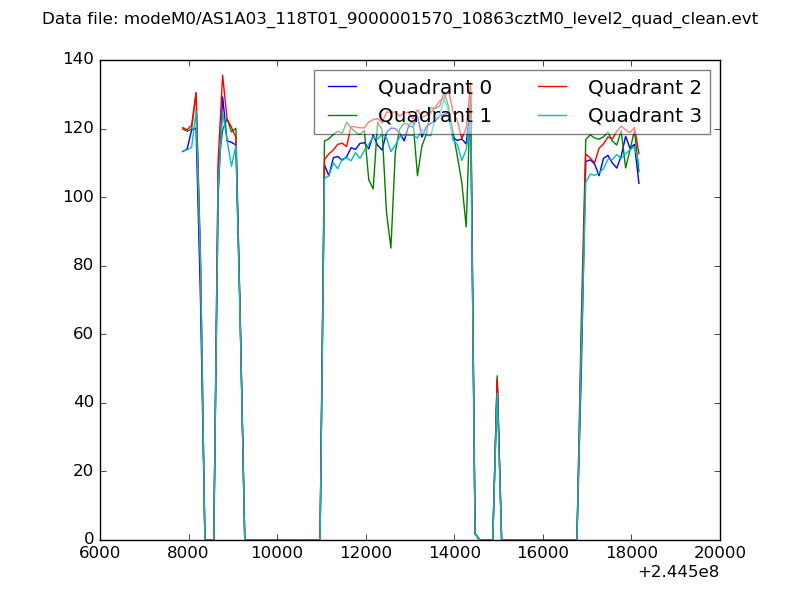 |
|
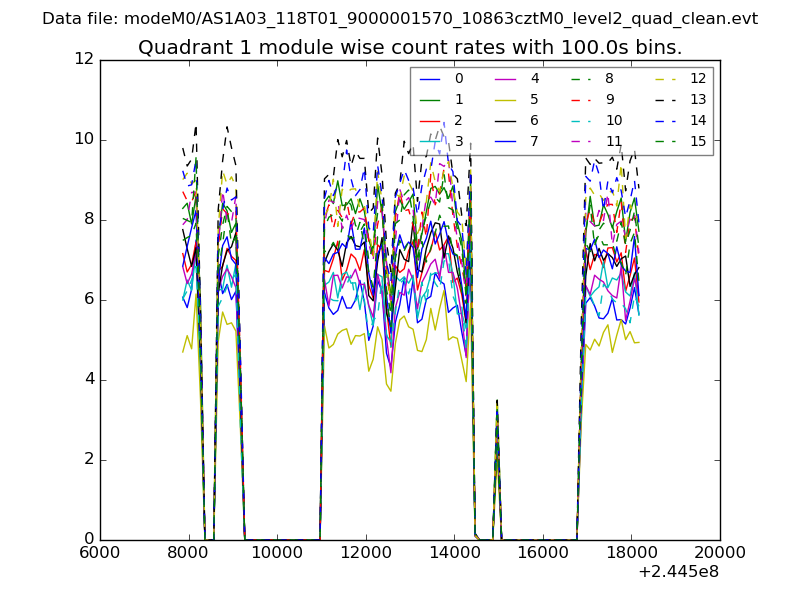
| Module-wise count rates for Quadrant A Data is divided into 100 sec bins |
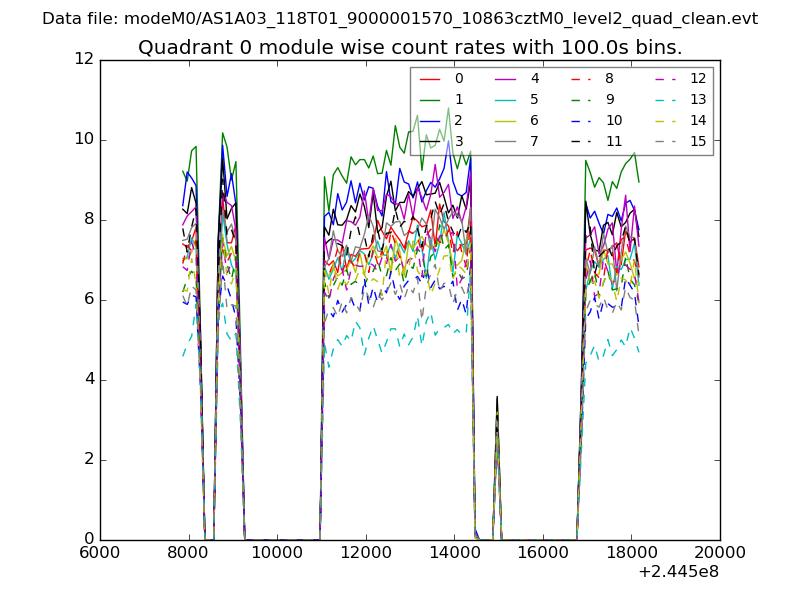 |
 |
| Module-wise count rates for Quadrant B Data is divided into 100 sec bins |
 |
 |
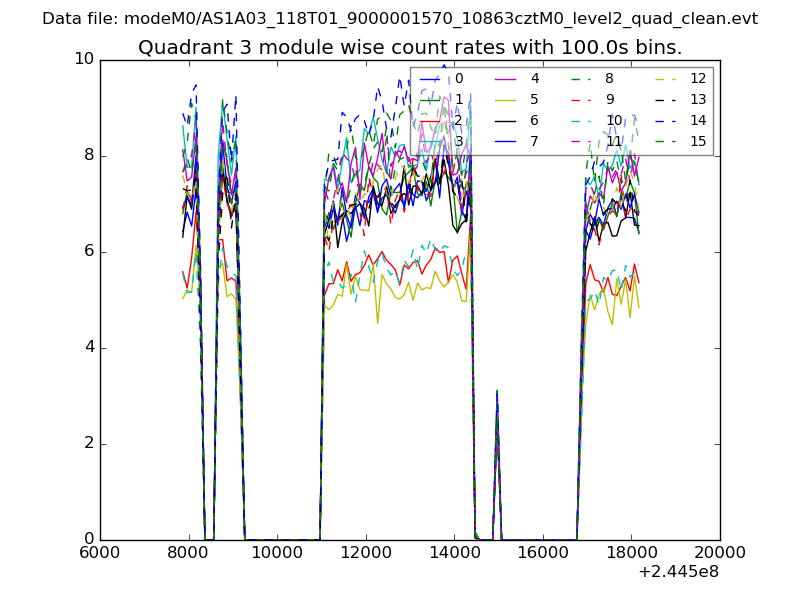
| Module-wise count rates for Quadrant C Data is divided into 100 sec bins |
 |
 |
| Module-wise count rates for Quadrant D Data is divided into 100 sec bins |
 |
 |
| Parameter | Plot |
|---|---|
| CZT HV Monitor | 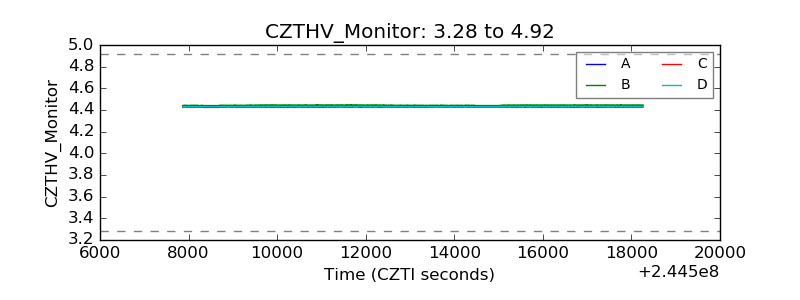 |
| D_VDD | 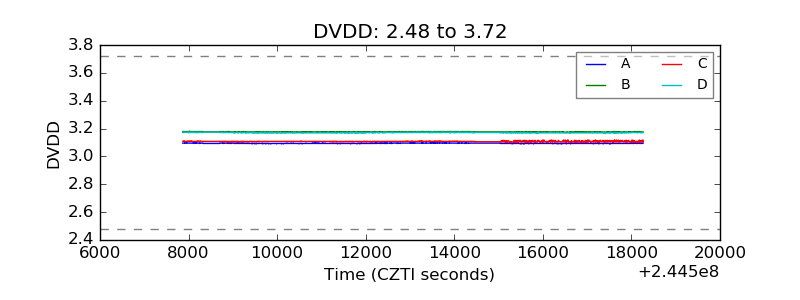 |
| Temperature 1 | 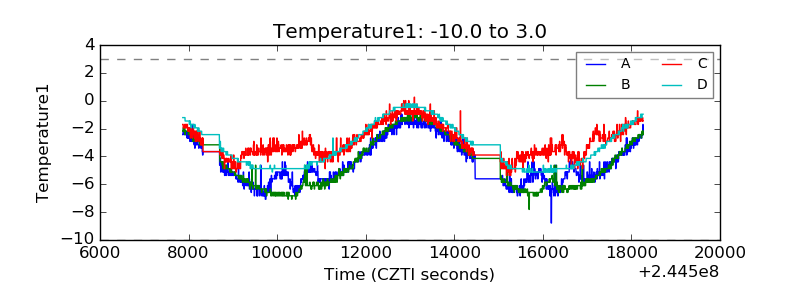 |
| Veto HV Monitor | 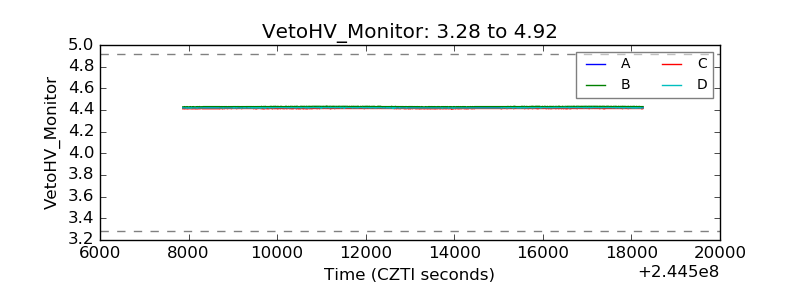 |
| Veto LLD | 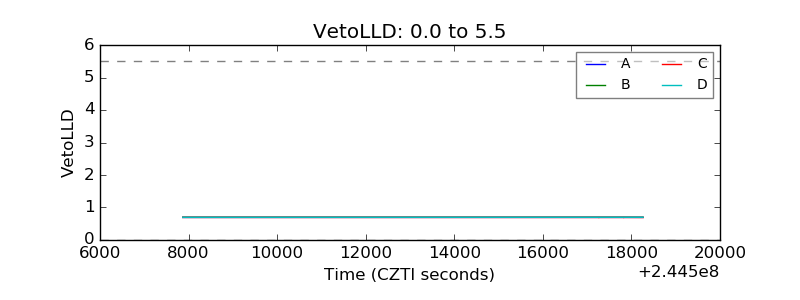 |
| Alpha Counter | 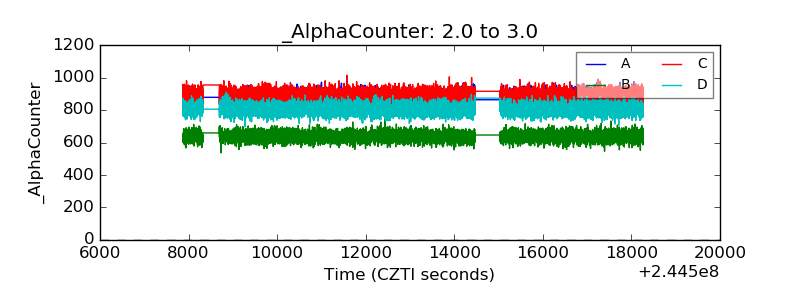 |
| _CPM_Rate | 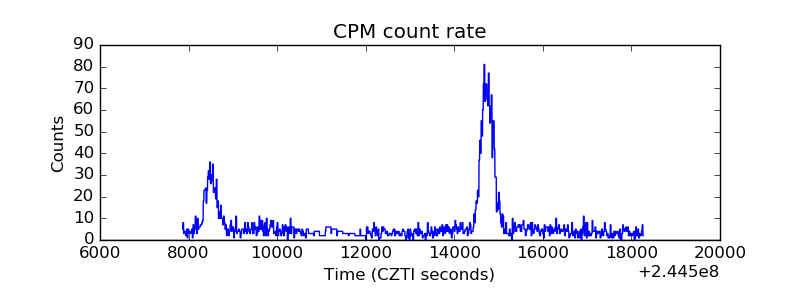 |
| CZT Counter | 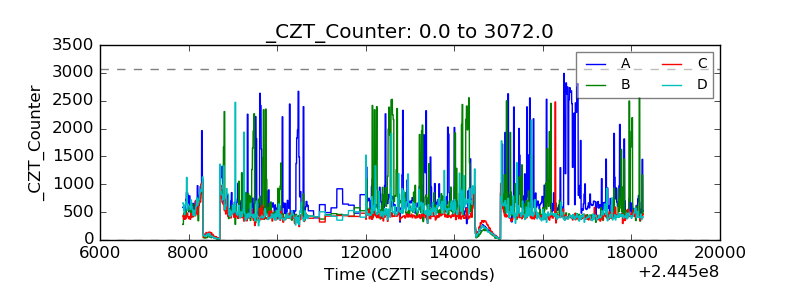 |
| +2.5 Volts monitor | 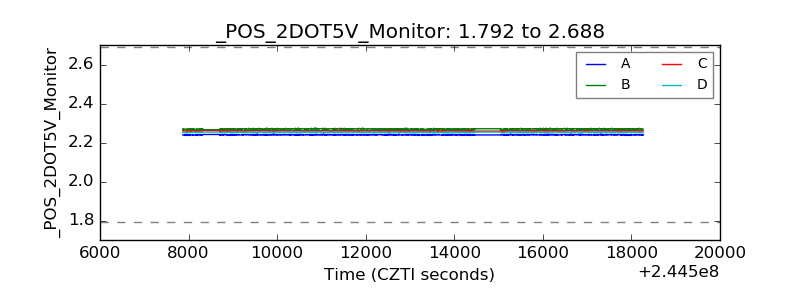 |
| +5 Volts monitor | 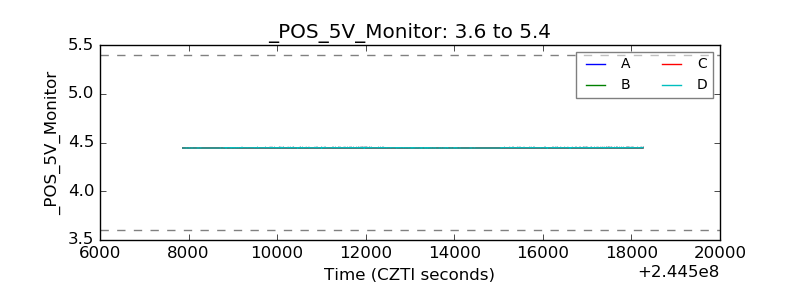 |
| _ROLL_ROT | 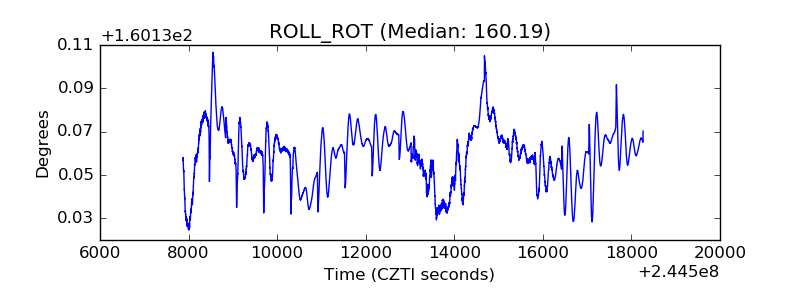 |
| _Roll_DEC | 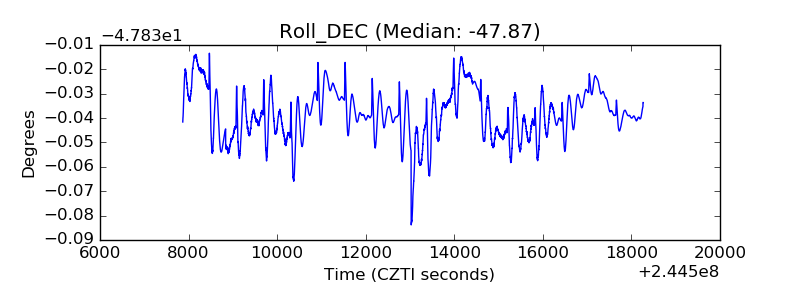 |
| _Roll_RA | 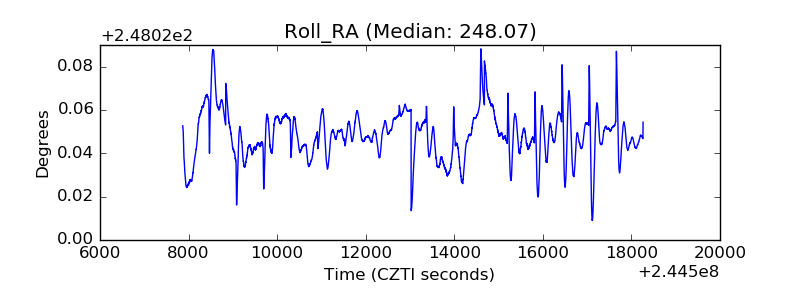 |
| Veto Counter |  |