| Param | Original file | Final file |
|---|---|---|
| Filename | modeM0/AS1A03_118T01_9000001570_10865cztM0_level2.evt | modeM0/AS1A03_118T01_9000001570_10865cztM0_level2_quad_clean.evt |
| Size (bytes) | 588,677,760 | 89,409,600 |
| Size | 561.4 MB | 85.3 MB |
| Events in quadrant A | 6,383,574 | 524,817 |
| Events in quadrant B | 4,993,086 | 576,139 |
| Events in quadrant C | 2,811,707 | 602,833 |
| Events in quadrant D | 3,220,405 | 571,069 |
| Mode M9 | |||
|---|---|---|---|
| Quadrant | BADHDUFLAG | Total packets | Discarded packets |
| A | 0 | 10 | 0 |
| B | 0 | 10 | 0 |
| C | 0 | 10 | 0 |
| D | 0 | 10 | 0 |
| Mode SS | |||
|---|---|---|---|
| Quadrant | BADHDUFLAG | Total packets | Discarded packets |
| A | 0 | 126 | 0 |
| B | 0 | 126 | 0 |
| C | 0 | 126 | 0 |
| D | 0 | 126 | 0 |
| Mode M0 | |||
|---|---|---|---|
| Quadrant | BADHDUFLAG | Total packets | Discarded packets |
| A | 0 | 23413 | 2 |
| B | 0 | 18888 | 1 |
| C | 0 | 12610 | 1 |
| D | 0 | 13697 | 1 |
| Quadrant | Total seconds | Saturated seconds | Saturation percentage |
|---|---|---|---|
| A | 6190 | 1044 | 16.865913% |
| B | 6190 | 593 | 9.579968% |
| C | 6190 | 28 | 0.452342% |
| D | 6190 | 74 | 1.195477% |
Noise dominated data is calculated using 1-second bins in cleaned event files. If a bin has >2000 counts, and if more than 50% of those come from <1% of pixels, then it is considered to be noise-dominated and hence unusable.
| Quadrant | # 1 sec bins | Bins with >0 counts | Bins with >2000 counts | High rate bins dominated by noise | Noise dominated (total time) | Noise dominated (detector-on time) | Marked lightcurve |
|---|---|---|---|---|---|---|---|
| A | 7190 | 6191 | 791 | 791 | 11.00% | 12.78% | 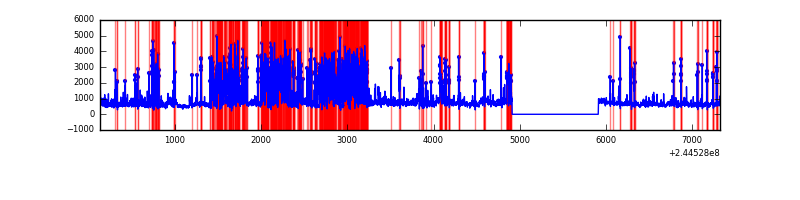 |
| B | 7190 | 6190 | 401 | 401 | 5.58% | 6.48% | 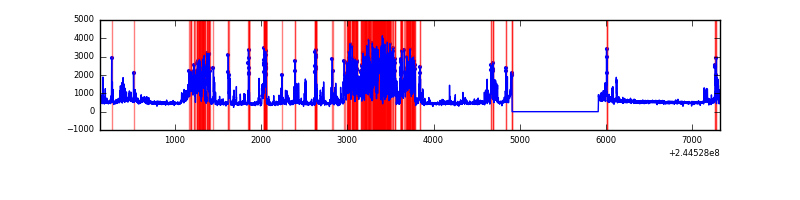 |
| C | 7190 | 6191 | 0 | 0 | 0.00% | 0.00% |  |
| D | 7190 | 6191 | 32 | 32 | 0.45% | 0.52% | 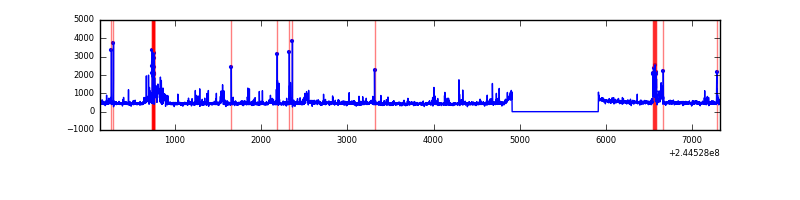 |
Top three noisy pixels from each quadrant. If the there are fewer than three noisy pixels in the level2.evt file, extra rows are filled as -1
| Pixel properties | Quadrant properties | ||||||
|---|---|---|---|---|---|---|---|
| Quadrant | DetID | PixID | Counts | Sigma | Mean | Median | Sigma |
| A | 8 | 5 | 3608574 | 26410.68 | 676 | 663 | 136.6 |
| A | 15 | 223 | 96130 | 698.84 | 676 | 663 | 136.6 |
| A | 15 | 239 | 37211 | 267.54 | 676 | 663 | 136.6 |
| B | 4 | 239 | 2139569 | 15702.91 | 712 | 696 | 136.2 |
| B | 0 | 214 | 28335 | 202.92 | 712 | 696 | 136.2 |
| B | 0 | 187 | 17795 | 125.54 | 712 | 696 | 136.2 |
| C | 8 | 208 | 5932 | 31.5 | 718 | 720 | 165.5 |
| C | 13 | 61 | 5348 | 27.97 | 718 | 720 | 165.5 |
| C | 14 | 234 | 4383 | 22.14 | 718 | 720 | 165.5 |
| D | 1 | 52 | 193876 | 1110.01 | 715 | 696 | 174.0 |
| D | 13 | 105 | 69387 | 394.7 | 715 | 696 | 174.0 |
| D | 13 | 104 | 37700 | 212.62 | 715 | 696 | 174.0 |
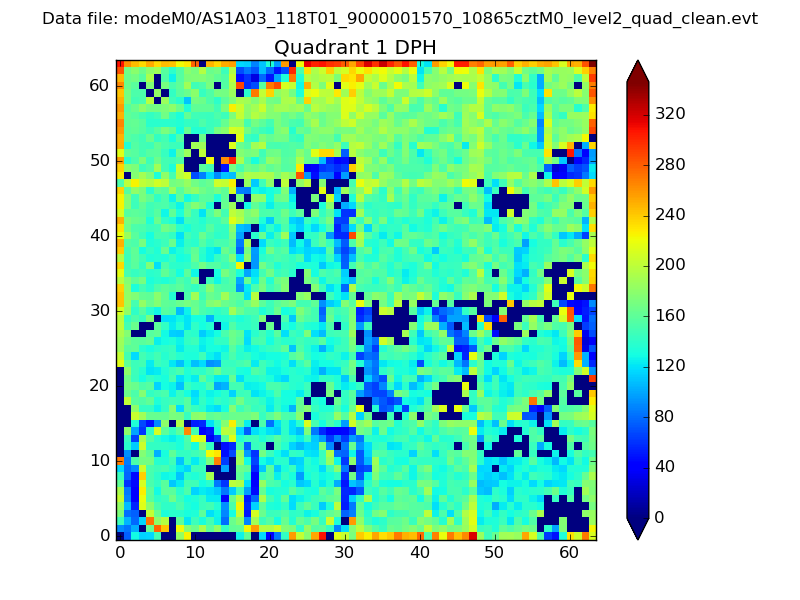
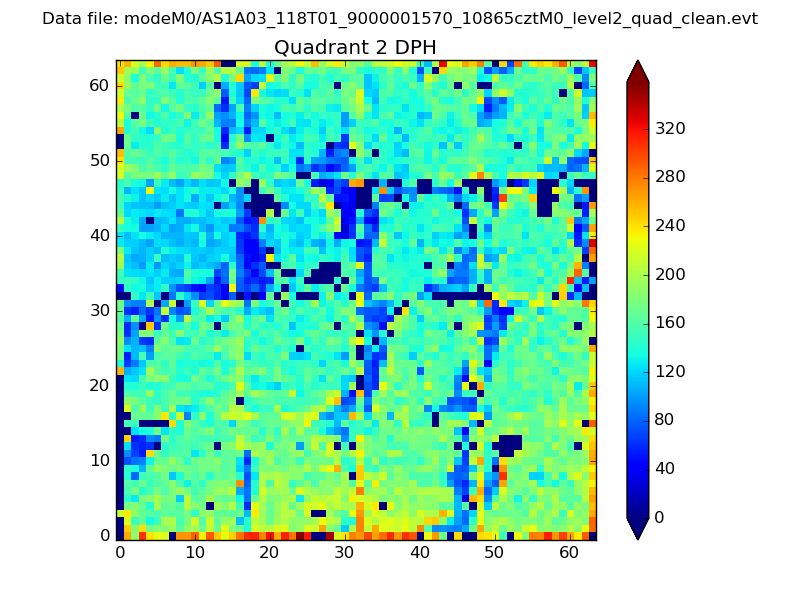
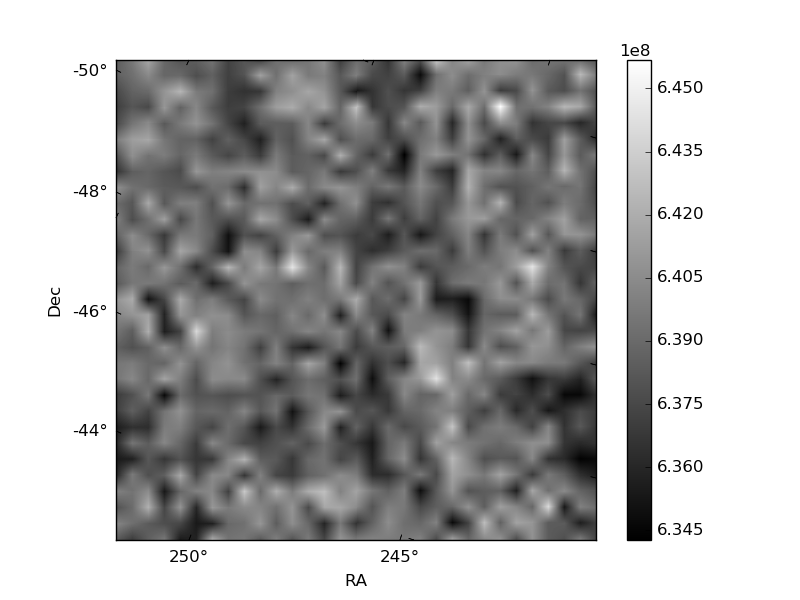
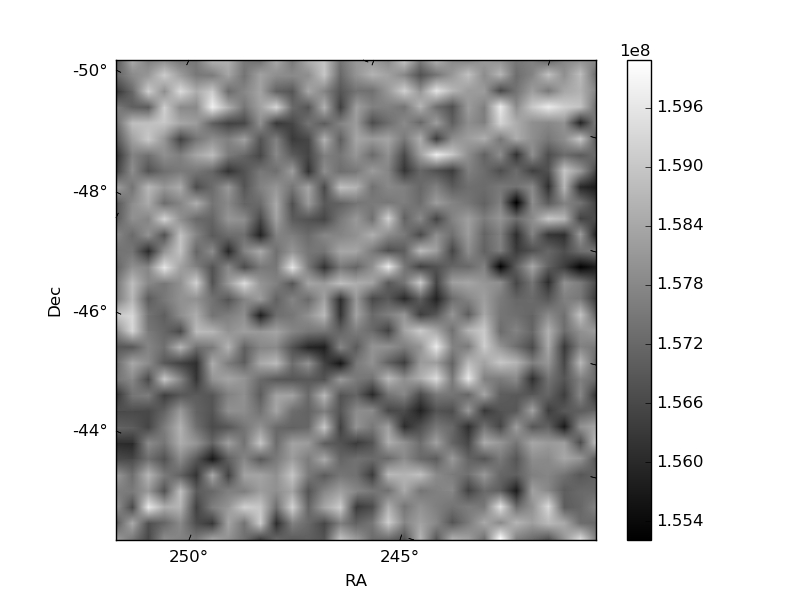
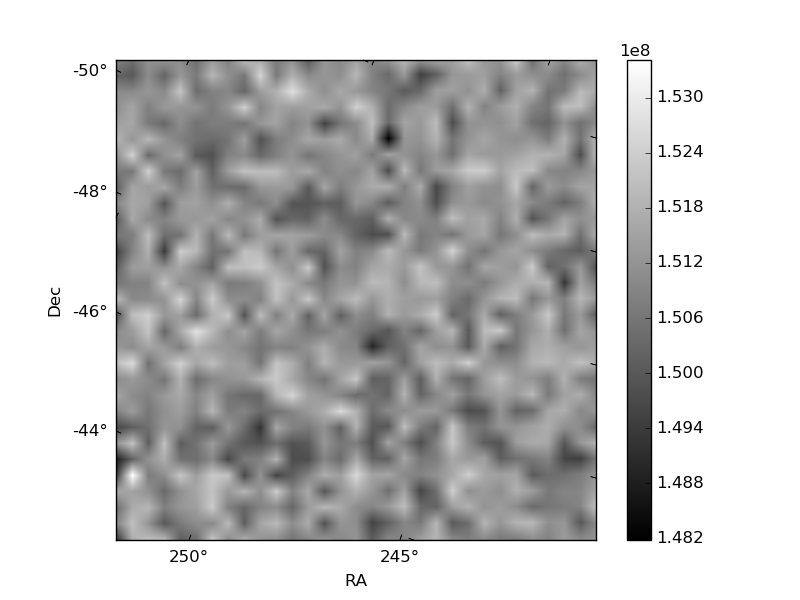
Histogram calculated using DETX and DETY for each event in the final _common_clean file
| Quadrant A | 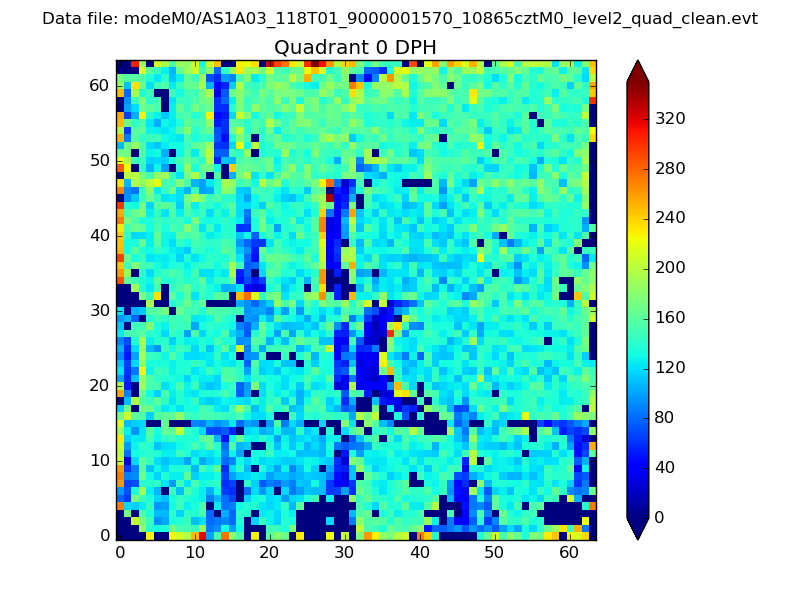 |
 |
Quadrant B |
|---|---|---|---|
| Quadrant D | 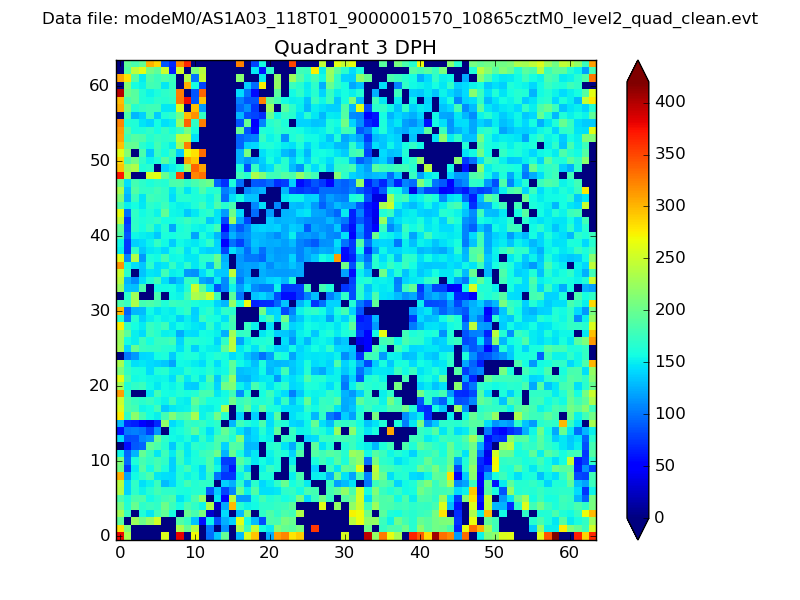 |
 |
Quadrant C |
| Plot type | Count rate plots | Images |
|---|---|---|
| Comparison with Poisson distribution Blue bars denote a histogram of data divided into 1 sec bins. Red curve is a Poisson curve with rate = median count rate of data. |
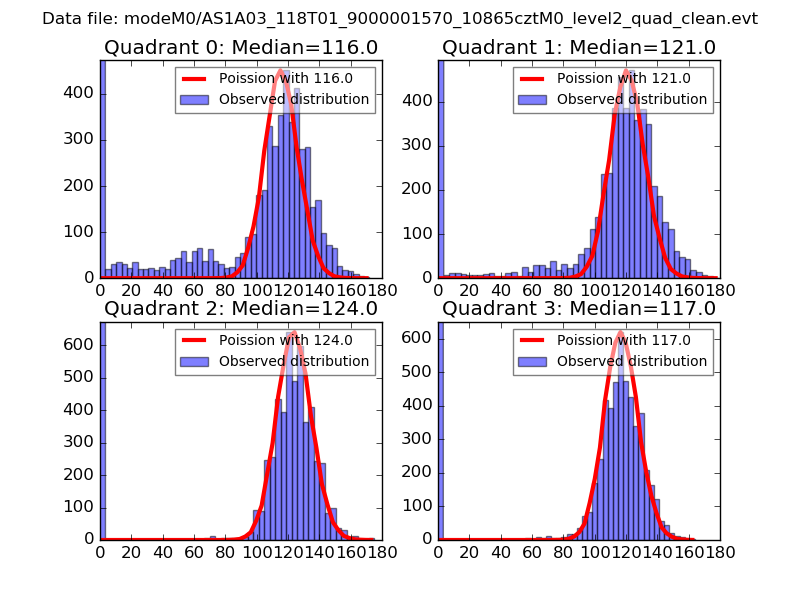 |
 |
| Quadrant-wise count rates Data is divided into 100 sec bins |
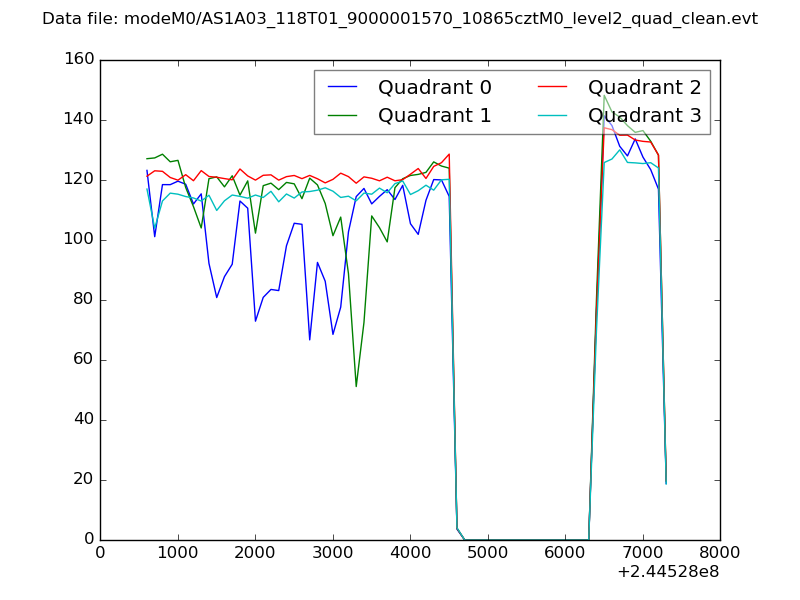 |
|
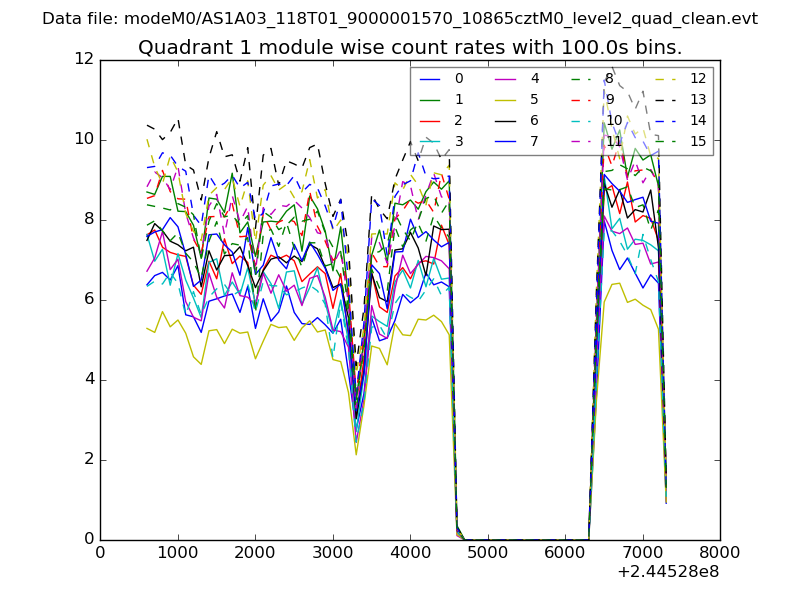
| Module-wise count rates for Quadrant A Data is divided into 100 sec bins |
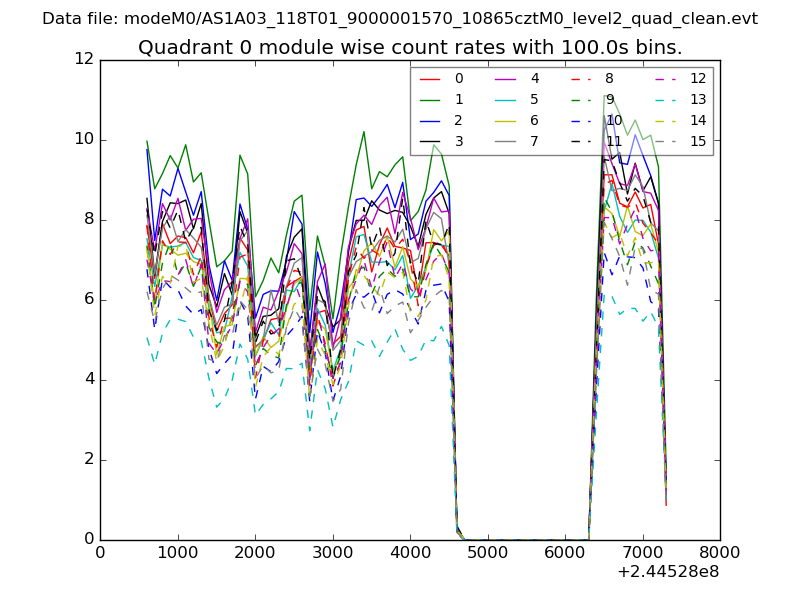 |
 |
| Module-wise count rates for Quadrant B Data is divided into 100 sec bins |
 |
 |
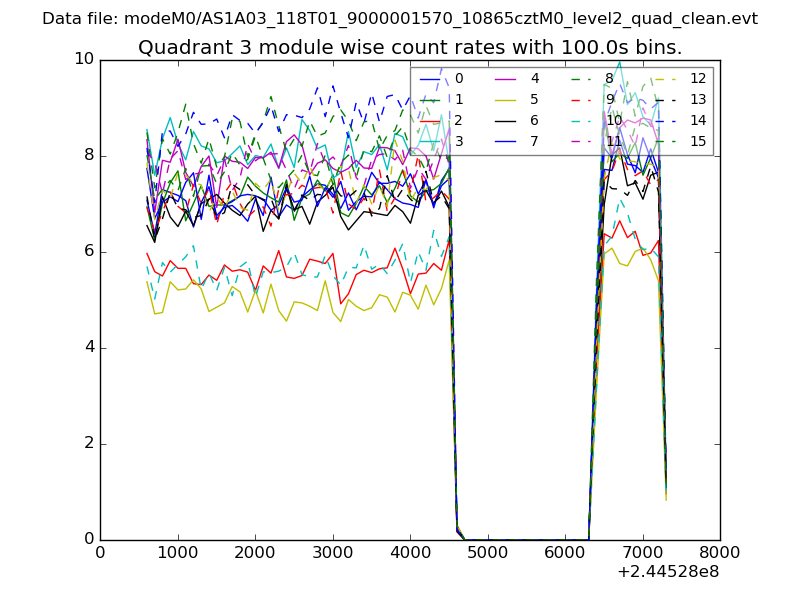
| Module-wise count rates for Quadrant C Data is divided into 100 sec bins |
 |
 |
| Module-wise count rates for Quadrant D Data is divided into 100 sec bins |
 |
 |
| Parameter | Plot |
|---|---|
| CZT HV Monitor | 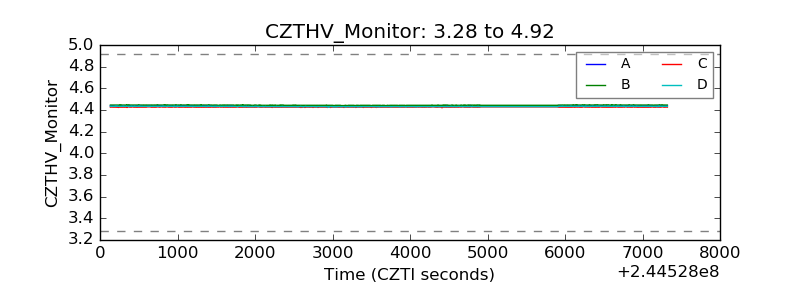 |
| D_VDD | 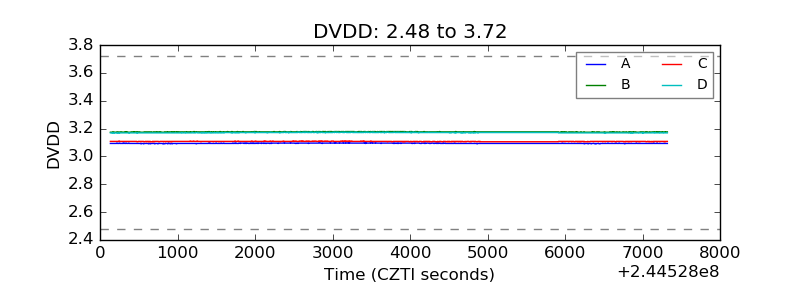 |
| Temperature 1 | 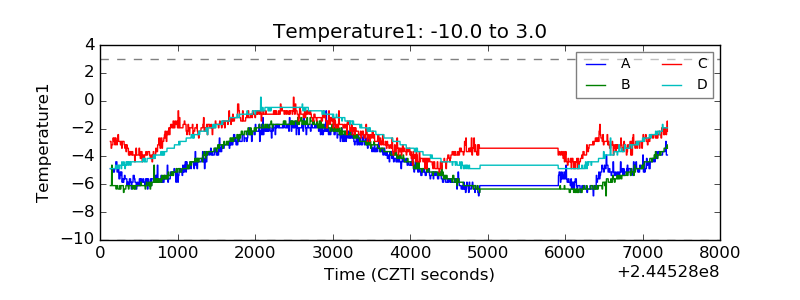 |
| Veto HV Monitor | 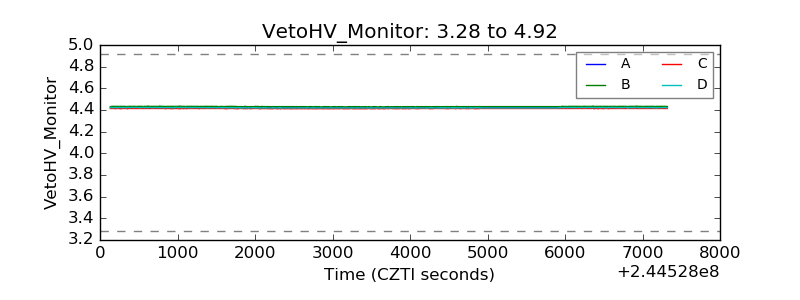 |
| Veto LLD | 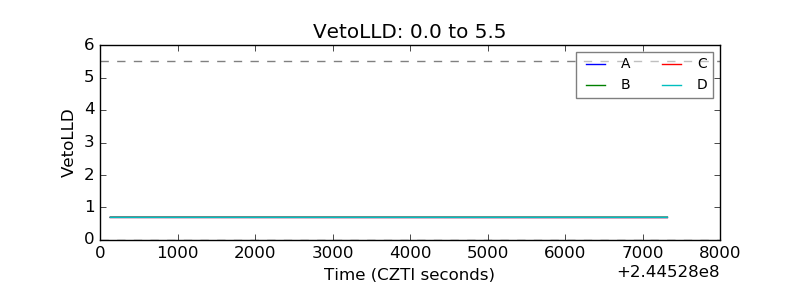 |
| Alpha Counter | 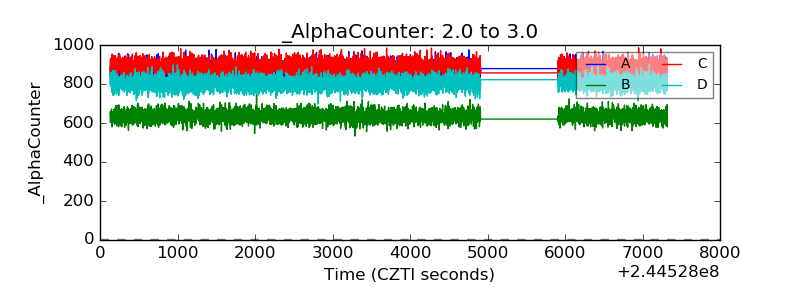 |
| _CPM_Rate | 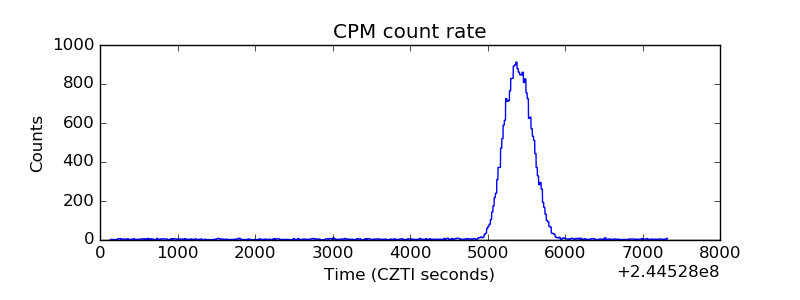 |
| CZT Counter | 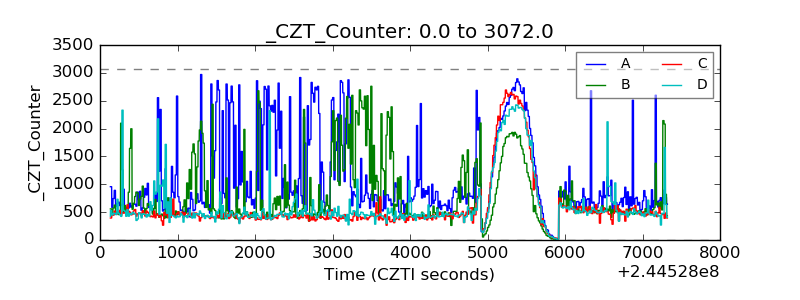 |
| +2.5 Volts monitor |  |
| +5 Volts monitor | 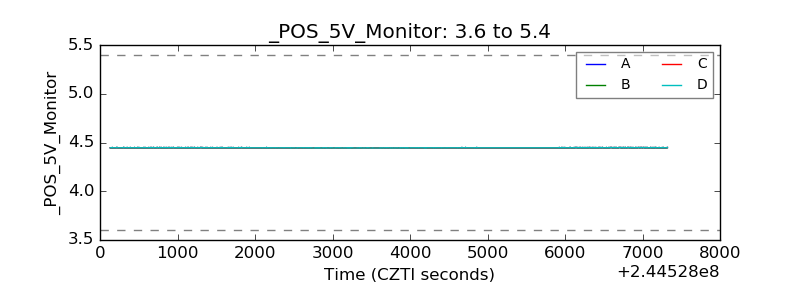 |
| _ROLL_ROT | 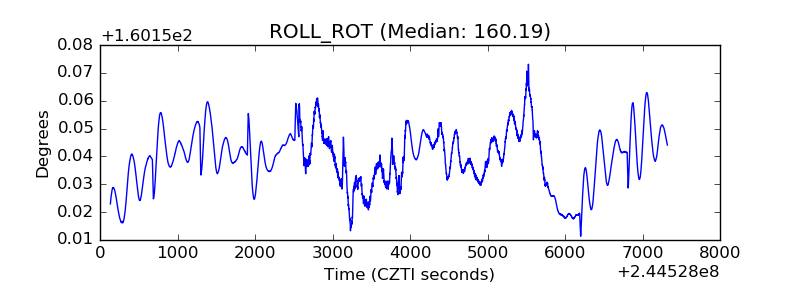 |
| _Roll_DEC | 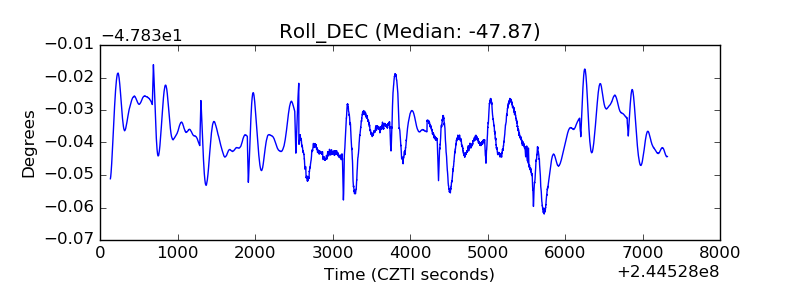 |
| _Roll_RA | 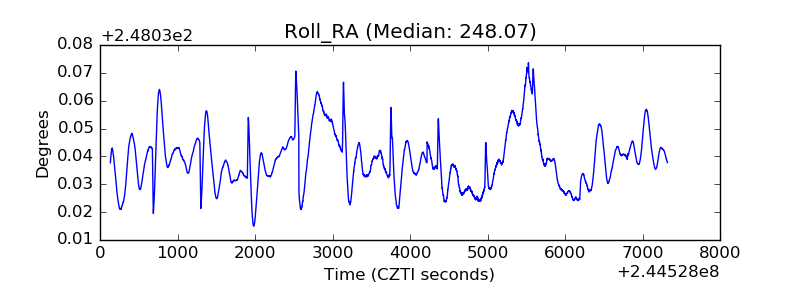 |
| Veto Counter | 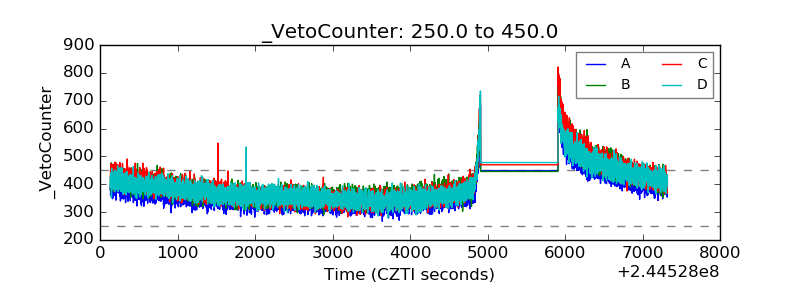 |