| Param | Original file | Final file |
|---|---|---|
| Filename | modeM0/AS1A03_118T01_9000001570_10867cztM0_level2.evt | modeM0/AS1A03_118T01_9000001570_10867cztM0_level2_quad_clean.evt |
| Size (bytes) | 549,489,600 | 103,112,640 |
| Size | 524.0 MB | 98.3 MB |
| Events in quadrant A | 5,240,943 | 651,414 |
| Events in quadrant B | 4,376,847 | 678,033 |
| Events in quadrant C | 3,092,952 | 690,132 |
| Events in quadrant D | 3,488,130 | 648,002 |
| Mode M9 | |||
|---|---|---|---|
| Quadrant | BADHDUFLAG | Total packets | Discarded packets |
| A | 0 | 13 | 0 |
| B | 0 | 13 | 0 |
| C | 0 | 13 | 0 |
| D | 0 | 14 | 0 |
| Mode SS | |||
|---|---|---|---|
| Quadrant | BADHDUFLAG | Total packets | Discarded packets |
| A | 0 | 132 | 0 |
| B | 0 | 132 | 0 |
| C | 0 | 132 | 0 |
| D | 0 | 132 | 0 |
| Mode M0 | |||
|---|---|---|---|
| Quadrant | BADHDUFLAG | Total packets | Discarded packets |
| A | 0 | 20259 | 3 |
| B | 0 | 17267 | 2 |
| C | 0 | 13571 | 2 |
| D | 0 | 14738 | 2 |
| Quadrant | Total seconds | Saturated seconds | Saturation percentage |
|---|---|---|---|
| A | 6524 | 532 | 8.154506% |
| B | 6524 | 384 | 5.885960% |
| C | 6524 | 49 | 0.751073% |
| D | 6524 | 180 | 2.759044% |
Noise dominated data is calculated using 1-second bins in cleaned event files. If a bin has >2000 counts, and if more than 50% of those come from <1% of pixels, then it is considered to be noise-dominated and hence unusable.
| Quadrant | # 1 sec bins | Bins with >0 counts | Bins with >2000 counts | High rate bins dominated by noise | Noise dominated (total time) | Noise dominated (detector-on time) | Marked lightcurve |
|---|---|---|---|---|---|---|---|
| A | 7614 | 6524 | 301 | 301 | 3.95% | 4.61% | 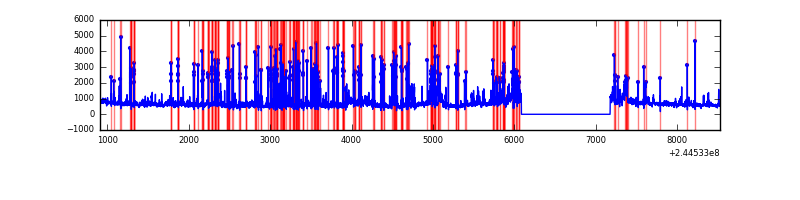 |
| B | 7614 | 6525 | 237 | 237 | 3.11% | 3.63% | 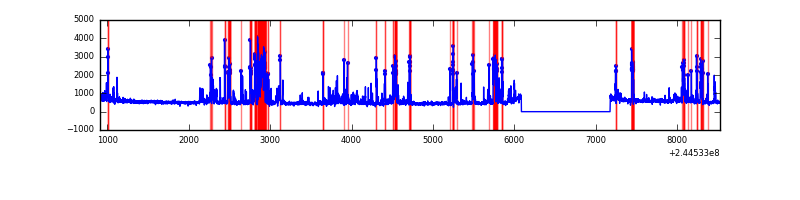 |
| C | 7614 | 6524 | 0 | 0 | 0.00% | 0.00% | 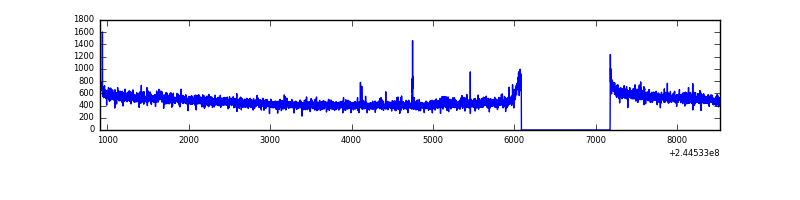 |
| D | 7614 | 6524 | 47 | 47 | 0.62% | 0.72% | 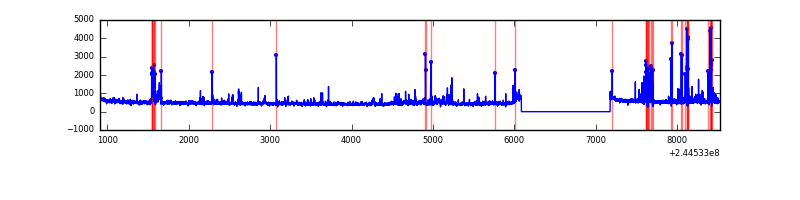 |
Top three noisy pixels from each quadrant. If the there are fewer than three noisy pixels in the level2.evt file, extra rows are filled as -1
| Pixel properties | Quadrant properties | ||||||
|---|---|---|---|---|---|---|---|
| Quadrant | DetID | PixID | Counts | Sigma | Mean | Median | Sigma |
| A | 8 | 5 | 2115146 | 13331.43 | 780 | 765 | 158.6 |
| A | 15 | 223 | 57837 | 359.85 | 780 | 765 | 158.6 |
| A | 15 | 239 | 26889 | 164.72 | 780 | 765 | 158.6 |
| B | 4 | 239 | 1223017 | 8165.38 | 790 | 773 | 149.7 |
| B | 0 | 214 | 23334 | 150.72 | 790 | 773 | 149.7 |
| B | 15 | 204 | 17412 | 111.16 | 790 | 773 | 149.7 |
| C | 8 | 208 | 16398 | 86.61 | 785 | 789 | 180.2 |
| C | 14 | 234 | 7885 | 39.37 | 785 | 789 | 180.2 |
| C | 13 | 61 | 5602 | 26.71 | 785 | 789 | 180.2 |
| D | 1 | 52 | 163955 | 867.44 | 780 | 760 | 188.1 |
| D | 13 | 105 | 69606 | 365.94 | 780 | 760 | 188.1 |
| D | 2 | 14 | 61539 | 323.06 | 780 | 760 | 188.1 |
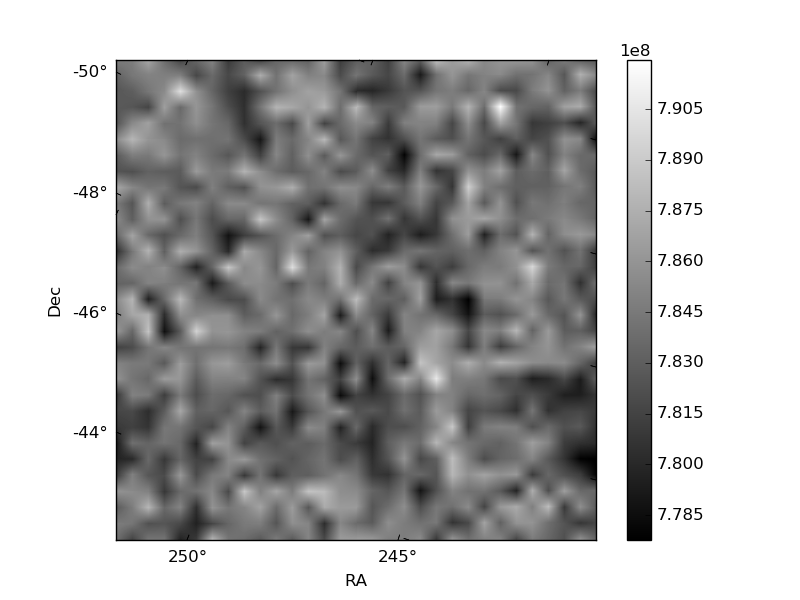
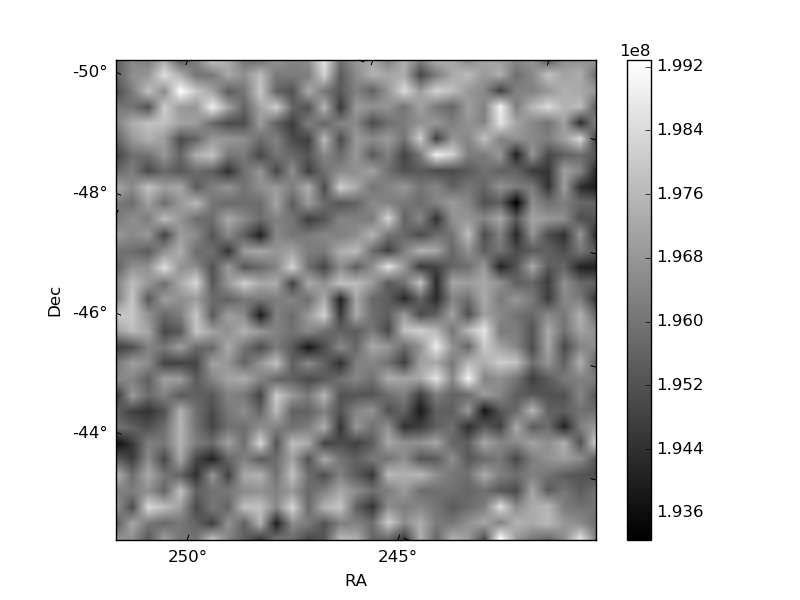
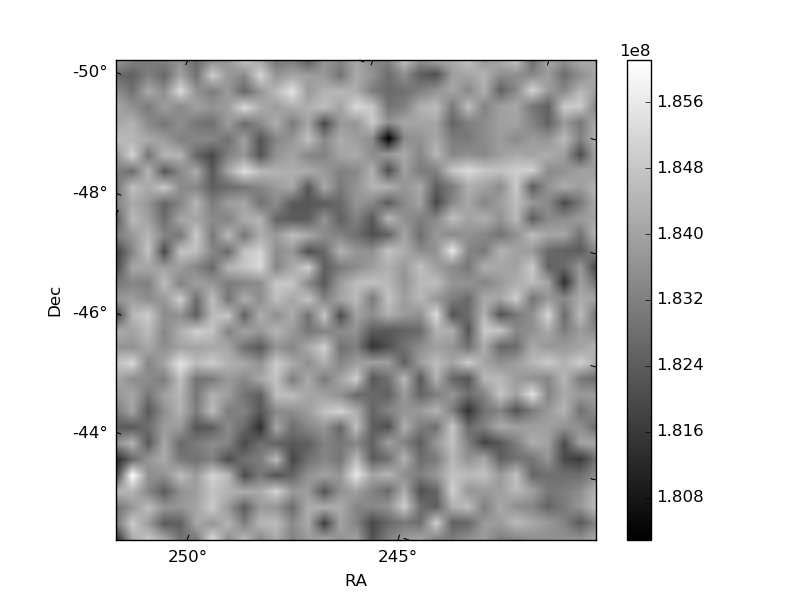
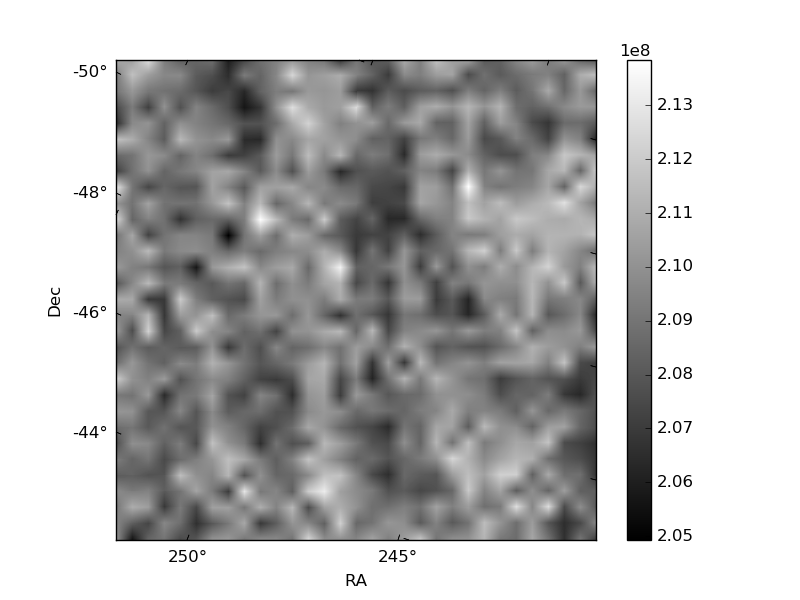
Histogram calculated using DETX and DETY for each event in the final _common_clean file
| Quadrant A | 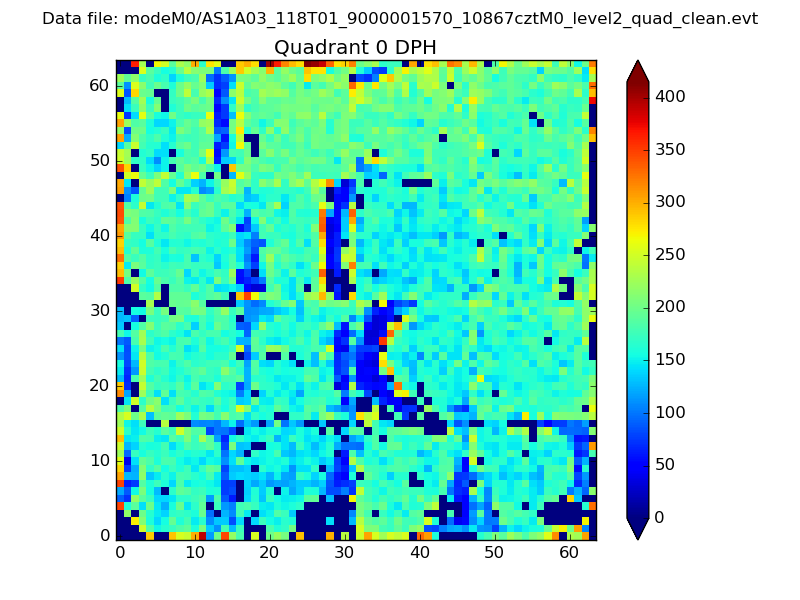 |
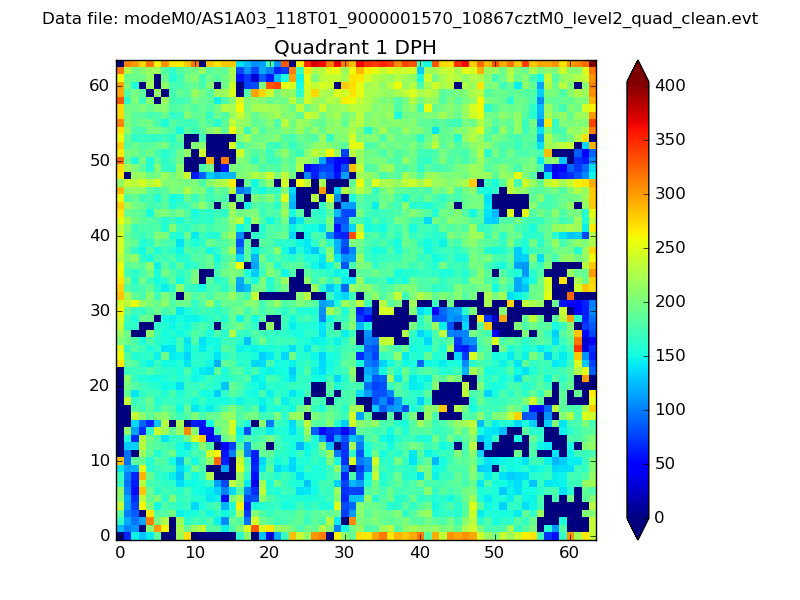 |
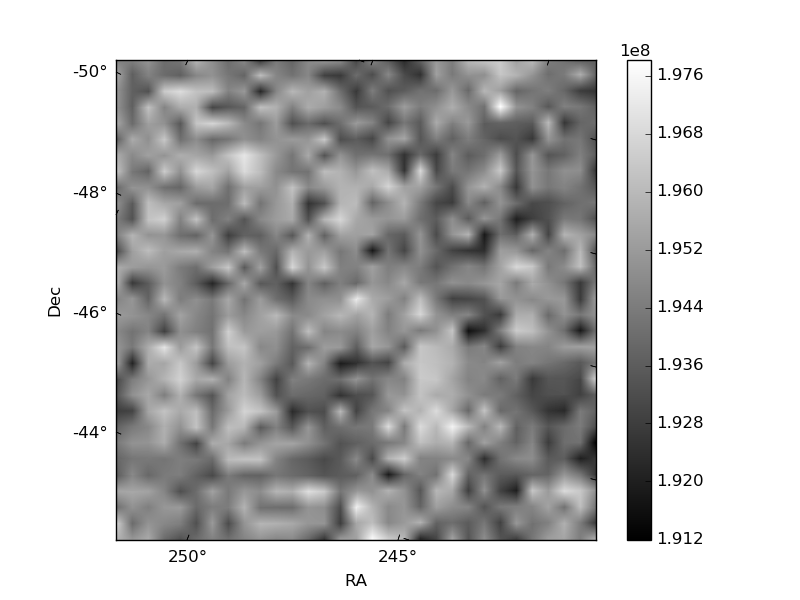
Quadrant B |
|---|---|---|---|
| Quadrant D | 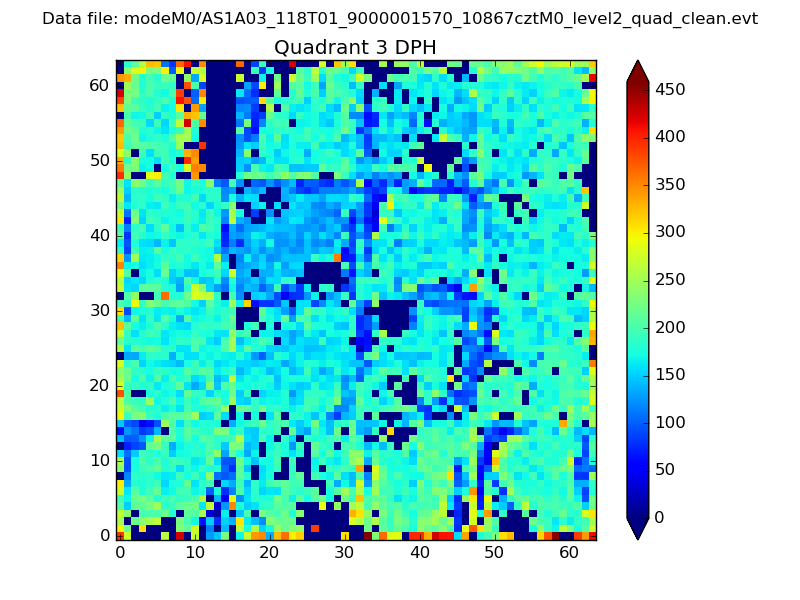 |
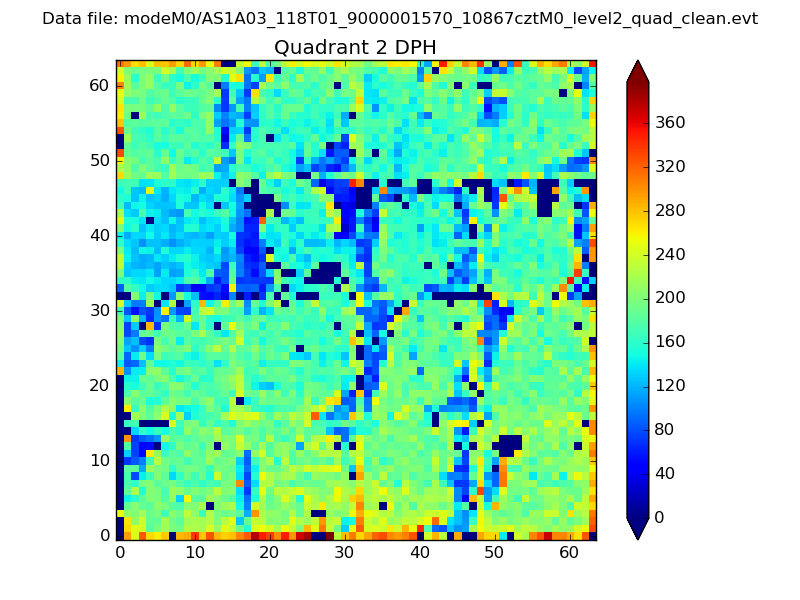 |
Quadrant C |
| Plot type | Count rate plots | Images |
|---|---|---|
| Comparison with Poisson distribution Blue bars denote a histogram of data divided into 1 sec bins. Red curve is a Poisson curve with rate = median count rate of data. |
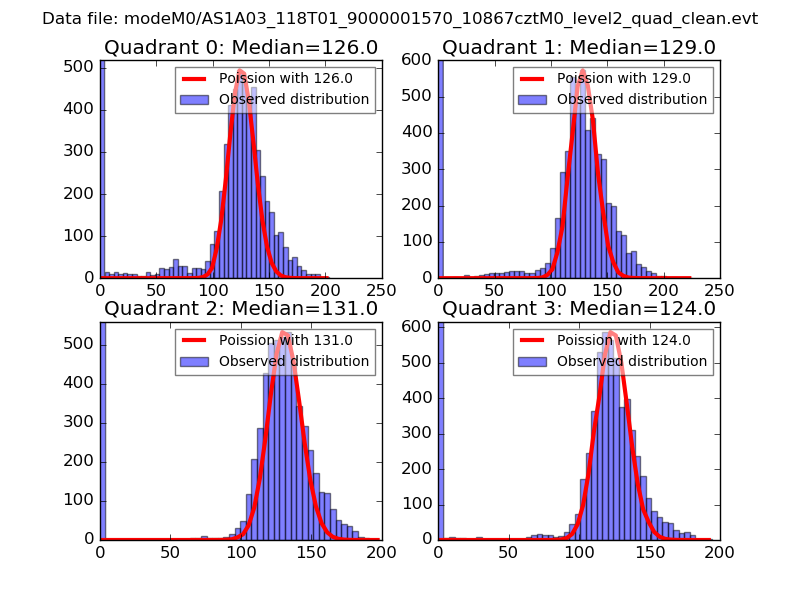 |
 |
| Quadrant-wise count rates Data is divided into 100 sec bins |
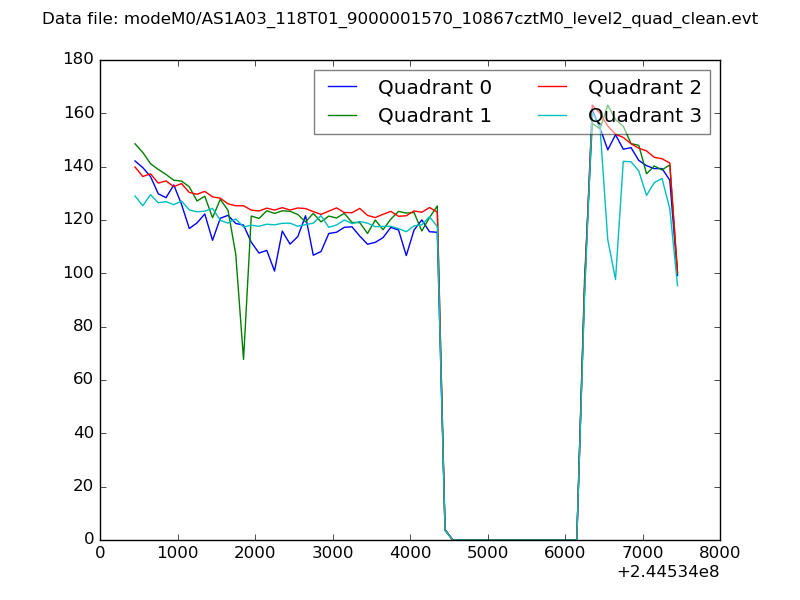 |
|
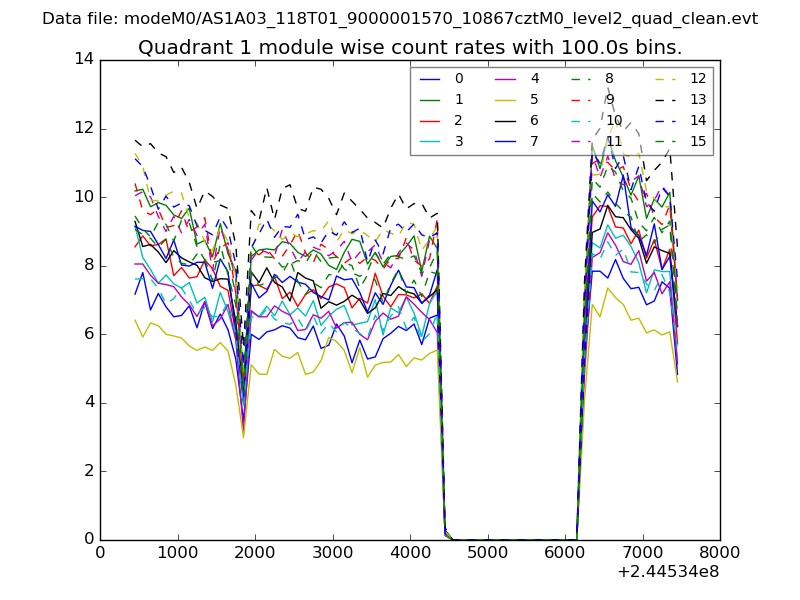
| Module-wise count rates for Quadrant A Data is divided into 100 sec bins |
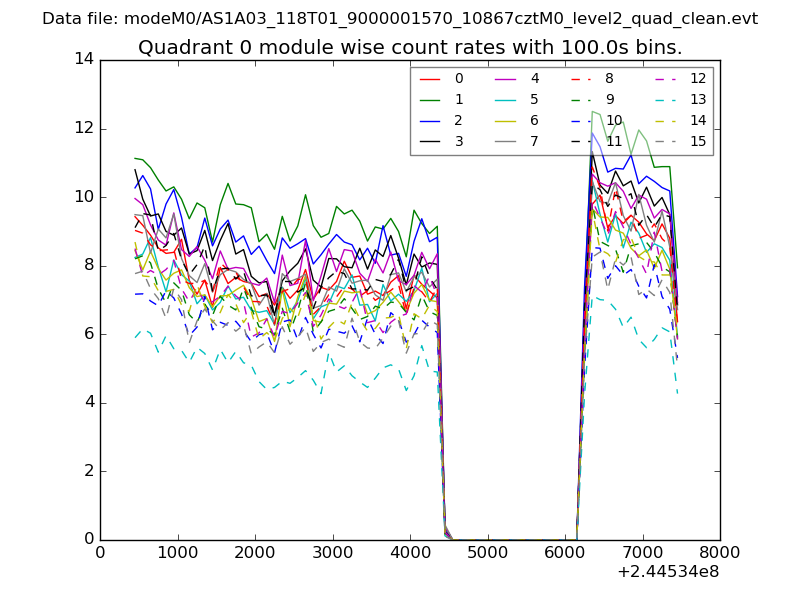 |
 |
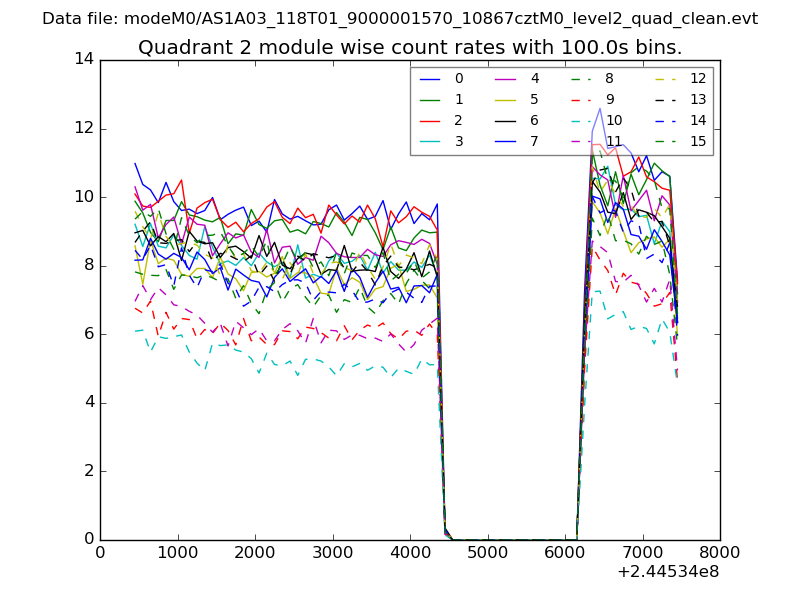
| Module-wise count rates for Quadrant B Data is divided into 100 sec bins |
 |
 |
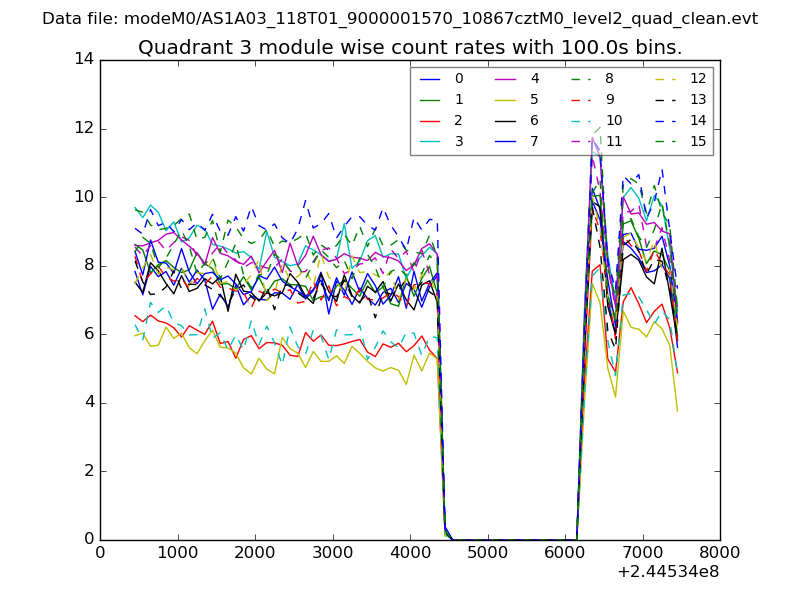
| Module-wise count rates for Quadrant C Data is divided into 100 sec bins |
 |
 |
| Module-wise count rates for Quadrant D Data is divided into 100 sec bins |
 |
 |
| Parameter | Plot |
|---|---|
| CZT HV Monitor | 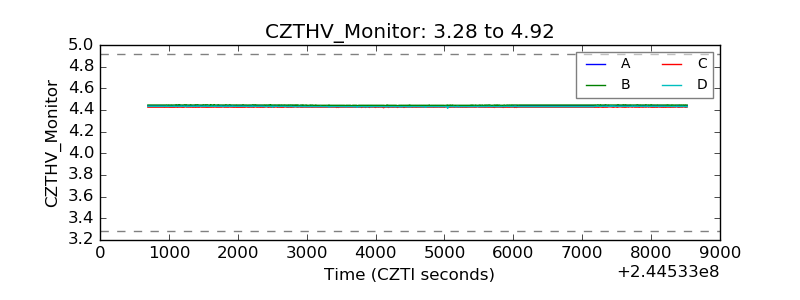 |
| D_VDD | 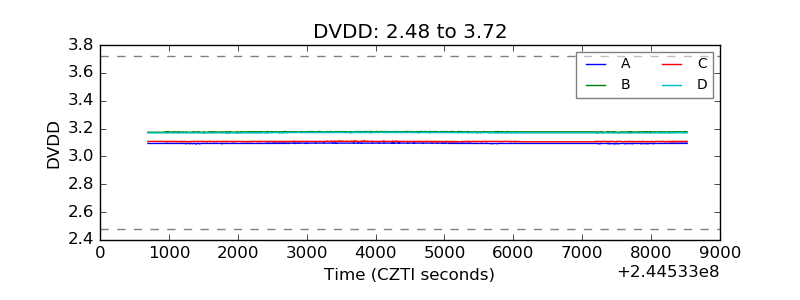 |
| Temperature 1 | 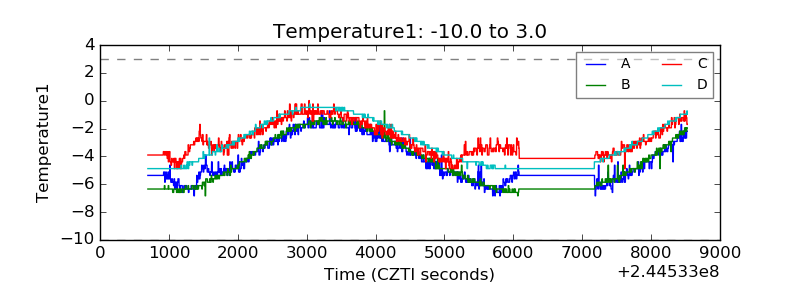 |
| Veto HV Monitor | 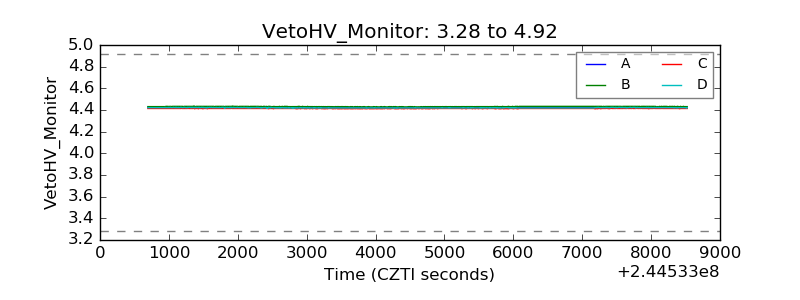 |
| Veto LLD | 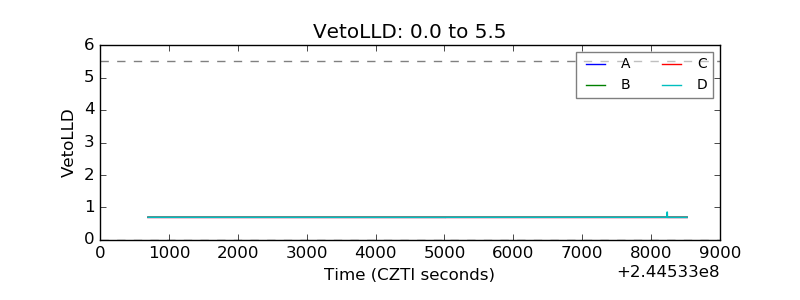 |
| Alpha Counter | 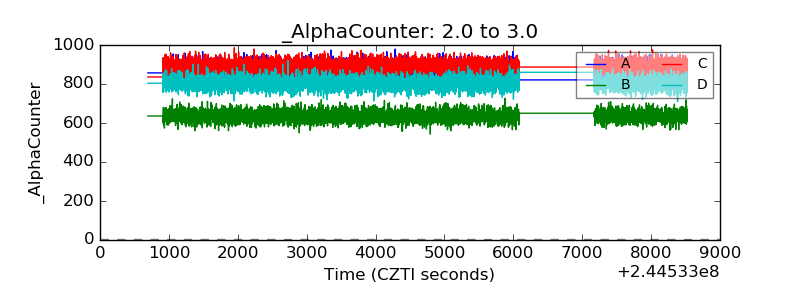 |
| _CPM_Rate | 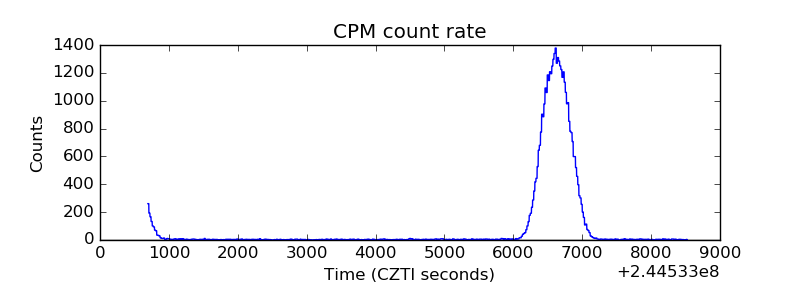 |
| CZT Counter | 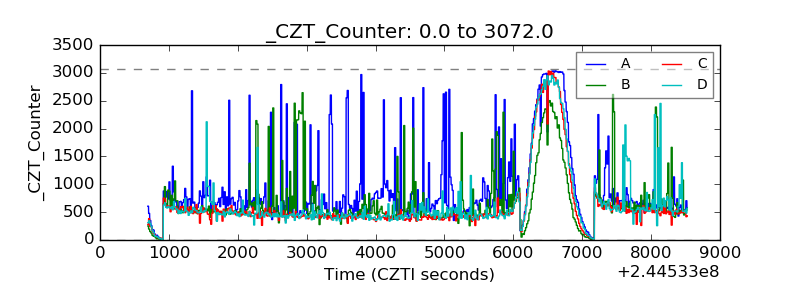 |
| +2.5 Volts monitor |  |
| +5 Volts monitor |  |
| _ROLL_ROT | 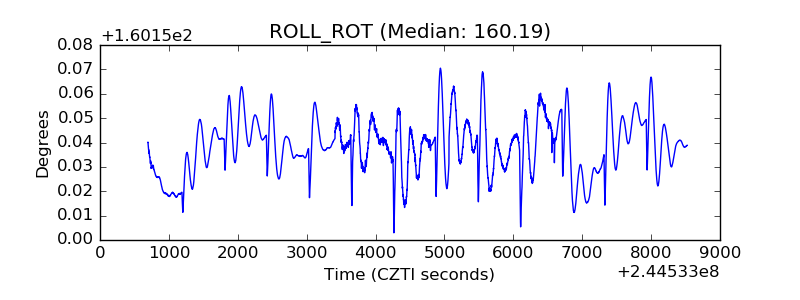 |
| _Roll_DEC | 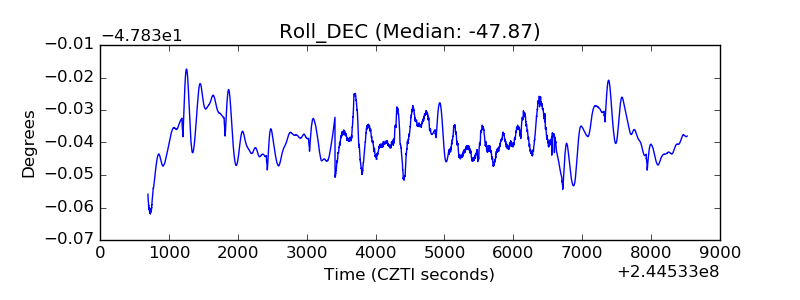 |
| _Roll_RA | 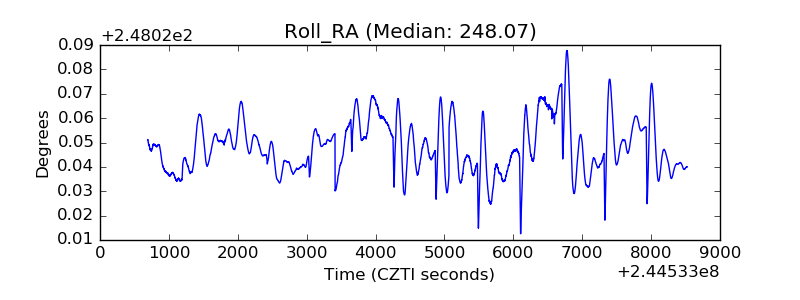 |
| Veto Counter | 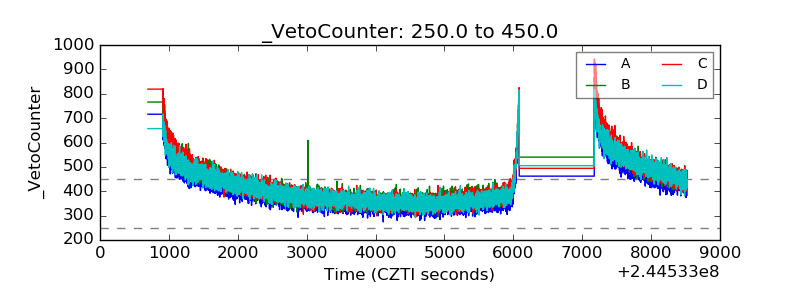 |