| Param | Original file | Final file |
|---|---|---|
| Filename | modeM0/AS1A03_118T01_9000001570_10868cztM0_level2.evt | modeM0/AS1A03_118T01_9000001570_10868cztM0_level2_quad_clean.evt |
| Size (bytes) | 516,735,360 | 105,261,120 |
| Size | 492.8 MB | 100.4 MB |
| Events in quadrant A | 4,544,628 | 688,544 |
| Events in quadrant B | 4,056,825 | 706,511 |
| Events in quadrant C | 2,874,190 | 711,392 |
| Events in quadrant D | 3,761,990 | 657,348 |
| Mode M9 | |||
|---|---|---|---|
| Quadrant | BADHDUFLAG | Total packets | Discarded packets |
| A | 0 | 12 | 0 |
| B | 0 | 12 | 0 |
| C | 0 | 12 | 0 |
| D | 0 | 12 | 0 |
| Mode SS | |||
|---|---|---|---|
| Quadrant | BADHDUFLAG | Total packets | Discarded packets |
| A | 0 | 122 | 0 |
| B | 0 | 122 | 0 |
| C | 0 | 122 | 0 |
| D | 0 | 122 | 0 |
| Mode M0 | |||
|---|---|---|---|
| Quadrant | BADHDUFLAG | Total packets | Discarded packets |
| A | 0 | 17655 | 2 |
| B | 0 | 16051 | 1 |
| C | 0 | 12614 | 1 |
| D | 0 | 15238 | 1 |
| Quadrant | Total seconds | Saturated seconds | Saturation percentage |
|---|---|---|---|
| A | 6075 | 382 | 6.288066% |
| B | 6075 | 260 | 4.279835% |
| C | 6075 | 49 | 0.806584% |
| D | 6075 | 326 | 5.366255% |
Noise dominated data is calculated using 1-second bins in cleaned event files. If a bin has >2000 counts, and if more than 50% of those come from <1% of pixels, then it is considered to be noise-dominated and hence unusable.
| Quadrant | # 1 sec bins | Bins with >0 counts | Bins with >2000 counts | High rate bins dominated by noise | Noise dominated (total time) | Noise dominated (detector-on time) | Marked lightcurve |
|---|---|---|---|---|---|---|---|
| A | 7260 | 6075 | 196 | 196 | 2.70% | 3.23% | 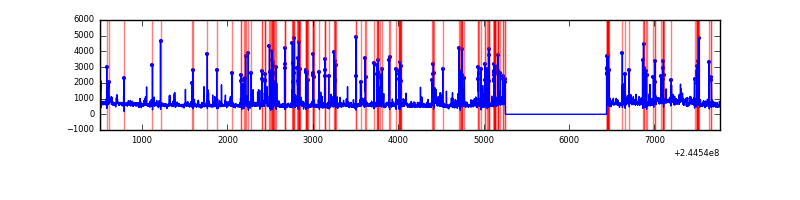 |
| B | 7260 | 6075 | 127 | 127 | 1.75% | 2.09% | 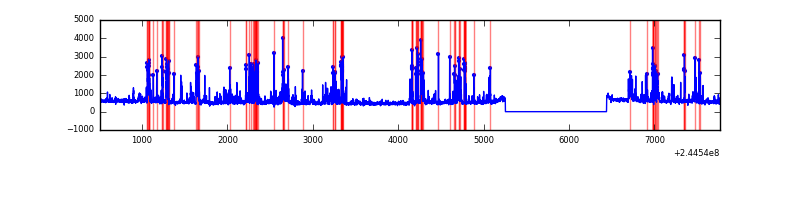 |
| C | 7260 | 6076 | 1 | 1 | 0.01% | 0.02% | 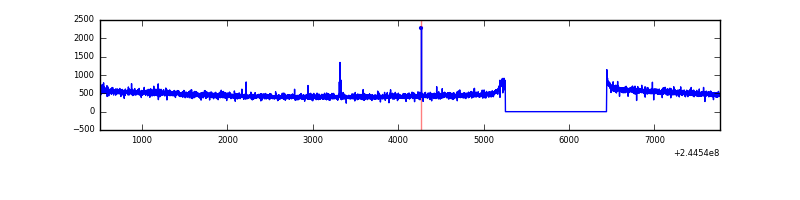 |
| D | 7260 | 6076 | 129 | 129 | 1.78% | 2.12% | 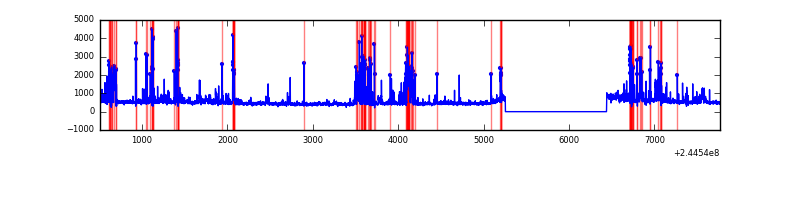 |
Top three noisy pixels from each quadrant. If the there are fewer than three noisy pixels in the level2.evt file, extra rows are filled as -1
| Pixel properties | Quadrant properties | ||||||
|---|---|---|---|---|---|---|---|
| Quadrant | DetID | PixID | Counts | Sigma | Mean | Median | Sigma |
| A | 8 | 5 | 1457096 | 9688.89 | 740 | 725 | 150.3 |
| A | 15 | 223 | 143552 | 950.19 | 740 | 725 | 150.3 |
| A | 15 | 239 | 60076 | 394.84 | 740 | 725 | 150.3 |
| B | 4 | 239 | 1022000 | 7248.35 | 747 | 731 | 140.9 |
| B | 0 | 219 | 46166 | 322.47 | 747 | 731 | 140.9 |
| B | 15 | 204 | 25588 | 176.42 | 747 | 731 | 140.9 |
| C | 14 | 67 | 10381 | 57.32 | 732 | 736 | 168.3 |
| C | 13 | 61 | 5381 | 27.6 | 732 | 736 | 168.3 |
| C | 8 | 208 | 4074 | 19.84 | 732 | 736 | 168.3 |
| D | 1 | 52 | 466152 | 2709.31 | 718 | 699 | 171.8 |
| D | 13 | 249 | 147674 | 855.51 | 718 | 699 | 171.8 |
| D | 2 | 14 | 111702 | 646.13 | 718 | 699 | 171.8 |
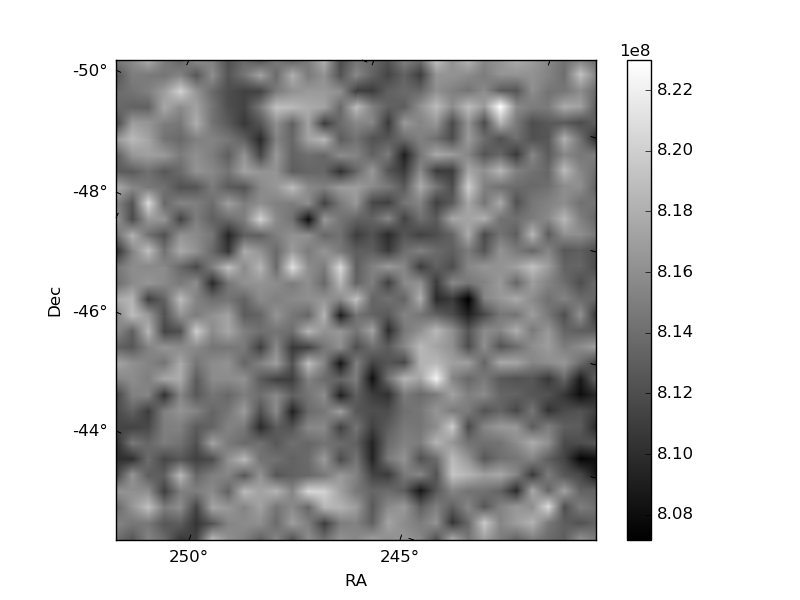
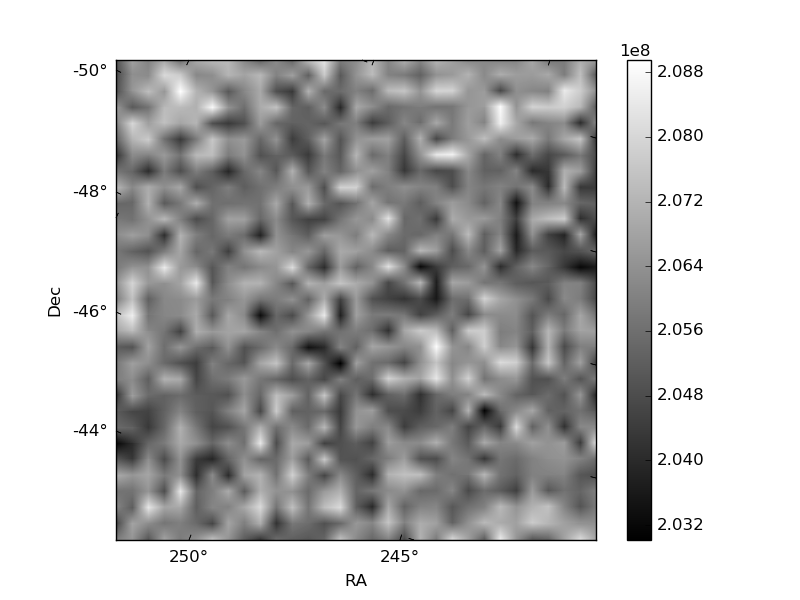
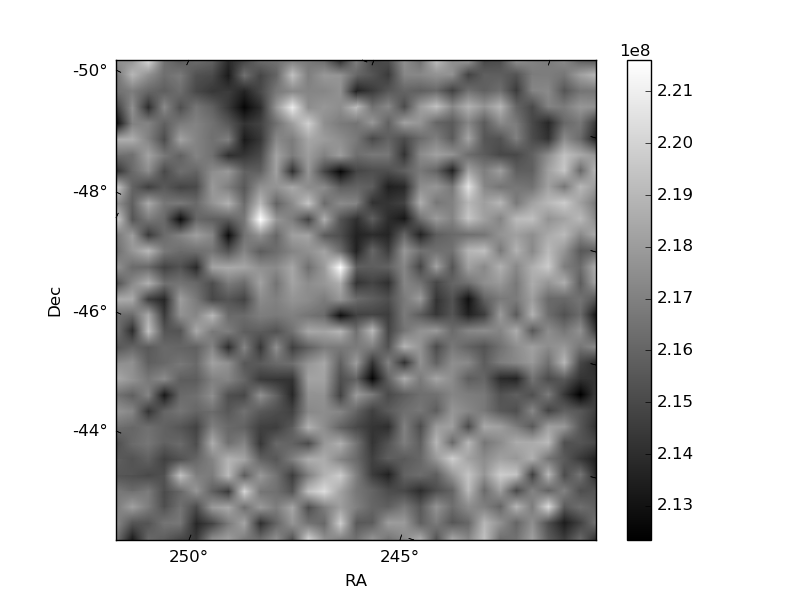
Histogram calculated using DETX and DETY for each event in the final _common_clean file
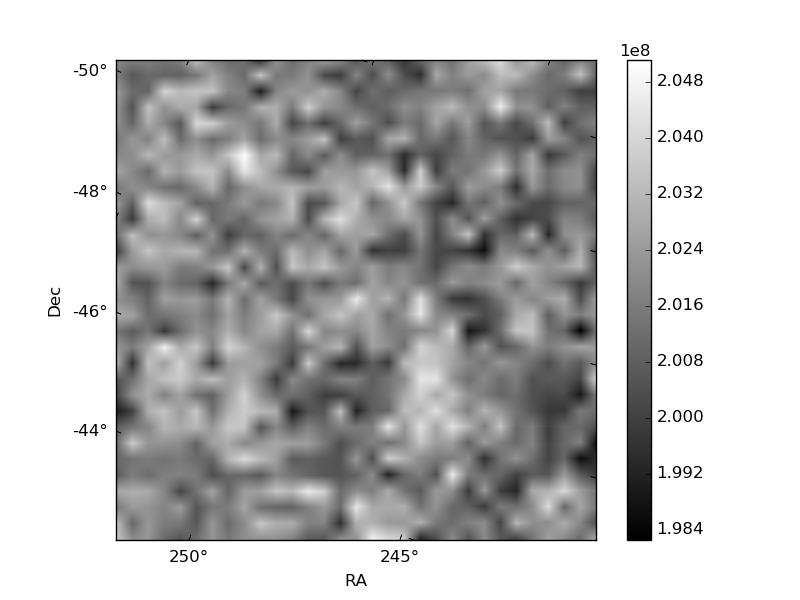
| Quadrant A | 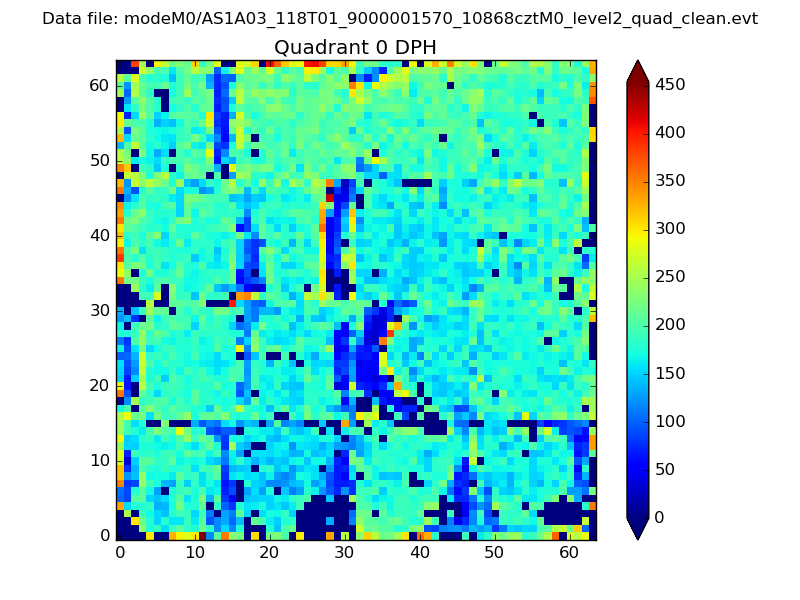 |
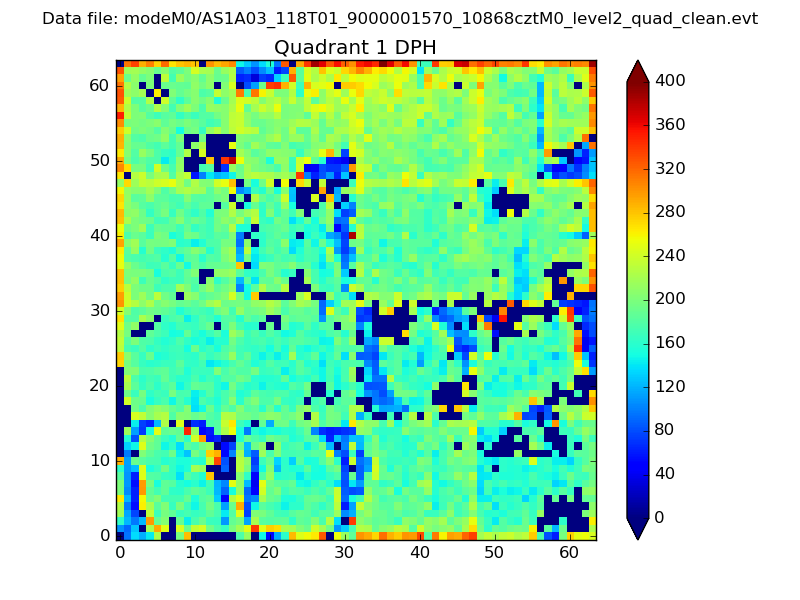 |
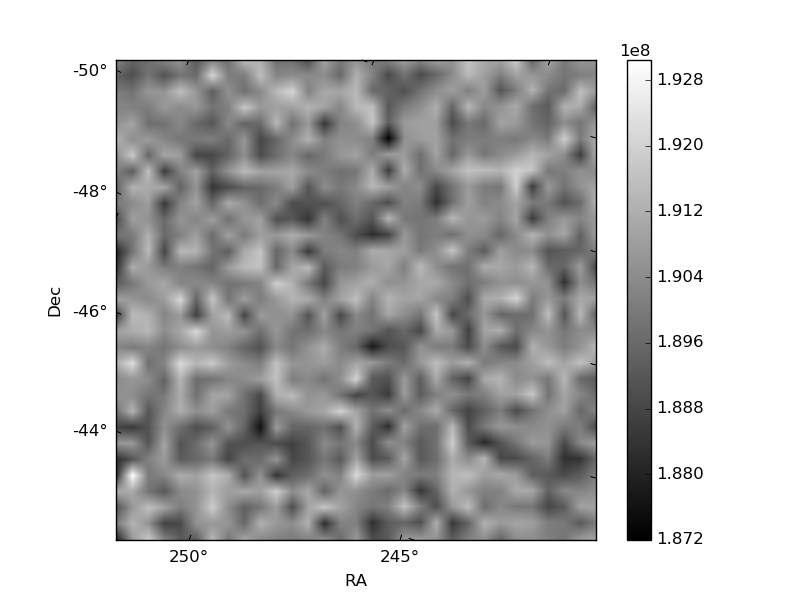
Quadrant B |
|---|---|---|---|
| Quadrant D | 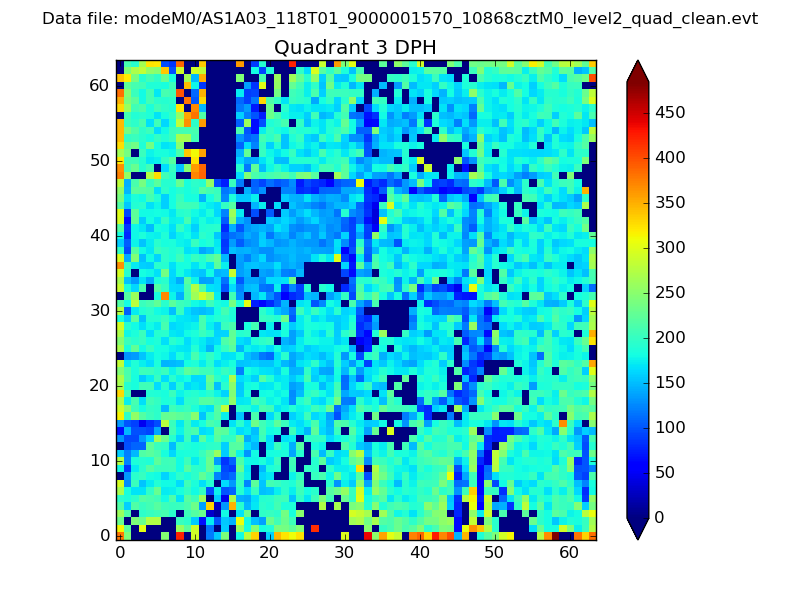 |
 |
Quadrant C |
| Plot type | Count rate plots | Images |
|---|---|---|
| Comparison with Poisson distribution Blue bars denote a histogram of data divided into 1 sec bins. Red curve is a Poisson curve with rate = median count rate of data. |
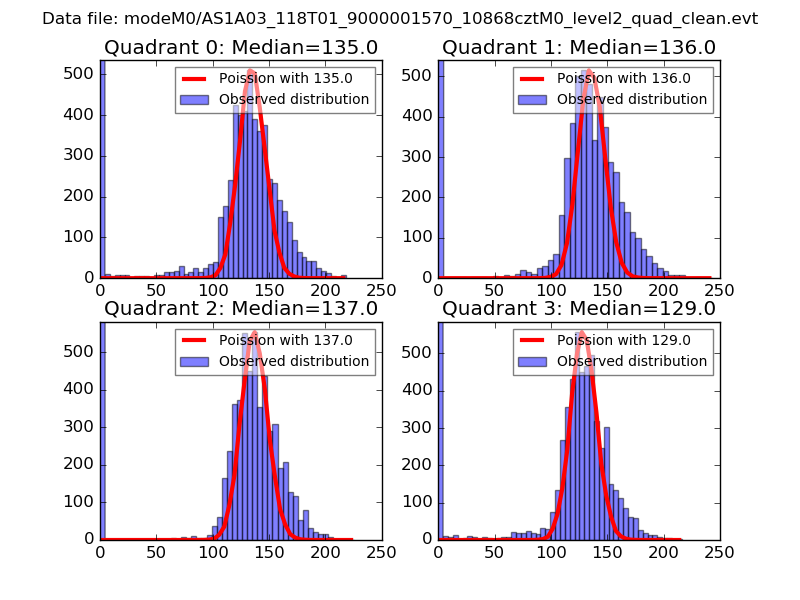 |
 |
| Quadrant-wise count rates Data is divided into 100 sec bins |
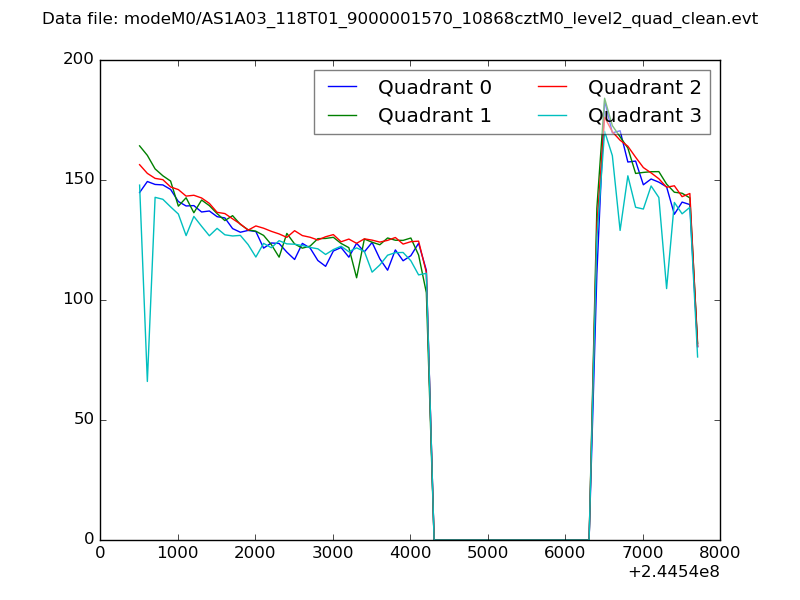 |
|
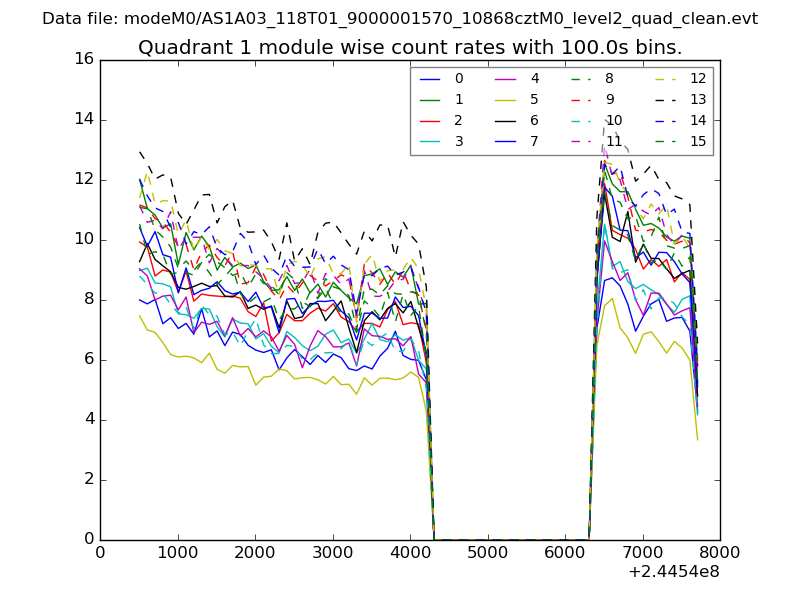
| Module-wise count rates for Quadrant A Data is divided into 100 sec bins |
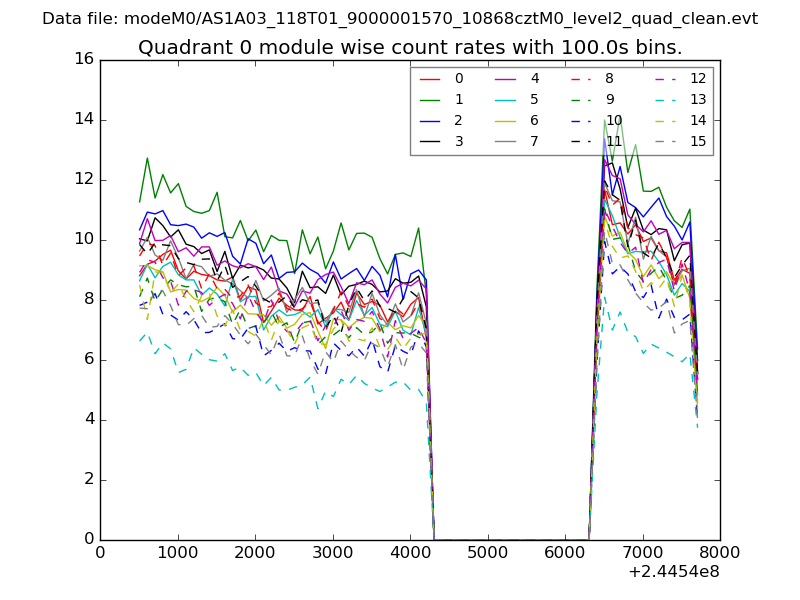 |
 |
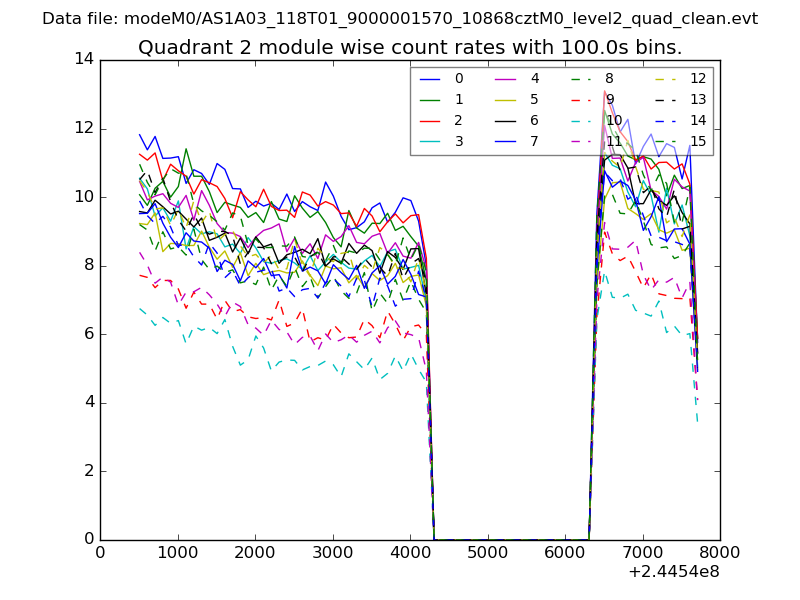
| Module-wise count rates for Quadrant B Data is divided into 100 sec bins |
 |
 |
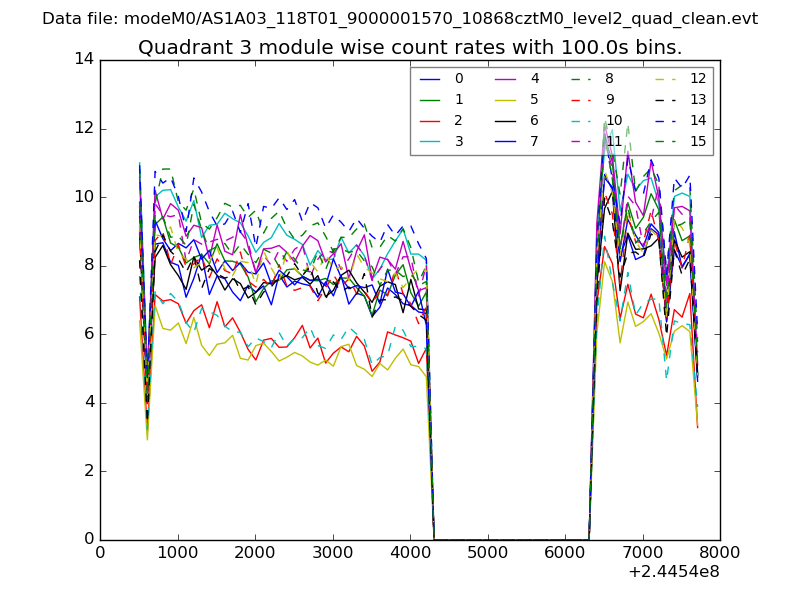
| Module-wise count rates for Quadrant C Data is divided into 100 sec bins |
 |
 |
| Module-wise count rates for Quadrant D Data is divided into 100 sec bins |
 |
 |
| Parameter | Plot |
|---|---|
| CZT HV Monitor | 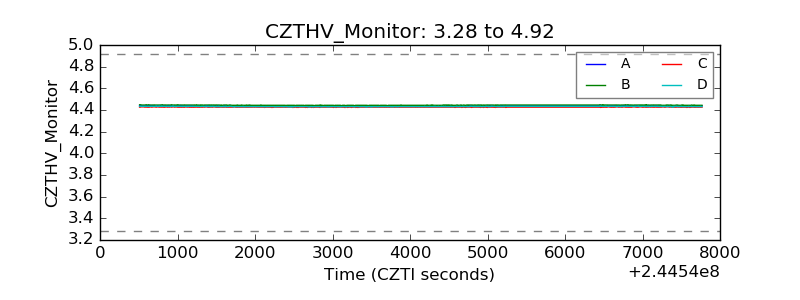 |
| D_VDD | 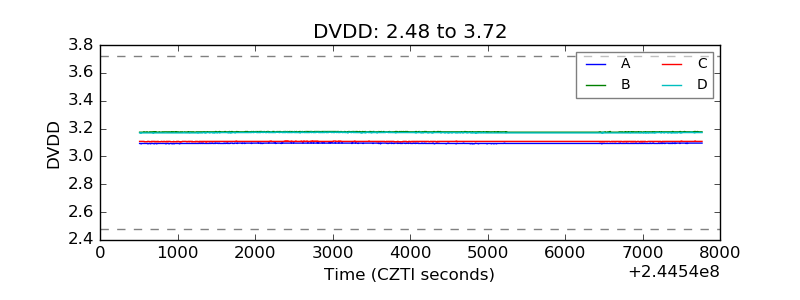 |
| Temperature 1 | 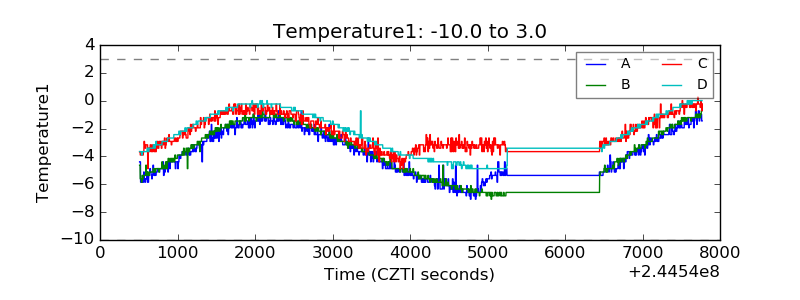 |
| Veto HV Monitor | 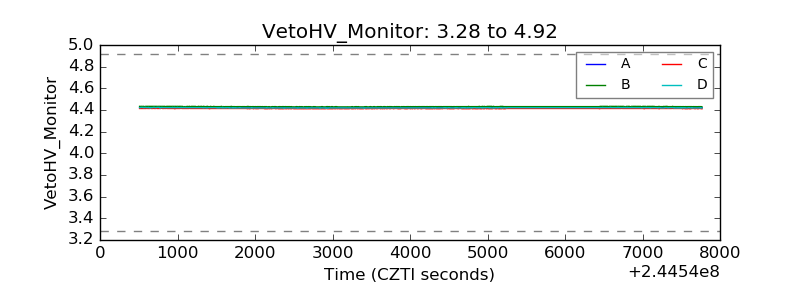 |
| Veto LLD | 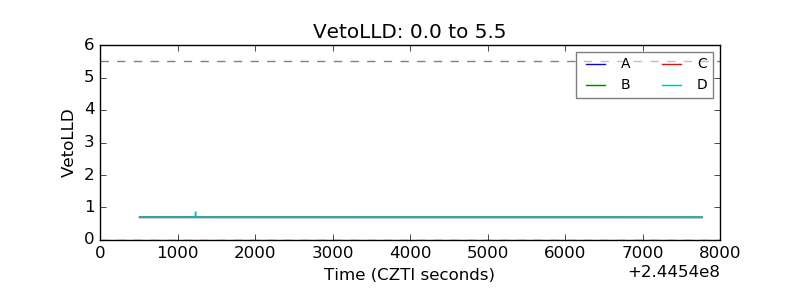 |
| Alpha Counter | 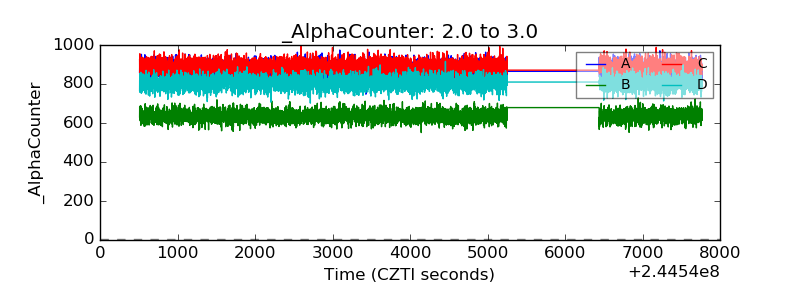 |
| _CPM_Rate | 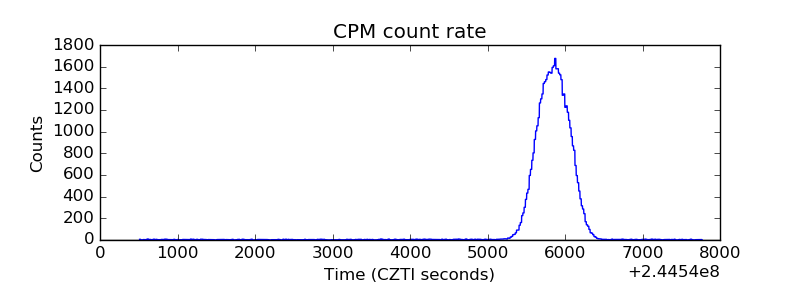 |
| CZT Counter |  |
| +2.5 Volts monitor |  |
| +5 Volts monitor |  |
| _ROLL_ROT | 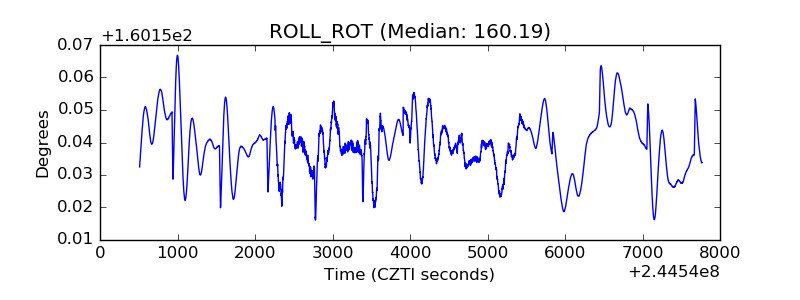 |
| _Roll_DEC | 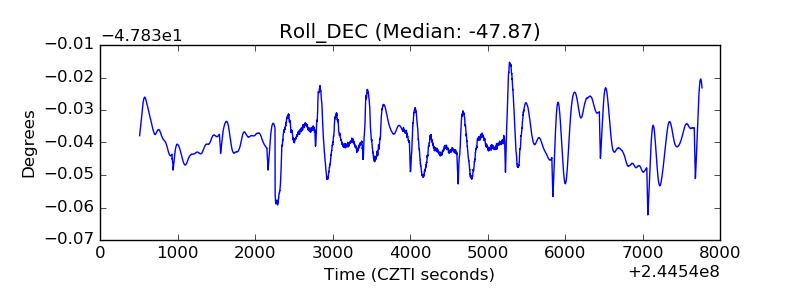 |
| _Roll_RA | 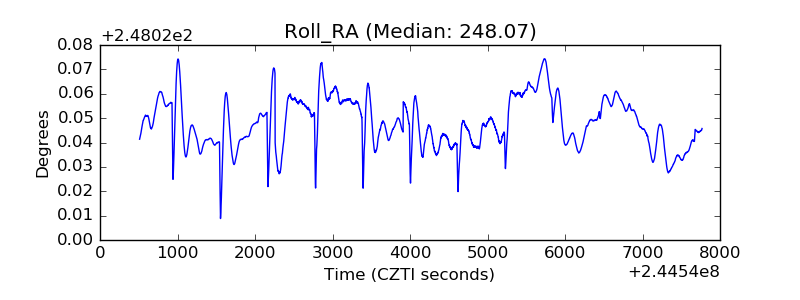 |
| Veto Counter | 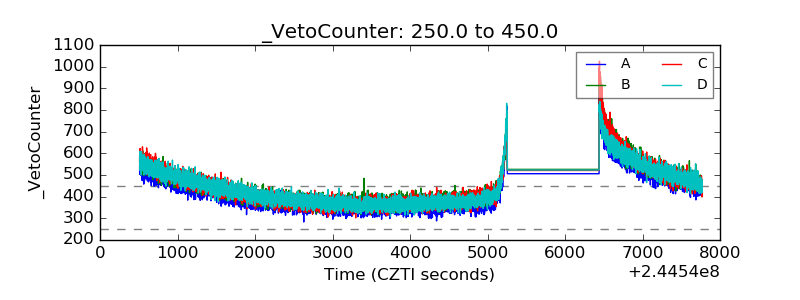 |