| Param | Original file | Final file |
|---|---|---|
| Filename | modeM0/AS1A03_118T01_9000001570_10869cztM0_level2.evt | modeM0/AS1A03_118T01_9000001570_10869cztM0_level2_quad_clean.evt |
| Size (bytes) | 651,597,120 | 107,562,240 |
| Size | 621.4 MB | 102.6 MB |
| Events in quadrant A | 4,932,071 | 711,789 |
| Events in quadrant B | 4,484,362 | 724,109 |
| Events in quadrant C | 3,074,175 | 728,352 |
| Events in quadrant D | 6,806,137 | 642,719 |
| Mode M9 | |||
|---|---|---|---|
| Quadrant | BADHDUFLAG | Total packets | Discarded packets |
| A | 0 | 12 | 0 |
| B | 0 | 12 | 0 |
| C | 0 | 12 | 0 |
| D | 0 | 12 | 0 |
| Mode SS | |||
|---|---|---|---|
| Quadrant | BADHDUFLAG | Total packets | Discarded packets |
| A | 0 | 132 | 0 |
| B | 0 | 132 | 0 |
| C | 0 | 132 | 0 |
| D | 0 | 132 | 0 |
| Mode M0 | |||
|---|---|---|---|
| Quadrant | BADHDUFLAG | Total packets | Discarded packets |
| A | 0 | 19120 | 2 |
| B | 0 | 17601 | 1 |
| C | 0 | 13446 | 1 |
| D | 0 | 24487 | 1 |
| Quadrant | Total seconds | Saturated seconds | Saturation percentage |
|---|---|---|---|
| A | 6452 | 446 | 6.912585% |
| B | 6452 | 340 | 5.269684% |
| C | 6452 | 66 | 1.022939% |
| D | 6452 | 1518 | 23.527588% |
Noise dominated data is calculated using 1-second bins in cleaned event files. If a bin has >2000 counts, and if more than 50% of those come from <1% of pixels, then it is considered to be noise-dominated and hence unusable.
| Quadrant | # 1 sec bins | Bins with >0 counts | Bins with >2000 counts | High rate bins dominated by noise | Noise dominated (total time) | Noise dominated (detector-on time) | Marked lightcurve |
|---|---|---|---|---|---|---|---|
| A | 7672 | 6452 | 250 | 250 | 3.26% | 3.87% | 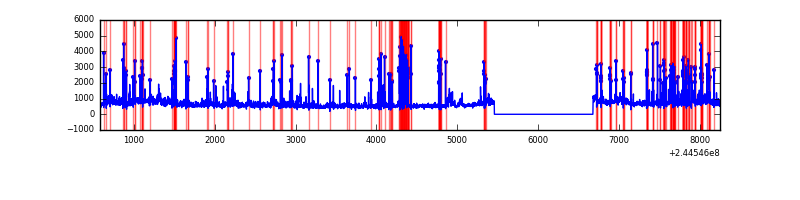 |
| B | 7672 | 6452 | 164 | 164 | 2.14% | 2.54% | 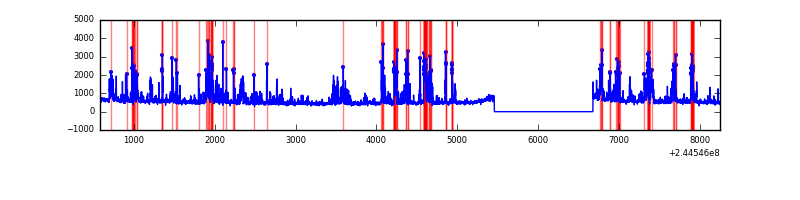 |
| C | 7672 | 6452 | 1 | 1 | 0.01% | 0.02% | 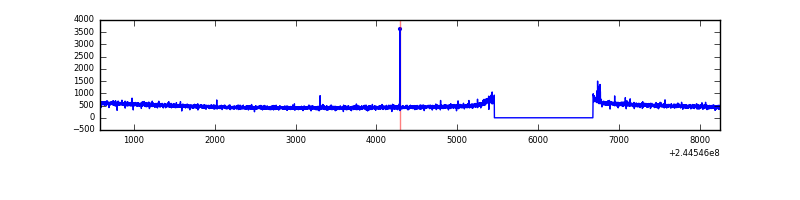 |
| D | 7672 | 6452 | 1340 | 1340 | 17.47% | 20.77% | 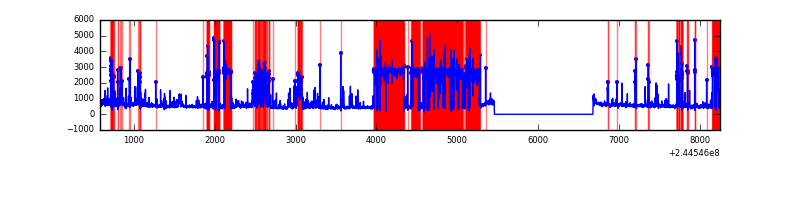 |
Top three noisy pixels from each quadrant. If the there are fewer than three noisy pixels in the level2.evt file, extra rows are filled as -1
| Pixel properties | Quadrant properties | ||||||
|---|---|---|---|---|---|---|---|
| Quadrant | DetID | PixID | Counts | Sigma | Mean | Median | Sigma |
| A | 8 | 5 | 1769828 | 10979.13 | 800 | 783 | 161.1 |
| A | 0 | 254 | 27879 | 168.16 | 800 | 783 | 161.1 |
| A | 15 | 223 | 11971 | 69.44 | 800 | 783 | 161.1 |
| B | 4 | 239 | 1202760 | 7903.42 | 801 | 785 | 152.1 |
| B | 0 | 245 | 50833 | 329.08 | 801 | 785 | 152.1 |
| B | 15 | 204 | 35104 | 225.66 | 801 | 785 | 152.1 |
| C | 14 | 234 | 12855 | 67.06 | 783 | 786 | 180.0 |
| C | 13 | 61 | 5776 | 27.72 | 783 | 786 | 180.0 |
| C | 8 | 208 | 2778 | 11.07 | 783 | 786 | 180.0 |
| D | 1 | 52 | 3502837 | 21367.09 | 685 | 666 | 163.9 |
| D | 10 | 199 | 338538 | 2061.39 | 685 | 666 | 163.9 |
| D | 6 | 219 | 97507 | 590.84 | 685 | 666 | 163.9 |
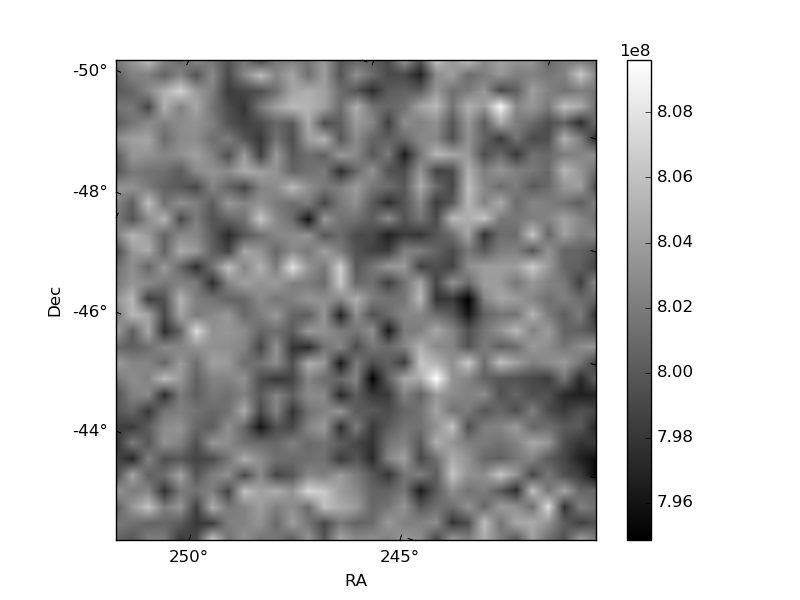
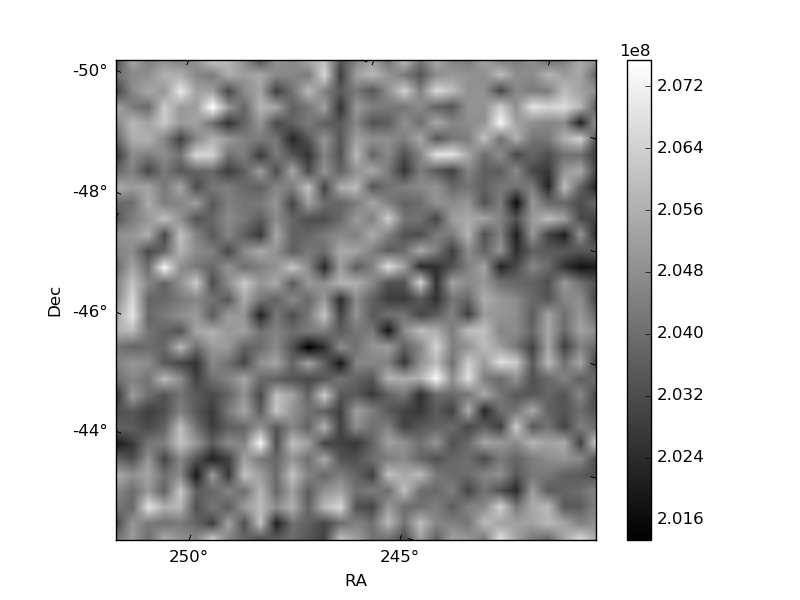
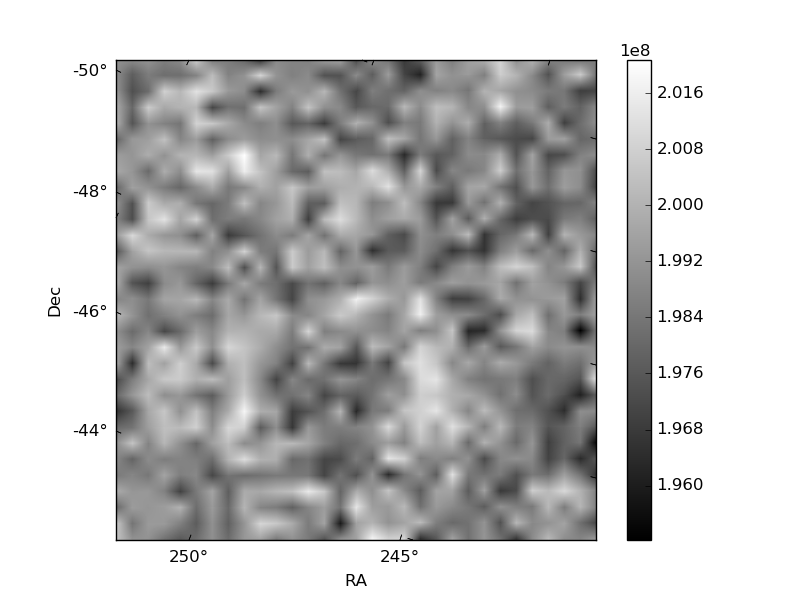
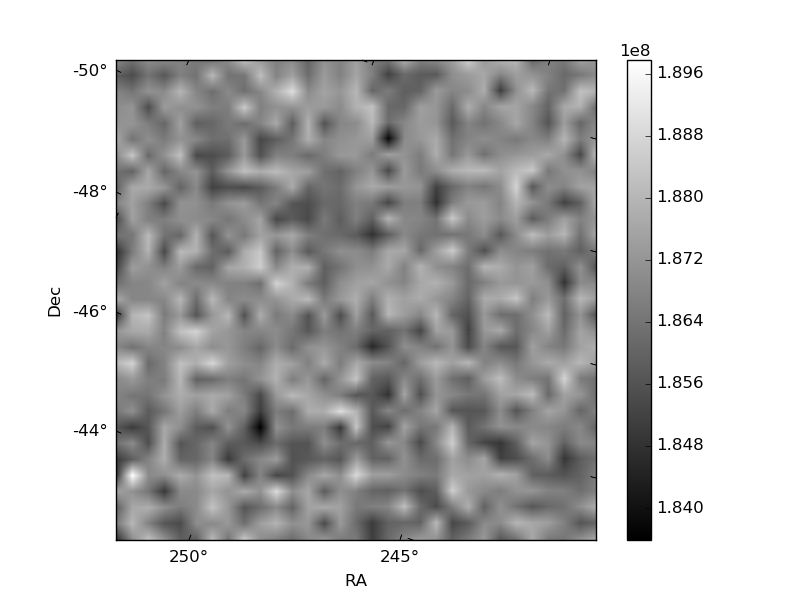
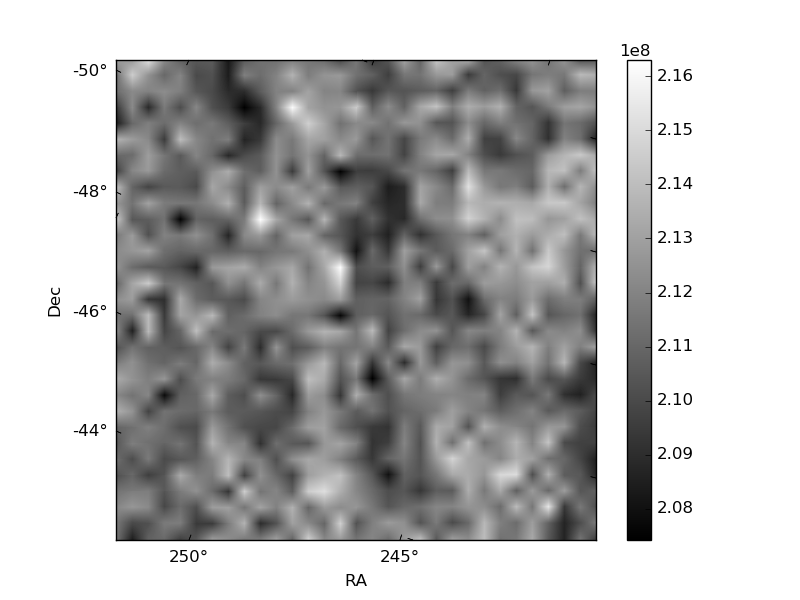
Histogram calculated using DETX and DETY for each event in the final _common_clean file
| Quadrant A |  |
 |
Quadrant B |
|---|---|---|---|
| Quadrant D |  |
 |
Quadrant C |
| Plot type | Count rate plots | Images |
|---|---|---|
| Comparison with Poisson distribution Blue bars denote a histogram of data divided into 1 sec bins. Red curve is a Poisson curve with rate = median count rate of data. |
 |
 |
| Quadrant-wise count rates Data is divided into 100 sec bins |
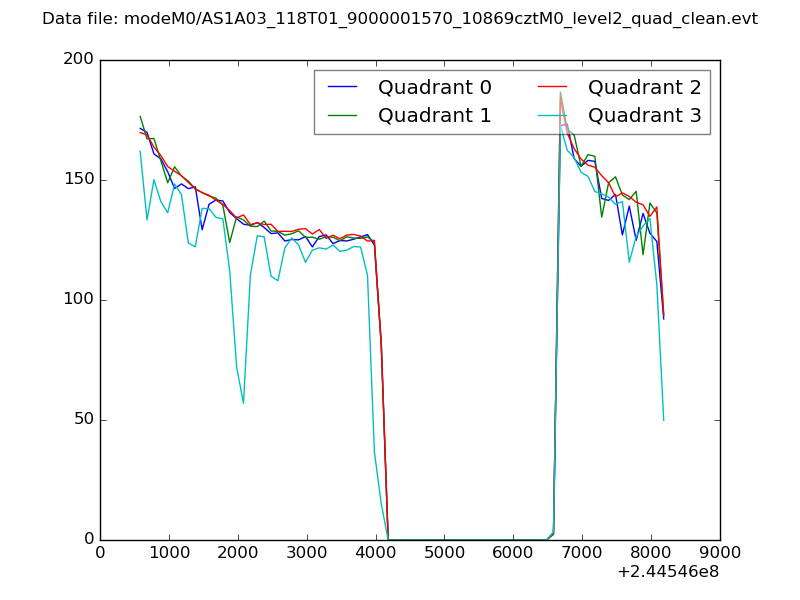 |
|
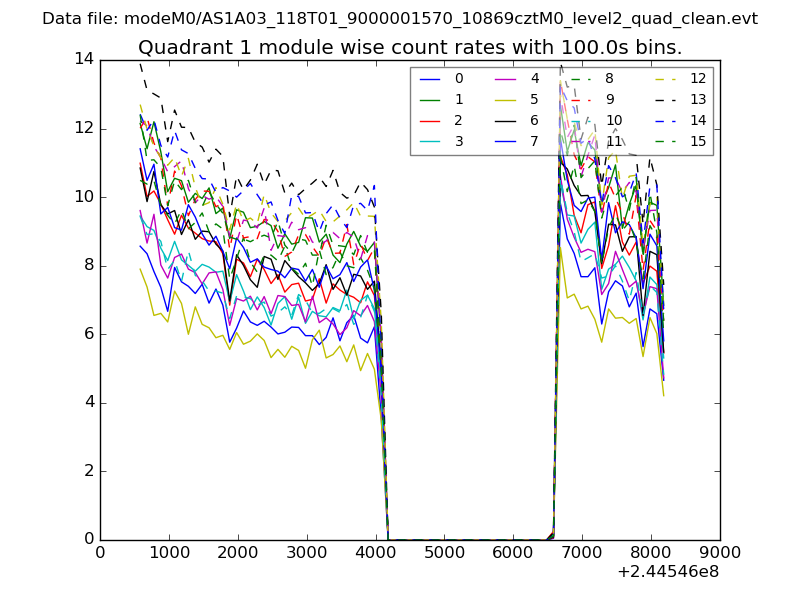
| Module-wise count rates for Quadrant A Data is divided into 100 sec bins |
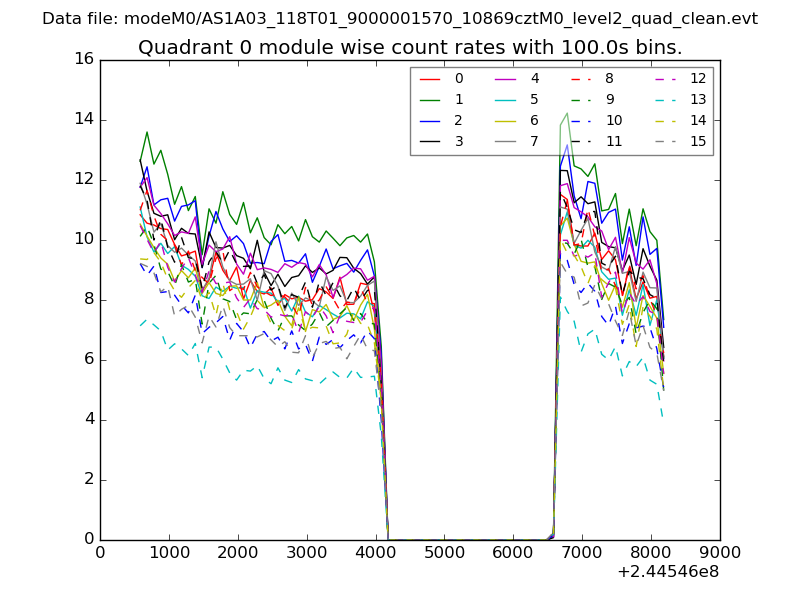 |
 |
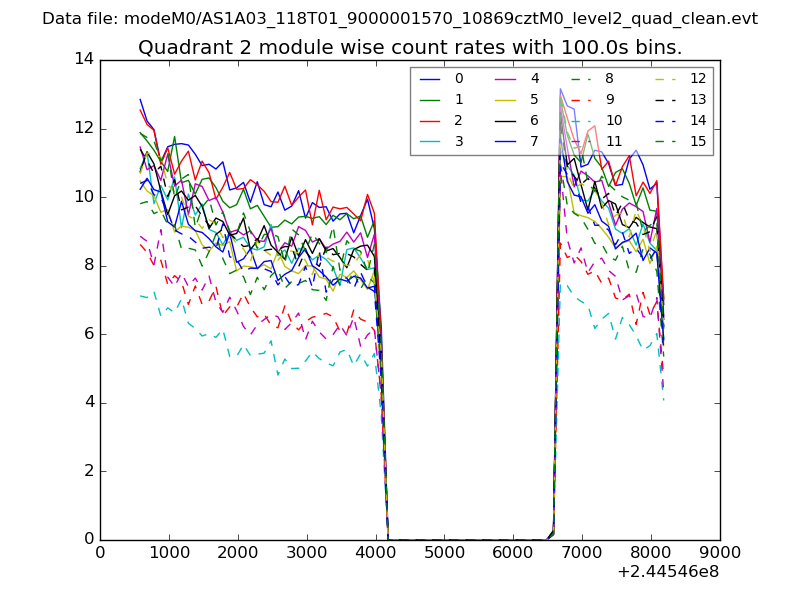
| Module-wise count rates for Quadrant B Data is divided into 100 sec bins |
 |
 |
| Module-wise count rates for Quadrant C Data is divided into 100 sec bins |
 |
 |
| Module-wise count rates for Quadrant D Data is divided into 100 sec bins |
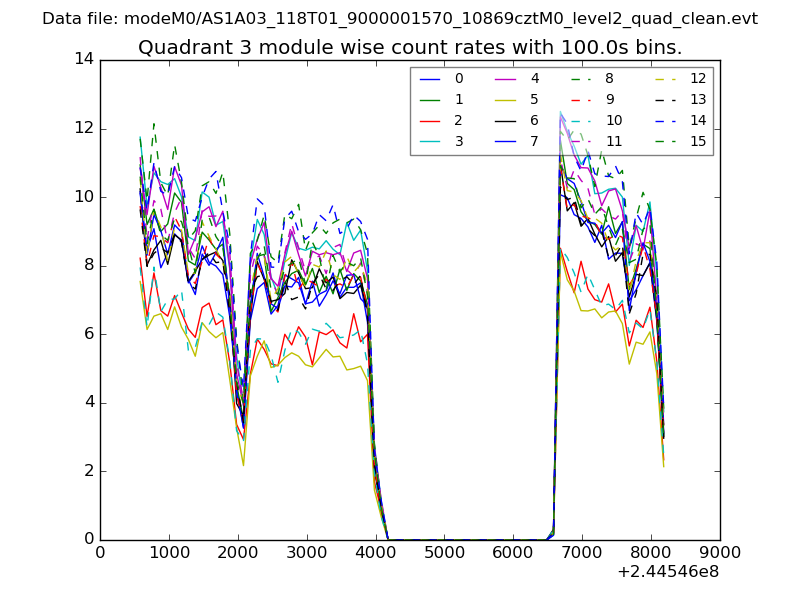 |
 |
| Parameter | Plot |
|---|---|
| CZT HV Monitor | 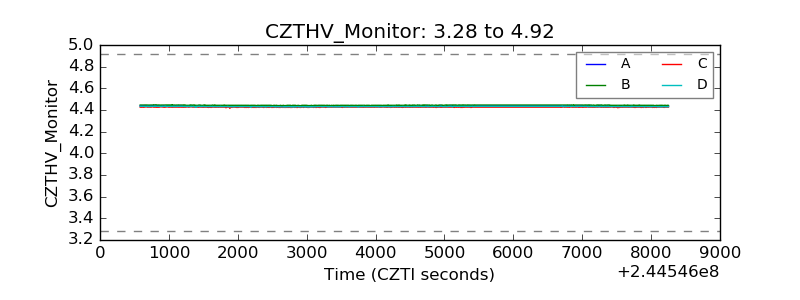 |
| D_VDD | 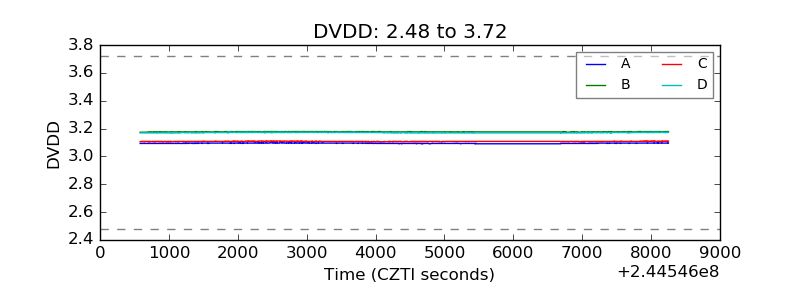 |
| Temperature 1 | 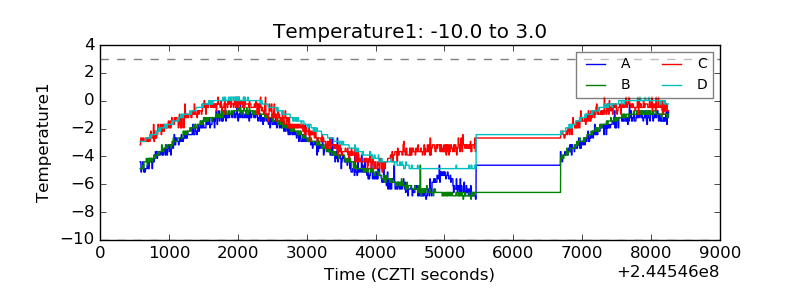 |
| Veto HV Monitor |  |
| Veto LLD | 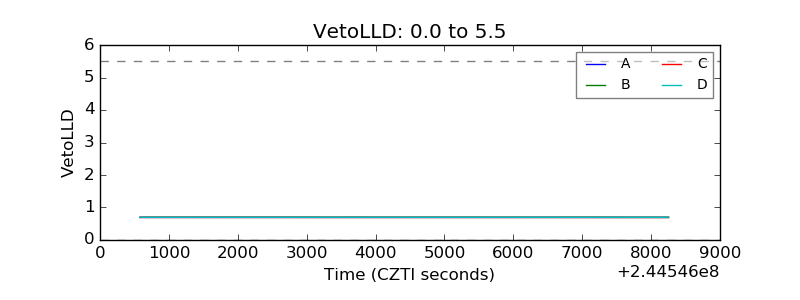 |
| Alpha Counter | 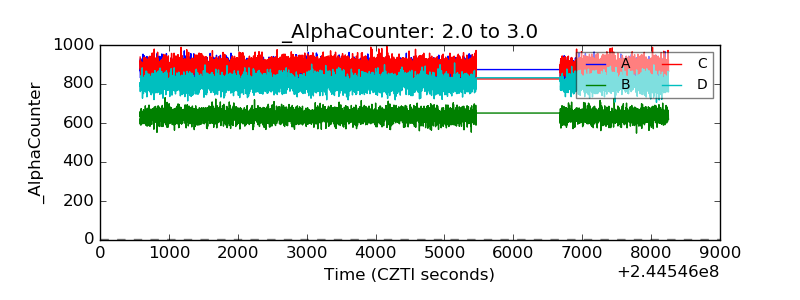 |
| _CPM_Rate | 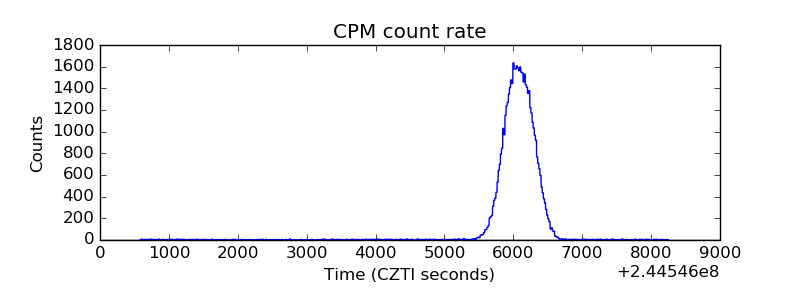 |
| CZT Counter |  |
| +2.5 Volts monitor |  |
| +5 Volts monitor | 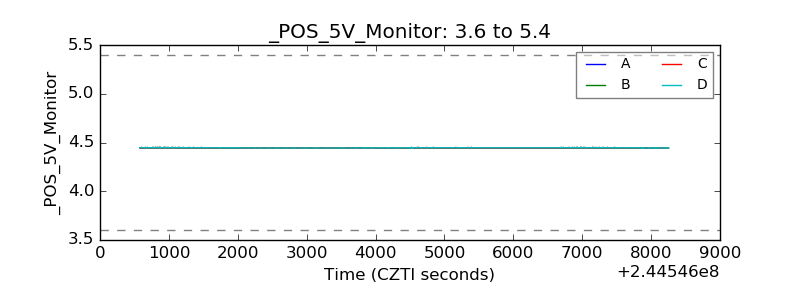 |
| _ROLL_ROT | 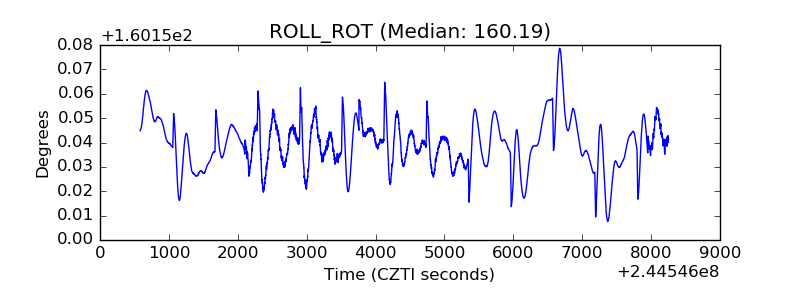 |
| _Roll_DEC |  |
| _Roll_RA | 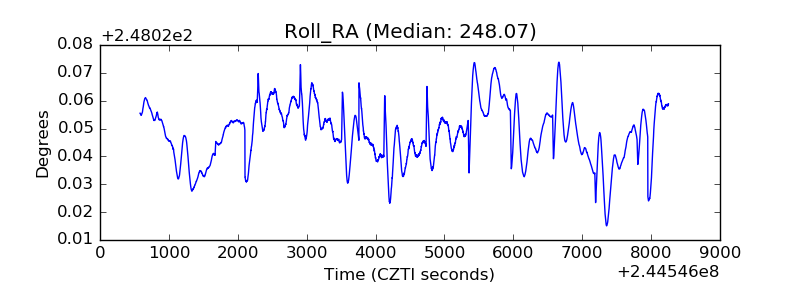 |
| Veto Counter | 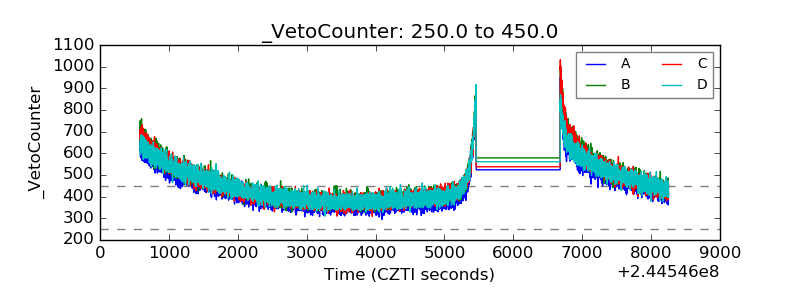 |