| Param | Original file | Final file |
|---|---|---|
| Filename | modeM0/AS1A03_118T01_9000001570_10870cztM0_level2.evt | modeM0/AS1A03_118T01_9000001570_10870cztM0_level2_quad_clean.evt |
| Size (bytes) | 583,113,600 | 89,959,680 |
| Size | 556.1 MB | 85.8 MB |
| Events in quadrant A | 5,413,499 | 569,332 |
| Events in quadrant B | 4,205,928 | 590,686 |
| Events in quadrant C | 2,811,693 | 601,267 |
| Events in quadrant D | 4,815,961 | 537,158 |
| Mode M9 | |||
|---|---|---|---|
| Quadrant | BADHDUFLAG | Total packets | Discarded packets |
| A | 0 | 13 | 0 |
| B | 0 | 13 | 0 |
| C | 0 | 13 | 0 |
| D | 0 | 13 | 0 |
| Mode SS | |||
|---|---|---|---|
| Quadrant | BADHDUFLAG | Total packets | Discarded packets |
| A | 0 | 124 | 0 |
| B | 0 | 124 | 0 |
| C | 0 | 124 | 0 |
| D | 0 | 124 | 0 |
| Mode M0 | |||
|---|---|---|---|
| Quadrant | BADHDUFLAG | Total packets | Discarded packets |
| A | 0 | 20440 | 2 |
| B | 0 | 16437 | 1 |
| C | 0 | 12553 | 1 |
| D | 0 | 18402 | 1 |
| Quadrant | Total seconds | Saturated seconds | Saturation percentage |
|---|---|---|---|
| A | 6091 | 622 | 10.211788% |
| B | 6091 | 382 | 6.271548% |
| C | 6091 | 38 | 0.623871% |
| D | 6091 | 626 | 10.277459% |
Noise dominated data is calculated using 1-second bins in cleaned event files. If a bin has >2000 counts, and if more than 50% of those come from <1% of pixels, then it is considered to be noise-dominated and hence unusable.
| Quadrant | # 1 sec bins | Bins with >0 counts | Bins with >2000 counts | High rate bins dominated by noise | Noise dominated (total time) | Noise dominated (detector-on time) | Marked lightcurve |
|---|---|---|---|---|---|---|---|
| A | 7341 | 6092 | 417 | 417 | 5.68% | 6.85% | 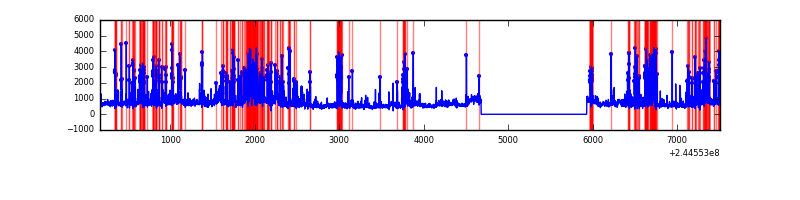 |
| B | 7341 | 6092 | 252 | 252 | 3.43% | 4.14% | 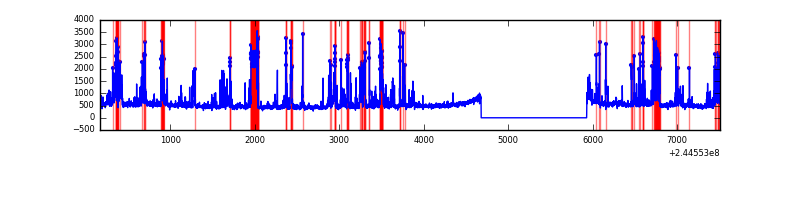 |
| C | 7341 | 6092 | 4 | 4 | 0.05% | 0.07% | 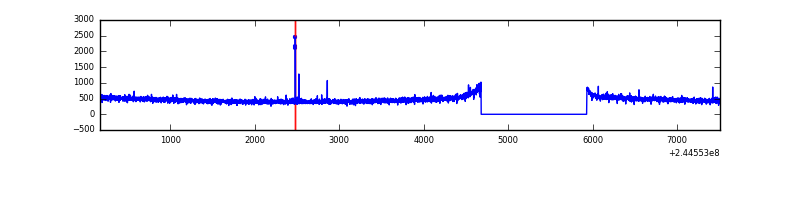 |
| D | 7341 | 6092 | 569 | 569 | 7.75% | 9.34% | 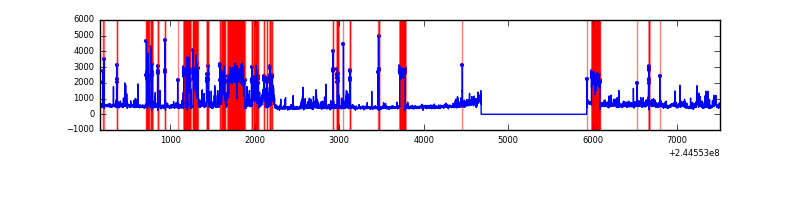 |
Top three noisy pixels from each quadrant. If the there are fewer than three noisy pixels in the level2.evt file, extra rows are filled as -1
| Pixel properties | Quadrant properties | ||||||
|---|---|---|---|---|---|---|---|
| Quadrant | DetID | PixID | Counts | Sigma | Mean | Median | Sigma |
| A | 8 | 5 | 2448086 | 16657.06 | 722 | 707 | 146.9 |
| A | 15 | 223 | 91011 | 614.62 | 722 | 707 | 146.9 |
| A | 15 | 239 | 36139 | 241.15 | 722 | 707 | 146.9 |
| B | 4 | 239 | 1240253 | 8960.84 | 729 | 711 | 138.3 |
| B | 0 | 245 | 54679 | 390.14 | 729 | 711 | 138.3 |
| B | 0 | 219 | 26377 | 185.54 | 729 | 711 | 138.3 |
| C | 1 | 3 | 18358 | 107.34 | 714 | 717 | 164.3 |
| C | 13 | 61 | 5387 | 28.42 | 714 | 717 | 164.3 |
| C | 14 | 128 | 4600 | 23.63 | 714 | 717 | 164.3 |
| D | 1 | 52 | 971876 | 5928.1 | 682 | 663 | 163.8 |
| D | 10 | 199 | 846362 | 5161.99 | 682 | 663 | 163.8 |
| D | 8 | 195 | 122323 | 742.59 | 682 | 663 | 163.8 |
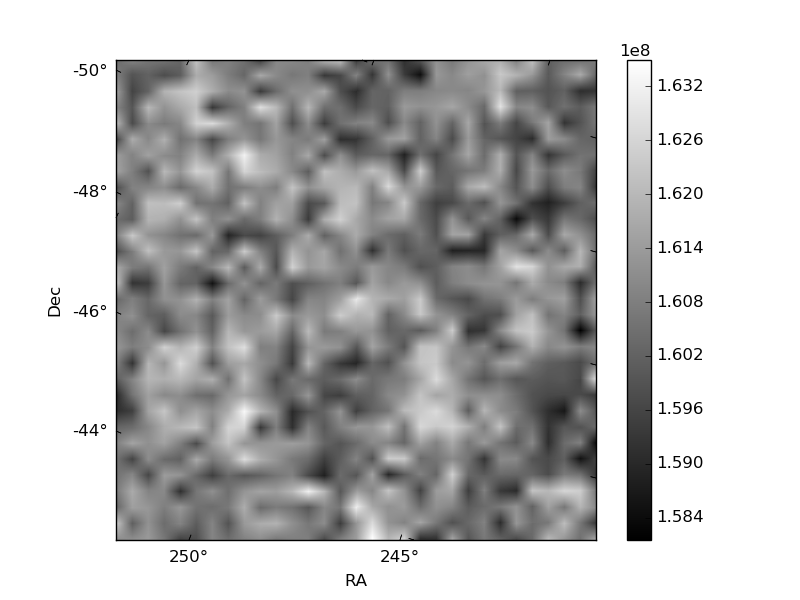
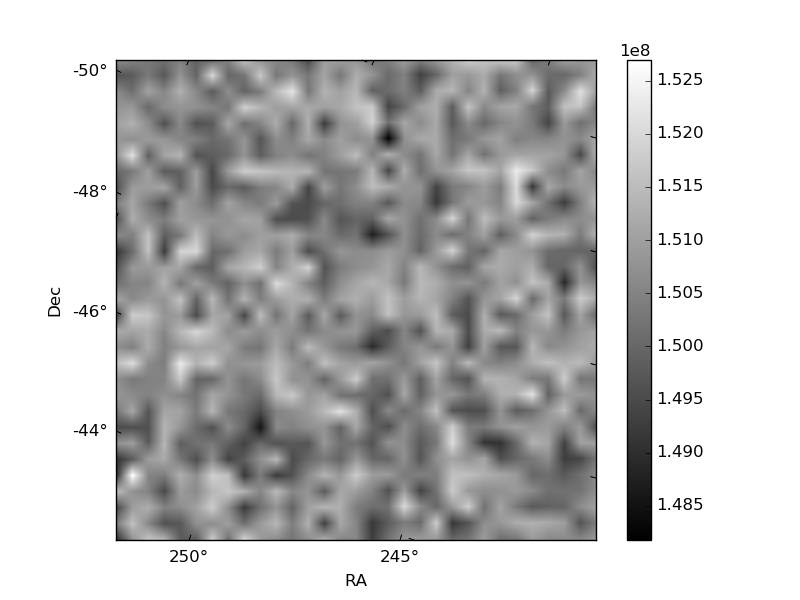
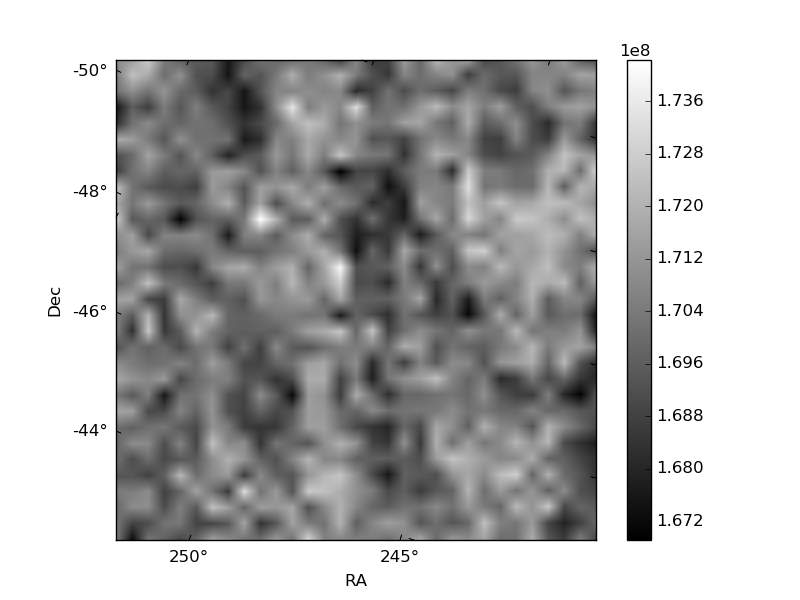
Histogram calculated using DETX and DETY for each event in the final _common_clean file
| Quadrant A | 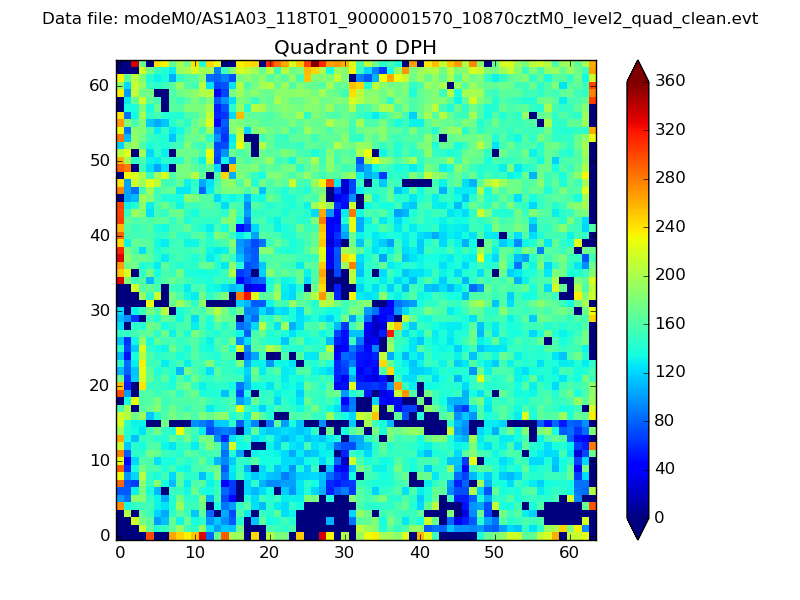 |
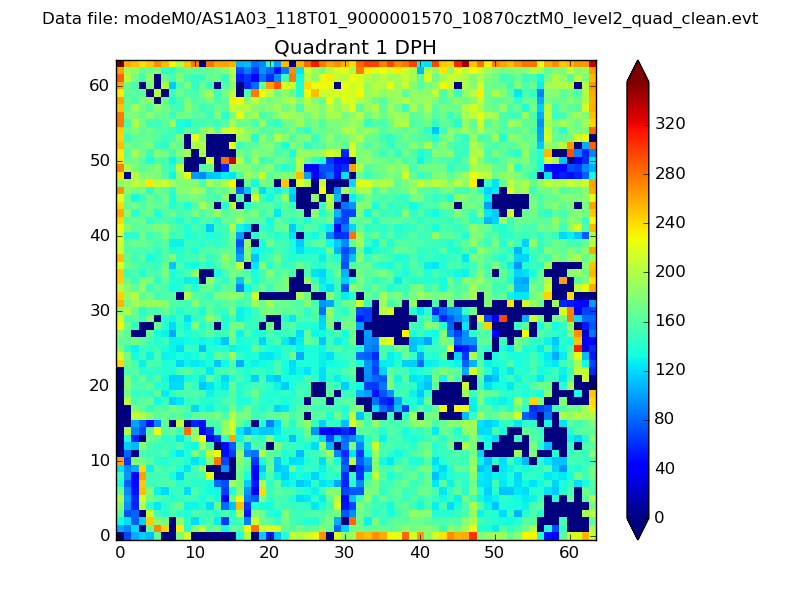 |
Quadrant B |
|---|---|---|---|
| Quadrant D | 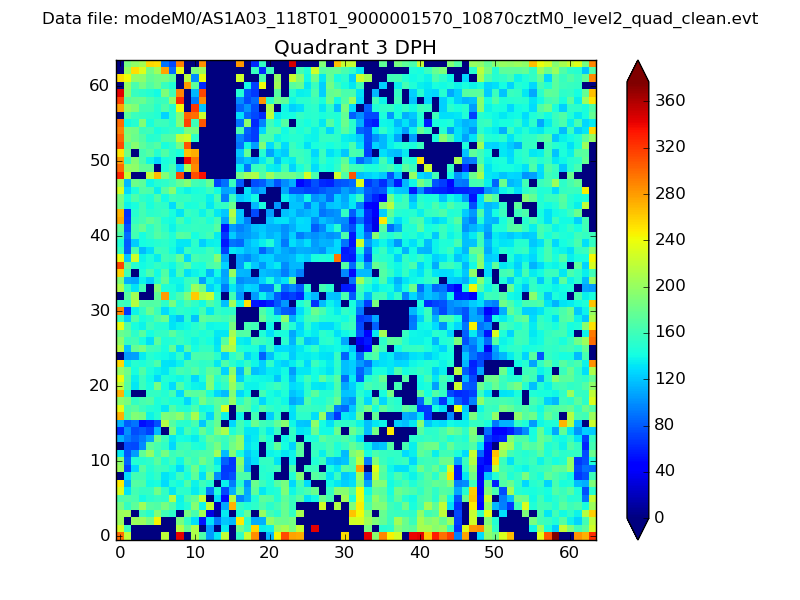 |
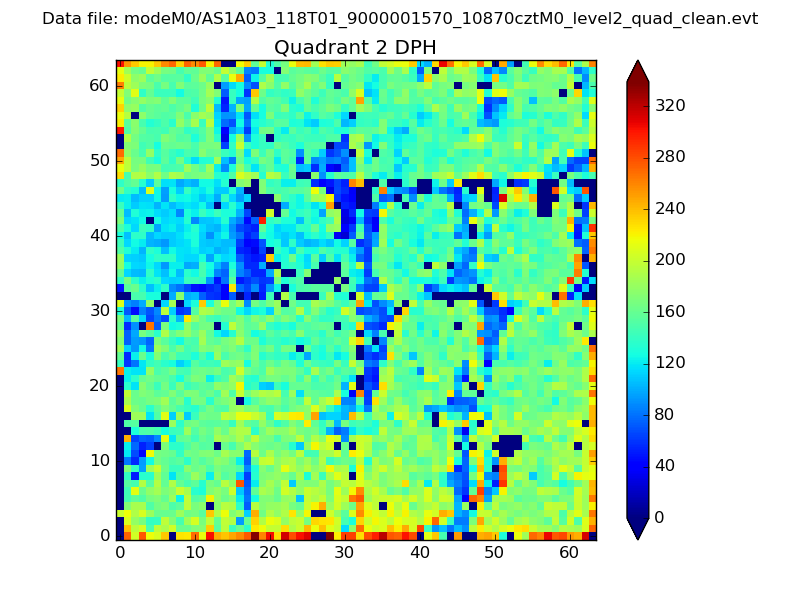 |
Quadrant C |
| Plot type | Count rate plots | Images |
|---|---|---|
| Comparison with Poisson distribution Blue bars denote a histogram of data divided into 1 sec bins. Red curve is a Poisson curve with rate = median count rate of data. |
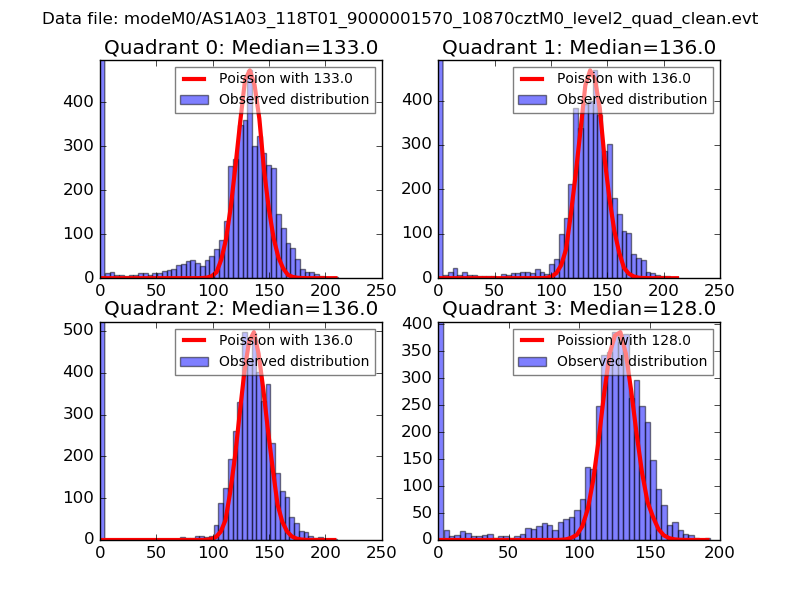 |
 |
| Quadrant-wise count rates Data is divided into 100 sec bins |
 |
|
| Module-wise count rates for Quadrant A Data is divided into 100 sec bins |
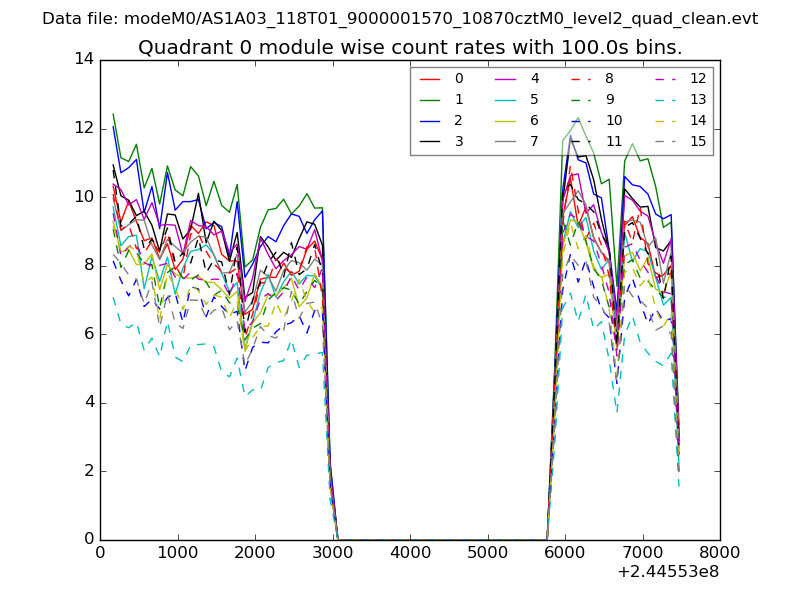 |
 |
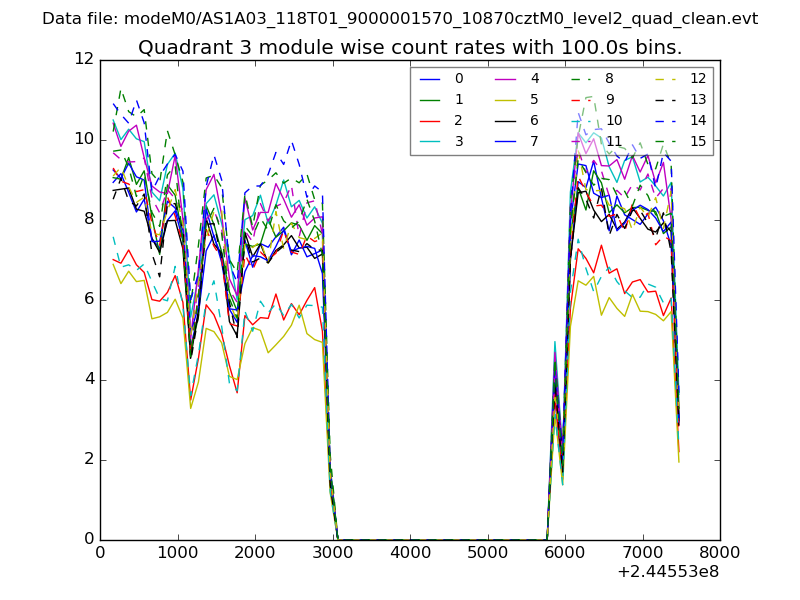
| Module-wise count rates for Quadrant B Data is divided into 100 sec bins |
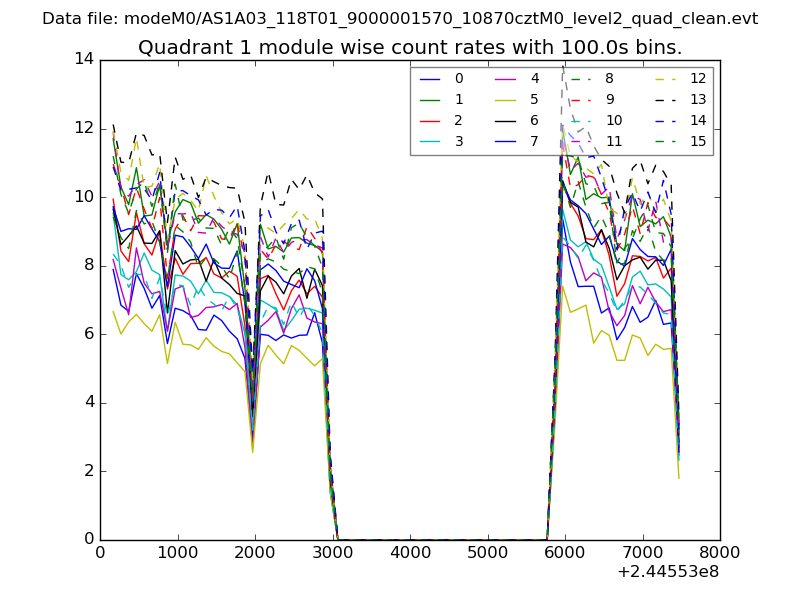 |
 |
| Module-wise count rates for Quadrant C Data is divided into 100 sec bins |
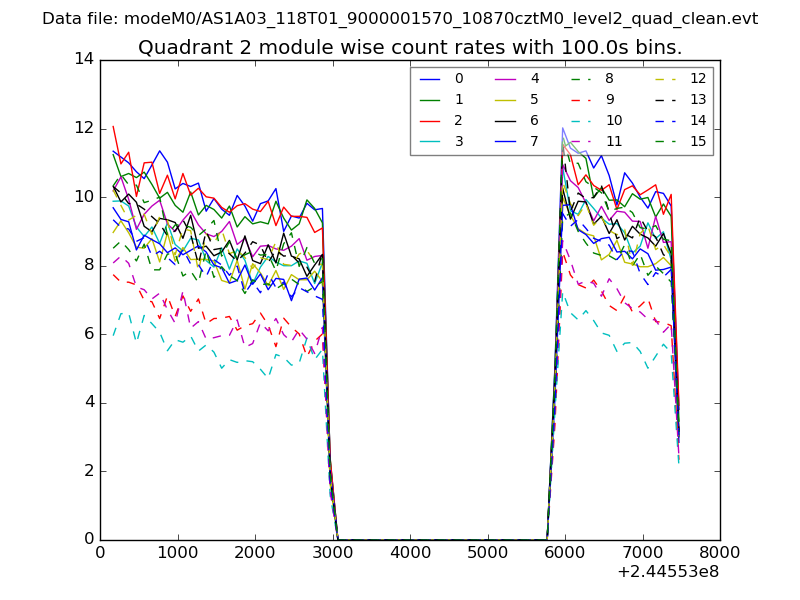 |
 |
| Module-wise count rates for Quadrant D Data is divided into 100 sec bins |
 |
 |
| Parameter | Plot |
|---|---|
| CZT HV Monitor | 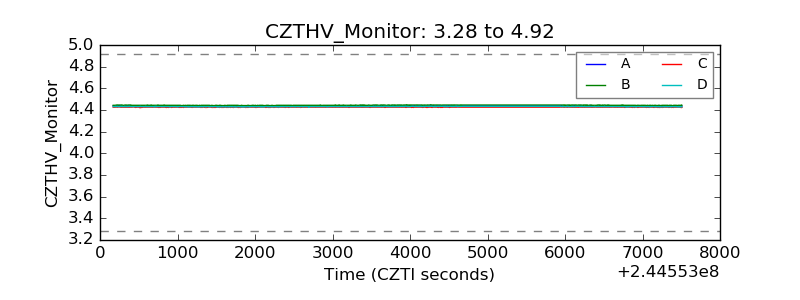 |
| D_VDD | 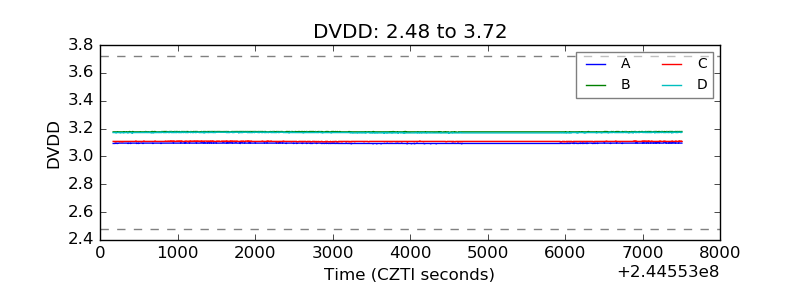 |
| Temperature 1 | 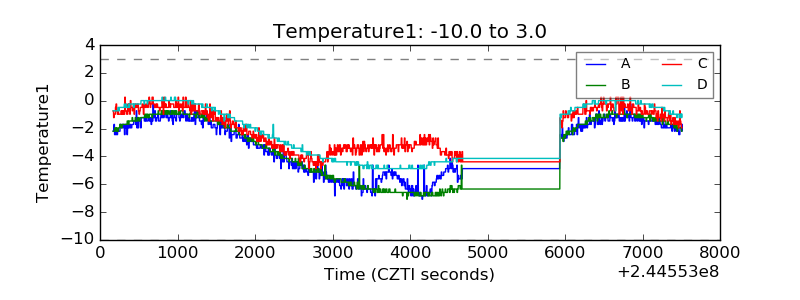 |
| Veto HV Monitor | 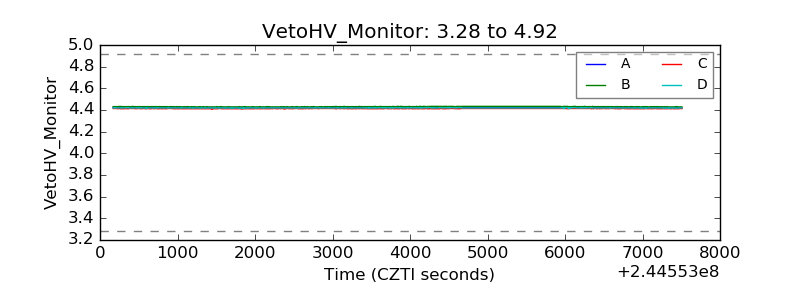 |
| Veto LLD | 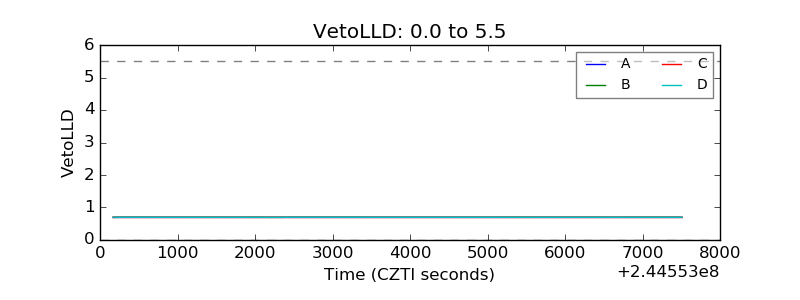 |
| Alpha Counter | 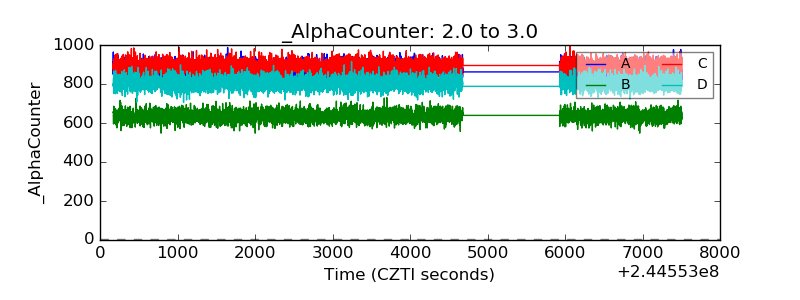 |
| _CPM_Rate | 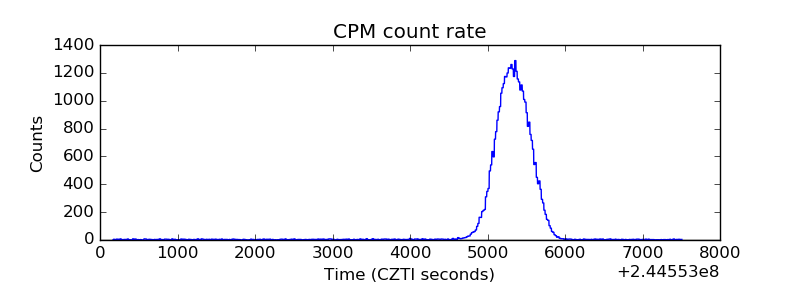 |
| CZT Counter | 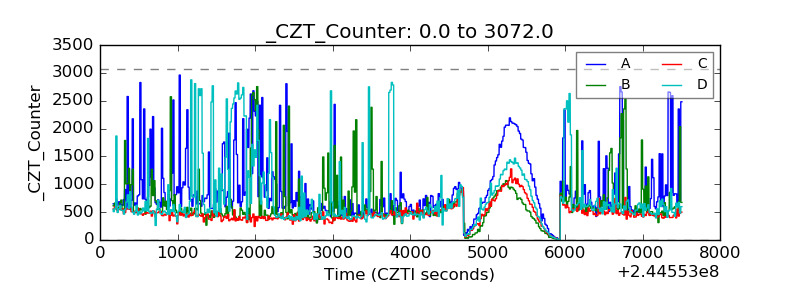 |
| +2.5 Volts monitor |  |
| +5 Volts monitor |  |
| _ROLL_ROT | 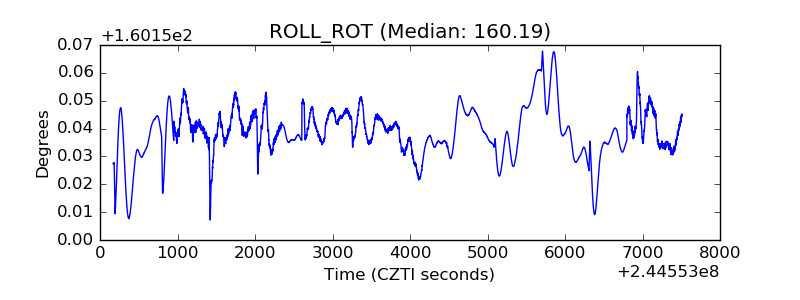 |
| _Roll_DEC | 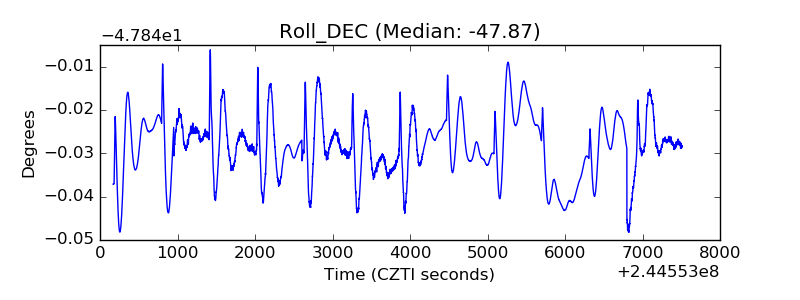 |
| _Roll_RA |  |
| Veto Counter | 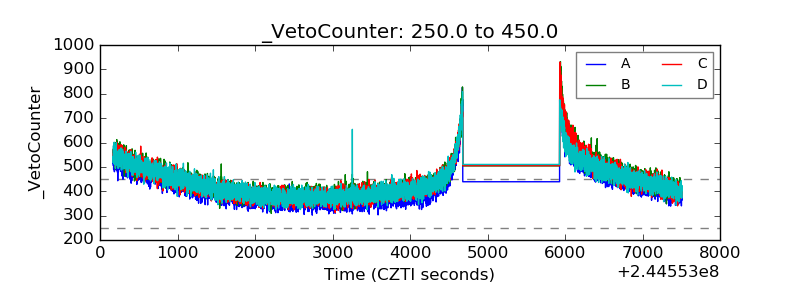 |