| Param | Original file | Final file |
|---|---|---|
| Filename | modeM0/AS1A03_118T01_9000001570_10872cztM0_level2.evt | modeM0/AS1A03_118T01_9000001570_10872cztM0_level2_quad_clean.evt |
| Size (bytes) | 599,941,440 | 80,881,920 |
| Size | 572.1 MB | 77.1 MB |
| Events in quadrant A | 4,585,407 | 521,488 |
| Events in quadrant B | 4,705,798 | 509,970 |
| Events in quadrant C | 2,677,461 | 541,370 |
| Events in quadrant D | 5,787,692 | 450,471 |
| Mode M9 | |||
|---|---|---|---|
| Quadrant | BADHDUFLAG | Total packets | Discarded packets |
| A | 0 | 10 | 0 |
| B | 0 | 10 | 0 |
| C | 0 | 10 | 0 |
| D | 0 | 10 | 0 |
| Mode SS | |||
|---|---|---|---|
| Quadrant | BADHDUFLAG | Total packets | Discarded packets |
| A | 0 | 122 | 0 |
| B | 0 | 122 | 0 |
| C | 0 | 122 | 0 |
| D | 0 | 122 | 0 |
| Mode M0 | |||
|---|---|---|---|
| Quadrant | BADHDUFLAG | Total packets | Discarded packets |
| A | 0 | 17983 | 171 |
| B | 0 | 18093 | 80 |
| C | 0 | 12507 | 43 |
| D | 0 | 21244 | 51 |
| Quadrant | Total seconds | Saturated seconds | Saturation percentage |
|---|---|---|---|
| A | 6080 | 414 | 6.809211% |
| B | 6097 | 702 | 11.513859% |
| C | 6100 | 20 | 0.327869% |
| D | 6106 | 1161 | 19.014085% |
Noise dominated data is calculated using 1-second bins in cleaned event files. If a bin has >2000 counts, and if more than 50% of those come from <1% of pixels, then it is considered to be noise-dominated and hence unusable.
| Quadrant | # 1 sec bins | Bins with >0 counts | Bins with >2000 counts | High rate bins dominated by noise | Noise dominated (total time) | Noise dominated (detector-on time) | Marked lightcurve |
|---|---|---|---|---|---|---|---|
| A | 7081 | 6117 | 311 | 311 | 4.39% | 5.08% | 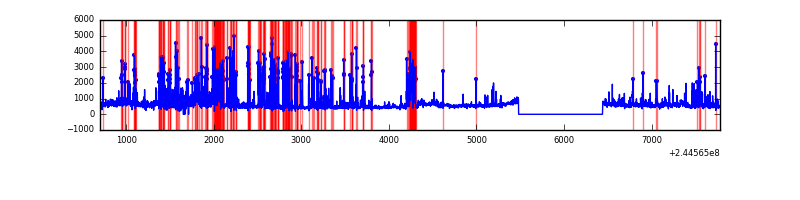 |
| B | 7081 | 6121 | 464 | 464 | 6.55% | 7.58% | 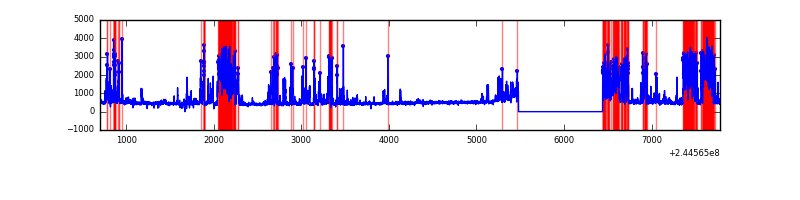 |
| C | 7081 | 6122 | 3 | 3 | 0.04% | 0.05% | 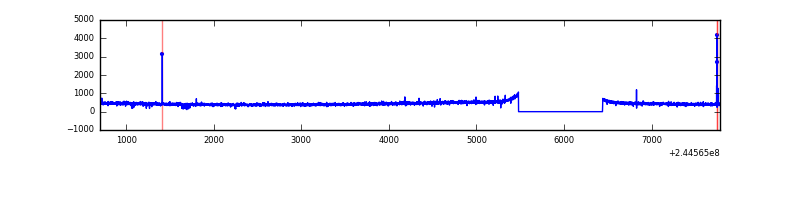 |
| D | 7081 | 6120 | 1035 | 1035 | 14.62% | 16.91% | 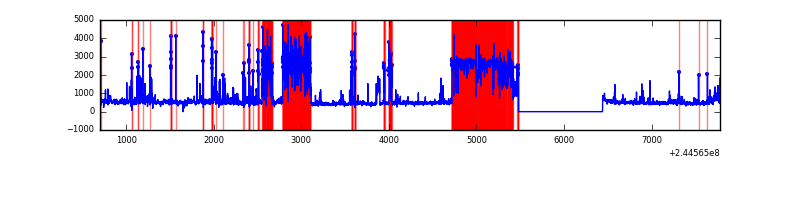 |
Top three noisy pixels from each quadrant. If the there are fewer than three noisy pixels in the level2.evt file, extra rows are filled as -1
| Pixel properties | Quadrant properties | ||||||
|---|---|---|---|---|---|---|---|
| Quadrant | DetID | PixID | Counts | Sigma | Mean | Median | Sigma |
| A | 8 | 5 | 1567912 | 10936.7 | 692 | 676 | 143.3 |
| A | 15 | 223 | 133384 | 926.08 | 692 | 676 | 143.3 |
| A | 8 | 15 | 125976 | 874.39 | 692 | 676 | 143.3 |
| B | 4 | 239 | 1966380 | 14972.77 | 682 | 667 | 131.3 |
| B | 0 | 213 | 15208 | 110.76 | 682 | 667 | 131.3 |
| B | 11 | 51 | 14490 | 105.29 | 682 | 667 | 131.3 |
| C | 14 | 234 | 13851 | 83.85 | 681 | 683 | 157.0 |
| C | 13 | 61 | 5105 | 28.16 | 681 | 683 | 157.0 |
| C | 0 | 207 | 4573 | 24.77 | 681 | 683 | 157.0 |
| D | 1 | 52 | 2761638 | 18605.81 | 604 | 584 | 148.4 |
| D | 8 | 195 | 263354 | 1770.72 | 604 | 584 | 148.4 |
| D | 2 | 14 | 141134 | 947.12 | 604 | 584 | 148.4 |
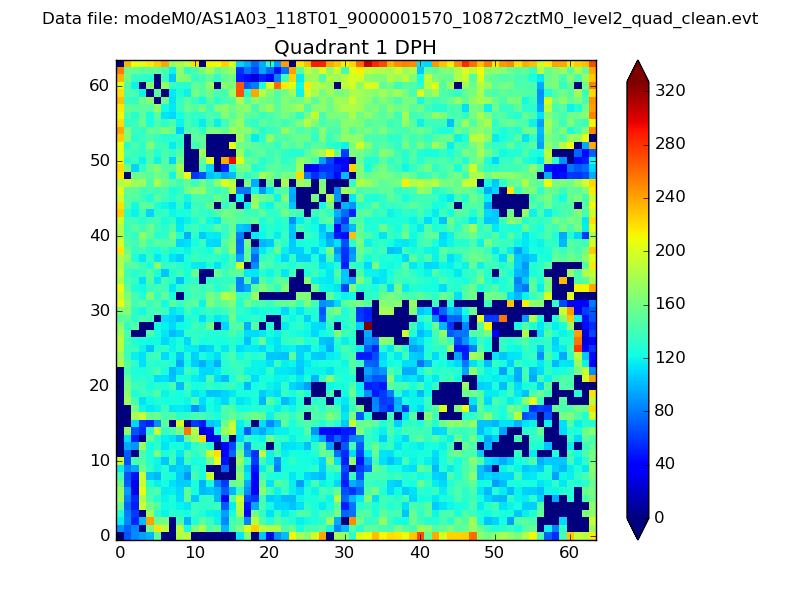
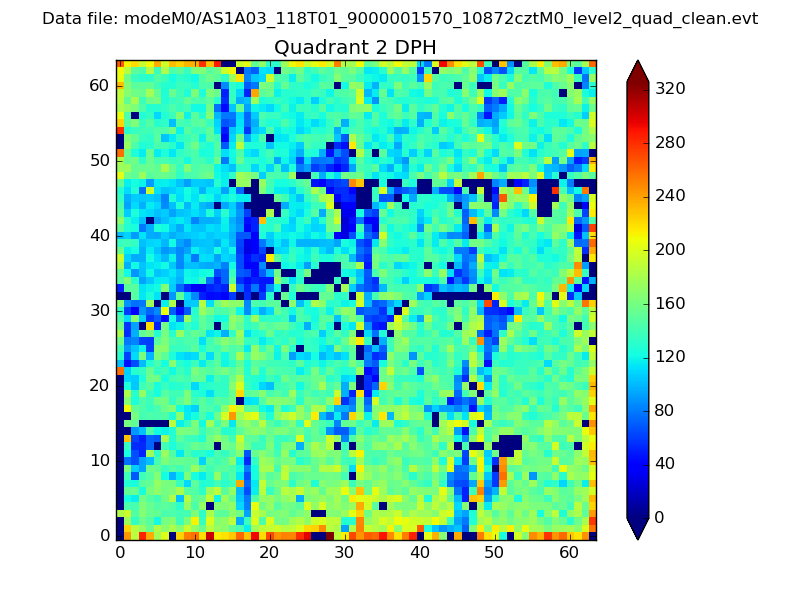
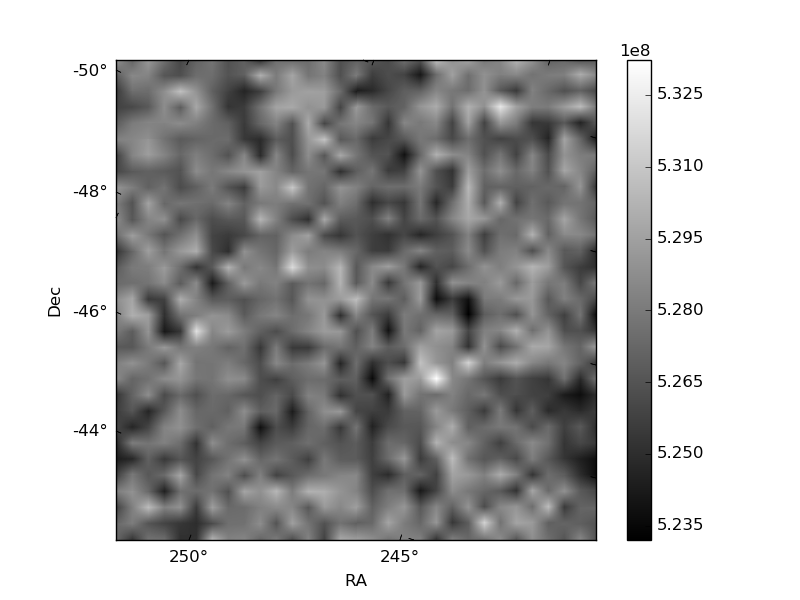
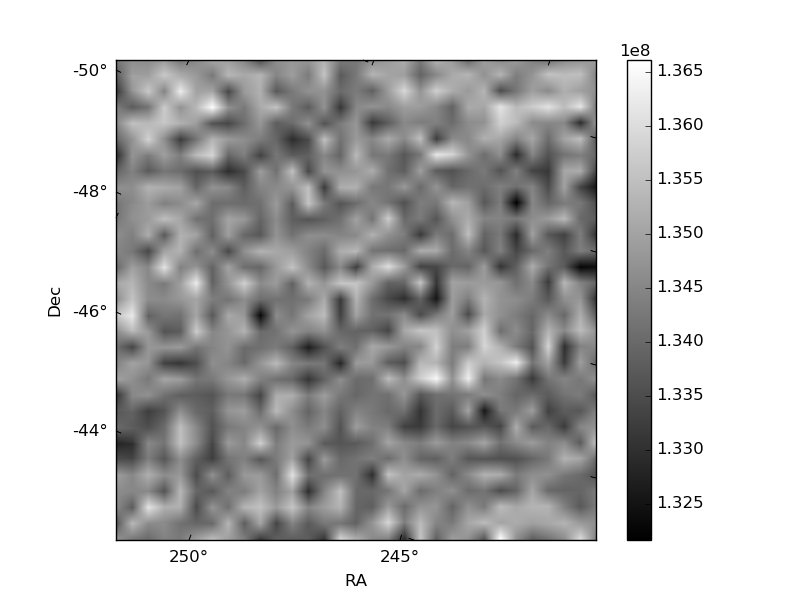
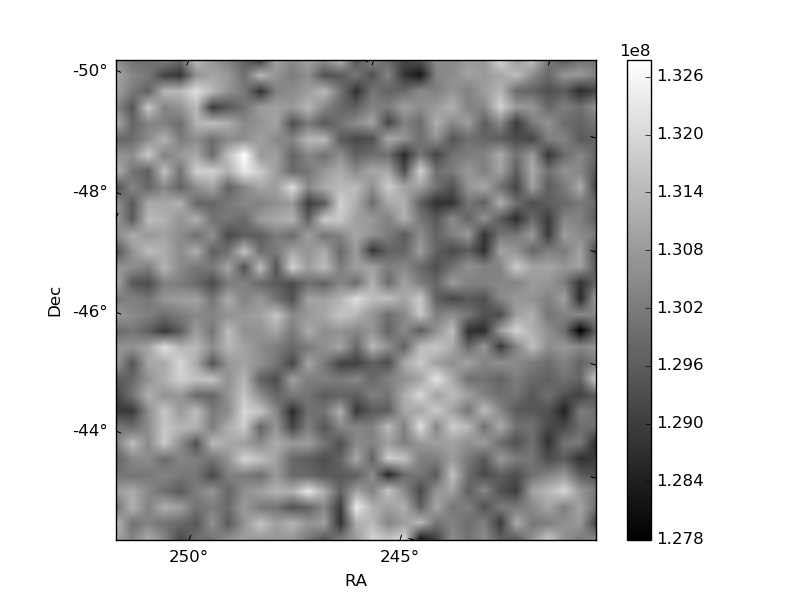
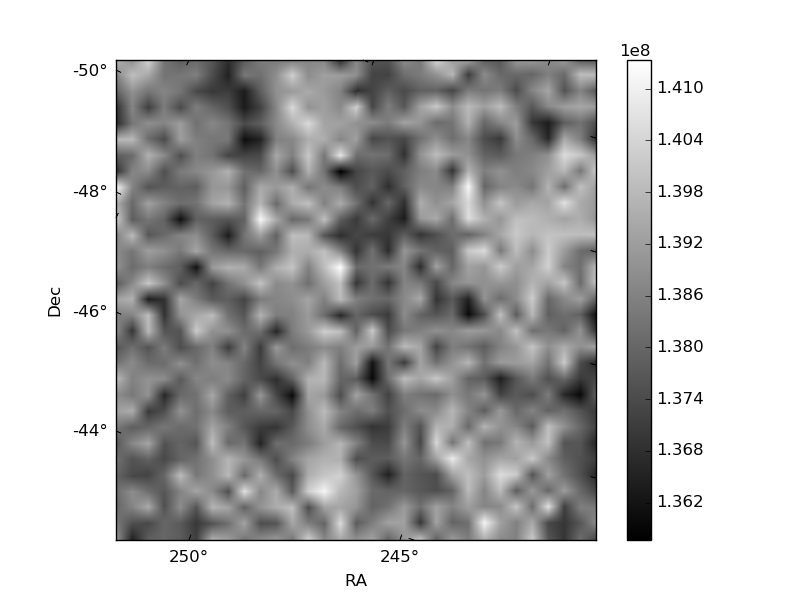
Histogram calculated using DETX and DETY for each event in the final _common_clean file
| Quadrant A |  |
 |
Quadrant B |
|---|---|---|---|
| Quadrant D | 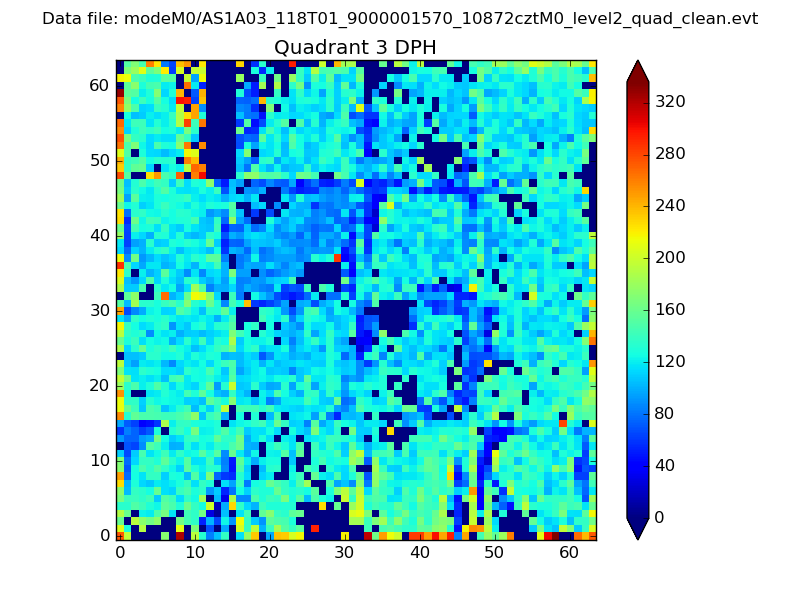 |
 |
Quadrant C |
| Plot type | Count rate plots | Images |
|---|---|---|
| Comparison with Poisson distribution Blue bars denote a histogram of data divided into 1 sec bins. Red curve is a Poisson curve with rate = median count rate of data. |
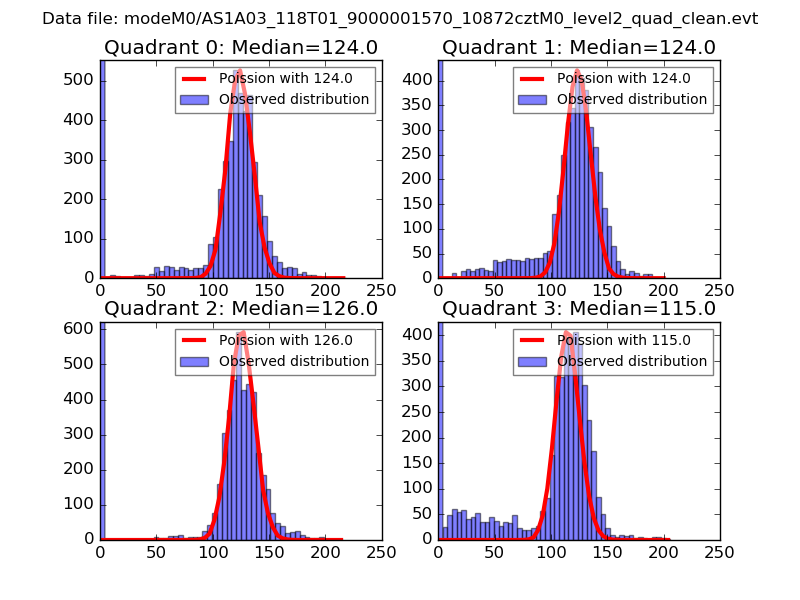 |
 |
| Quadrant-wise count rates Data is divided into 100 sec bins |
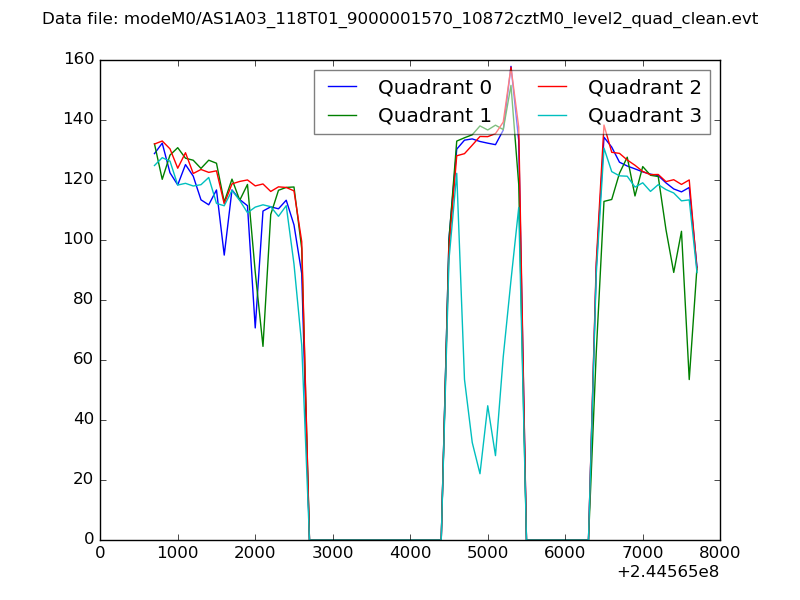 |
|
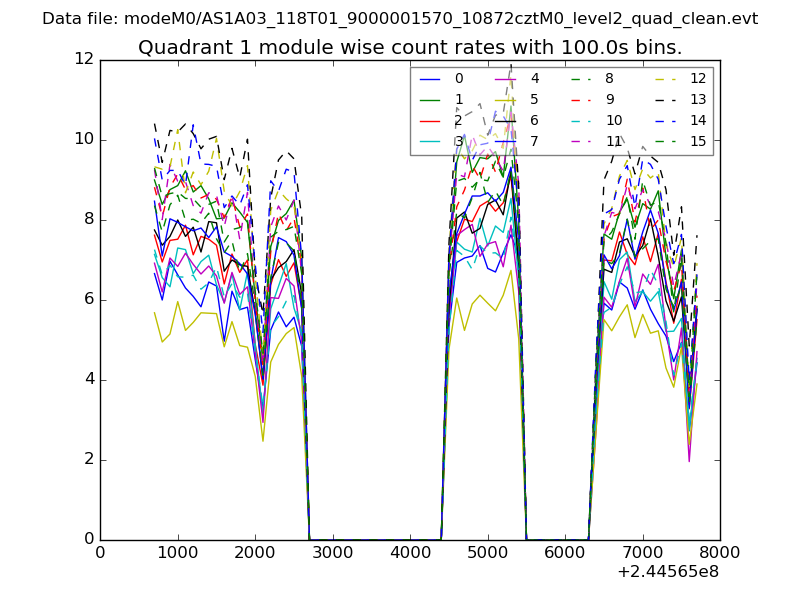
| Module-wise count rates for Quadrant A Data is divided into 100 sec bins |
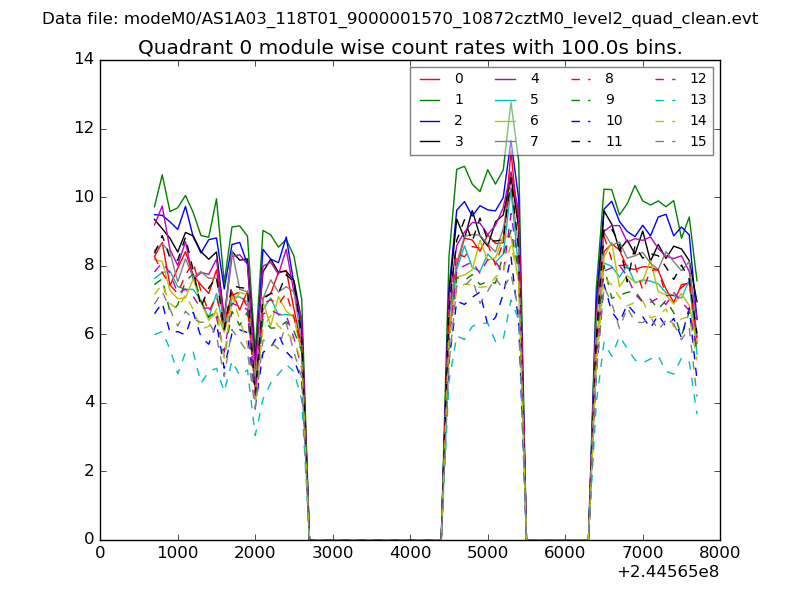 |
 |
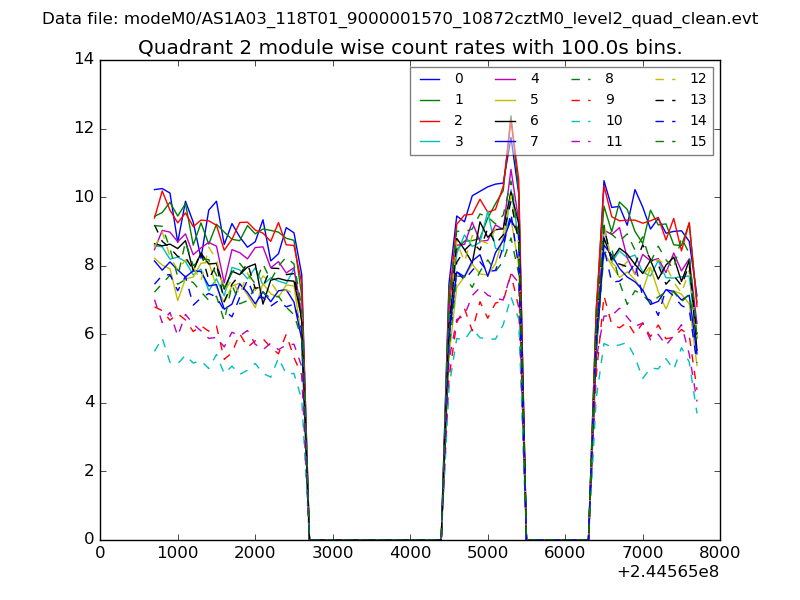
| Module-wise count rates for Quadrant B Data is divided into 100 sec bins |
 |
 |
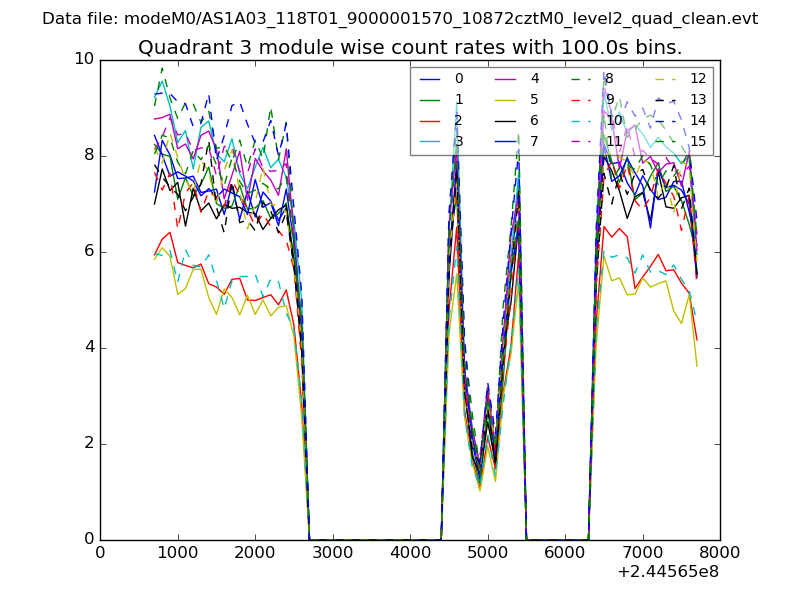
| Module-wise count rates for Quadrant C Data is divided into 100 sec bins |
 |
 |
| Module-wise count rates for Quadrant D Data is divided into 100 sec bins |
 |
 |
| Parameter | Plot |
|---|---|
| CZT HV Monitor | 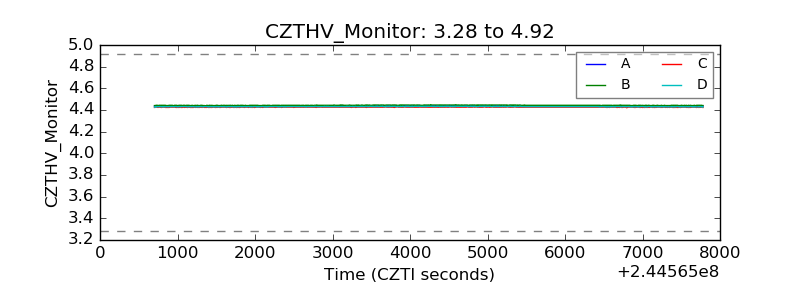 |
| D_VDD | 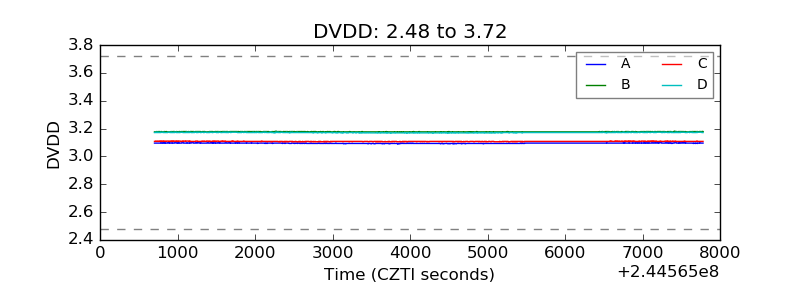 |
| Temperature 1 | 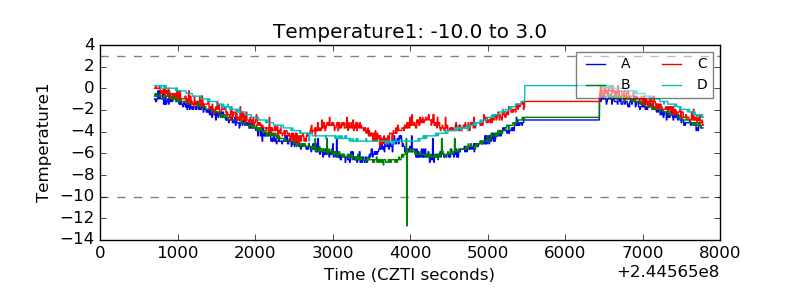 |
| Veto HV Monitor |  |
| Veto LLD | 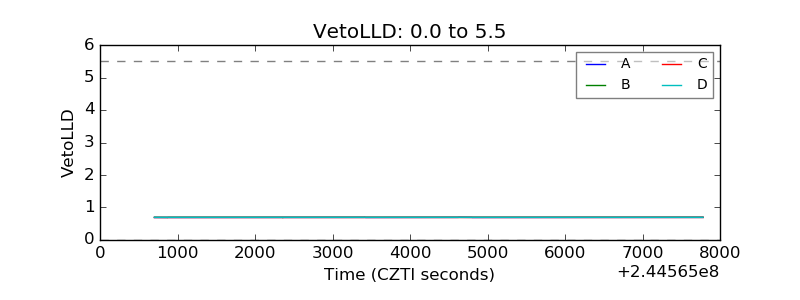 |
| Alpha Counter | 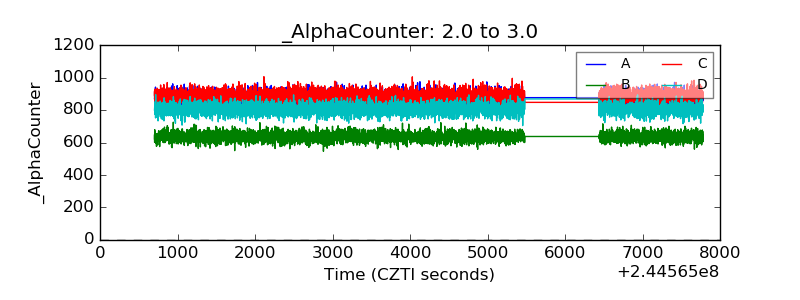 |
| _CPM_Rate | 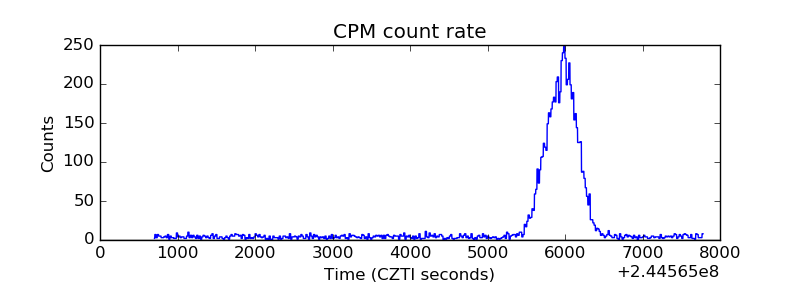 |
| CZT Counter | 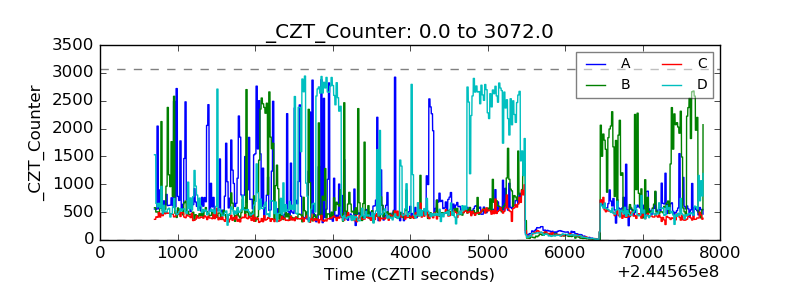 |
| +2.5 Volts monitor |  |
| +5 Volts monitor |  |
| _ROLL_ROT | 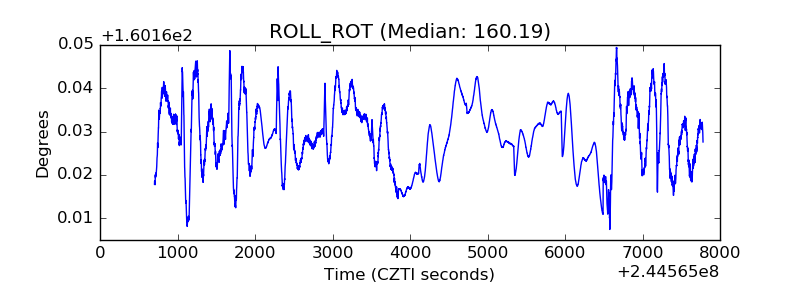 |
| _Roll_DEC | 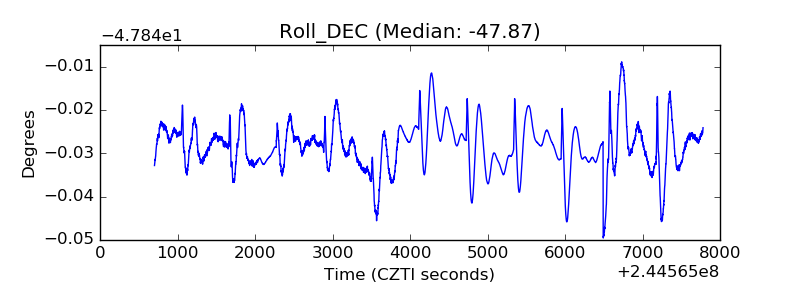 |
| _Roll_RA | 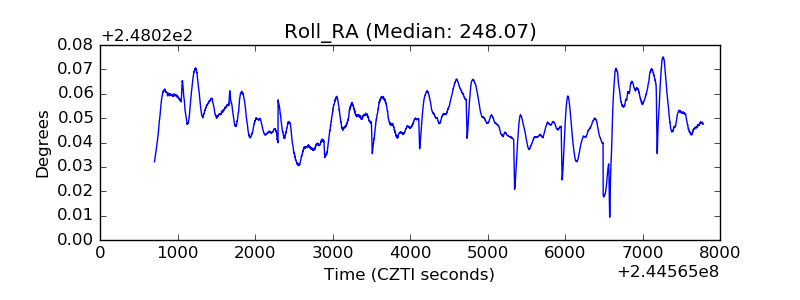 |
| Veto Counter | 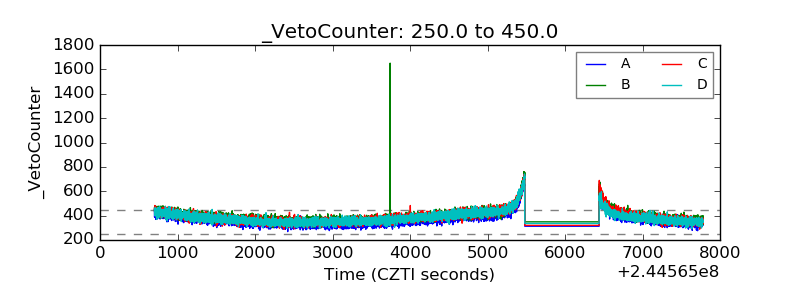 |