| Param | Original file | Final file |
|---|---|---|
| Filename | modeM0/AS1A03_118T01_9000001570_10874cztM0_level2.evt | modeM0/AS1A03_118T01_9000001570_10874cztM0_level2_quad_clean.evt |
| Size (bytes) | 205,776,000 | 22,613,760 |
| Size | 196.2 MB | 21.6 MB |
| Events in quadrant A | 1,507,536 | 123,760 |
| Events in quadrant B | 1,842,124 | 108,111 |
| Events in quadrant C | 1,123,482 | 129,462 |
| Events in quadrant D | 1,564,840 | 121,212 |
| Mode SS | |||
|---|---|---|---|
| Quadrant | BADHDUFLAG | Total packets | Discarded packets |
| A | 0 | 62 | 6 |
| B | 0 | 62 | 0 |
| C | 0 | 62 | 4 |
| D | 0 | 62 | 0 |
| Mode M0 | |||
|---|---|---|---|
| Quadrant | BADHDUFLAG | Total packets | Discarded packets |
| A | 0 | 7087 | 635 |
| B | 0 | 9002 | 1560 |
| C | 0 | 6059 | 325 |
| D | 0 | 7149 | 467 |
| Quadrant | Total seconds | Saturated seconds | Saturation percentage |
|---|---|---|---|
| A | 2818 | 42 | 1.490419% |
| B | 2736 | 214 | 7.821637% |
| C | 2856 | 5 | 0.175070% |
| D | 2823 | 60 | 2.125399% |
Noise dominated data is calculated using 1-second bins in cleaned event files. If a bin has >2000 counts, and if more than 50% of those come from <1% of pixels, then it is considered to be noise-dominated and hence unusable.
| Quadrant | # 1 sec bins | Bins with >0 counts | Bins with >2000 counts | High rate bins dominated by noise | Noise dominated (total time) | Noise dominated (detector-on time) | Marked lightcurve |
|---|---|---|---|---|---|---|---|
| A | 3016 | 2976 | 30 | 30 | 0.99% | 1.01% | 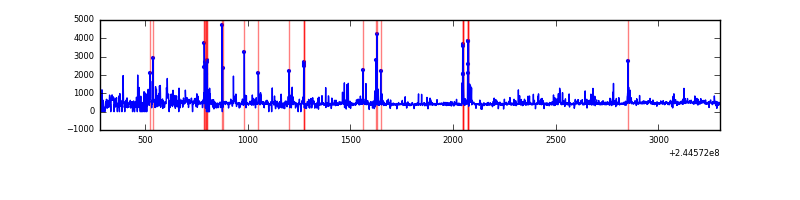 |
| B | 3018 | 2892 | 143 | 143 | 4.74% | 4.94% | 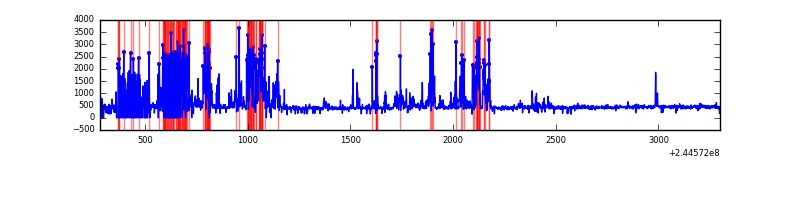 |
| C | 3017 | 2995 | 2 | 2 | 0.07% | 0.07% | 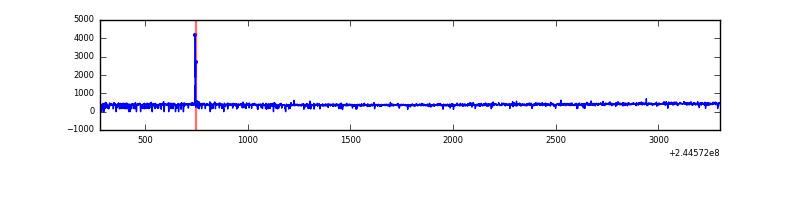 |
| D | 3018 | 2983 | 60 | 60 | 1.99% | 2.01% | 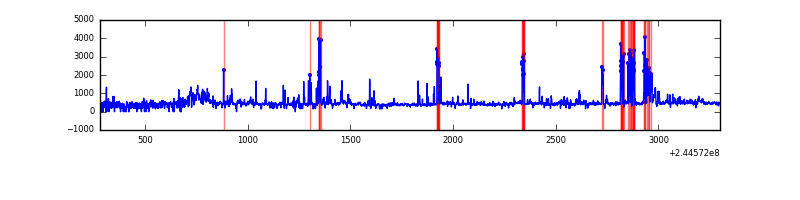 |
Top three noisy pixels from each quadrant. If the there are fewer than three noisy pixels in the level2.evt file, extra rows are filled as -1
| Pixel properties | Quadrant properties | ||||||
|---|---|---|---|---|---|---|---|
| Quadrant | DetID | PixID | Counts | Sigma | Mean | Median | Sigma |
| A | 8 | 5 | 274742 | 4532.3 | 290 | 284 | 60.6 |
| A | 8 | 15 | 60676 | 997.29 | 290 | 284 | 60.6 |
| A | 15 | 223 | 21760 | 354.65 | 290 | 284 | 60.6 |
| B | 4 | 239 | 735766 | 13376.93 | 279 | 273 | 55.0 |
| B | 0 | 214 | 6962 | 121.66 | 279 | 273 | 55.0 |
| B | 12 | 111 | 5537 | 95.74 | 279 | 273 | 55.0 |
| C | 14 | 234 | 10641 | 154.09 | 285 | 286 | 67.2 |
| C | 13 | 61 | 2175 | 28.11 | 285 | 286 | 67.2 |
| C | 8 | 222 | 1170 | 13.15 | 285 | 286 | 67.2 |
| D | 1 | 52 | 232861 | 3393.63 | 276 | 266 | 68.5 |
| D | 8 | 195 | 93026 | 1353.4 | 276 | 266 | 68.5 |
| D | 2 | 14 | 62909 | 913.98 | 276 | 266 | 68.5 |
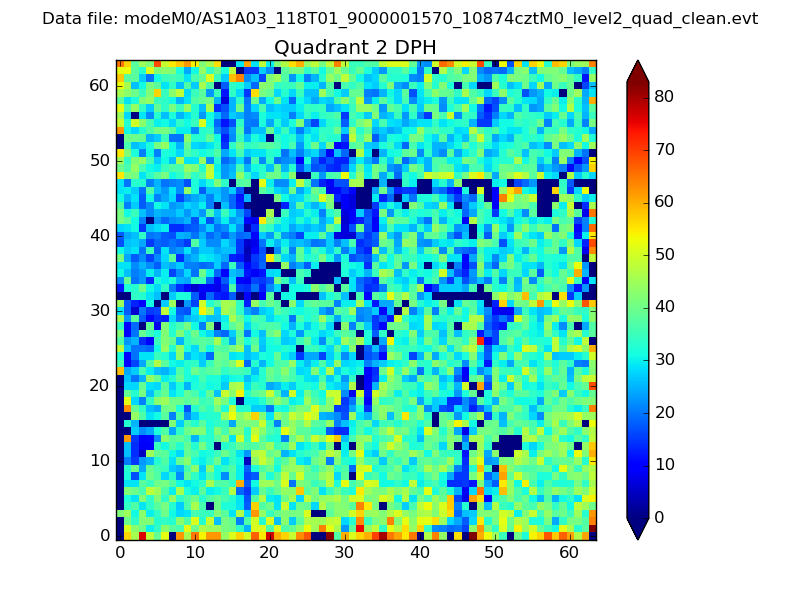
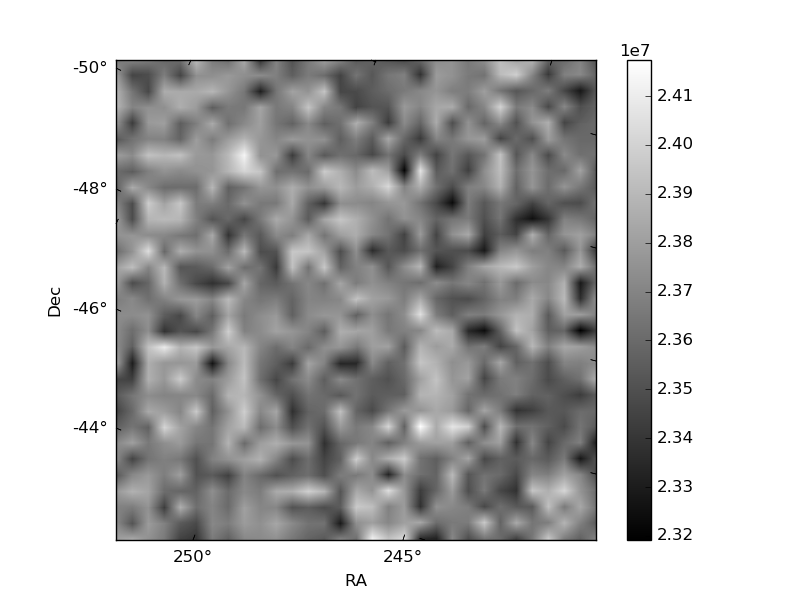
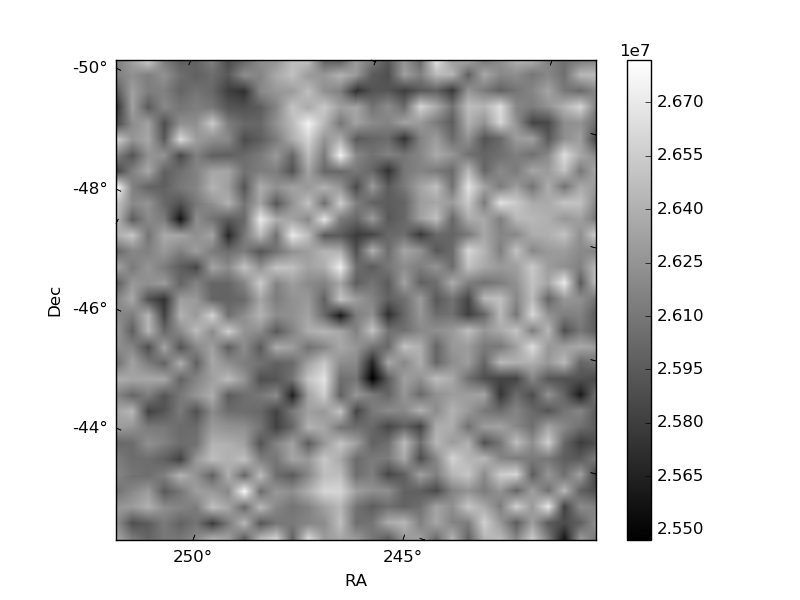
Histogram calculated using DETX and DETY for each event in the final _common_clean file
| Quadrant A | 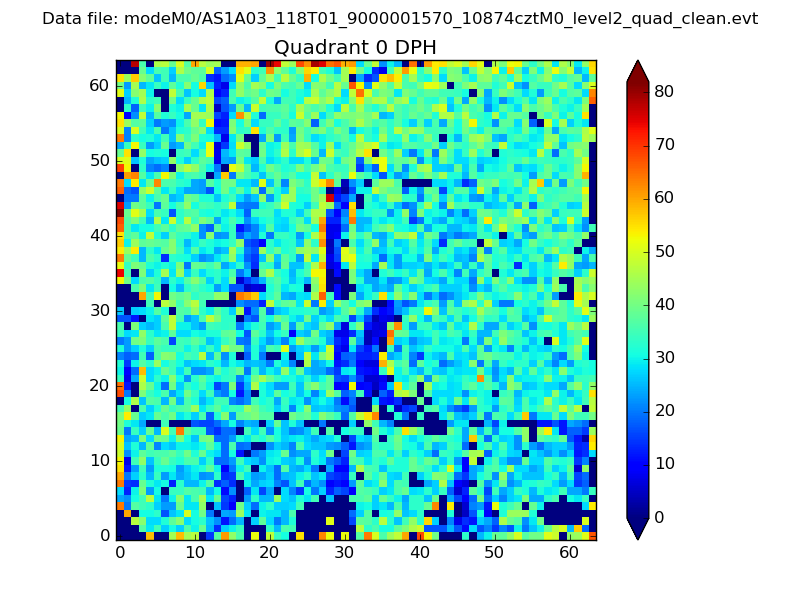 |
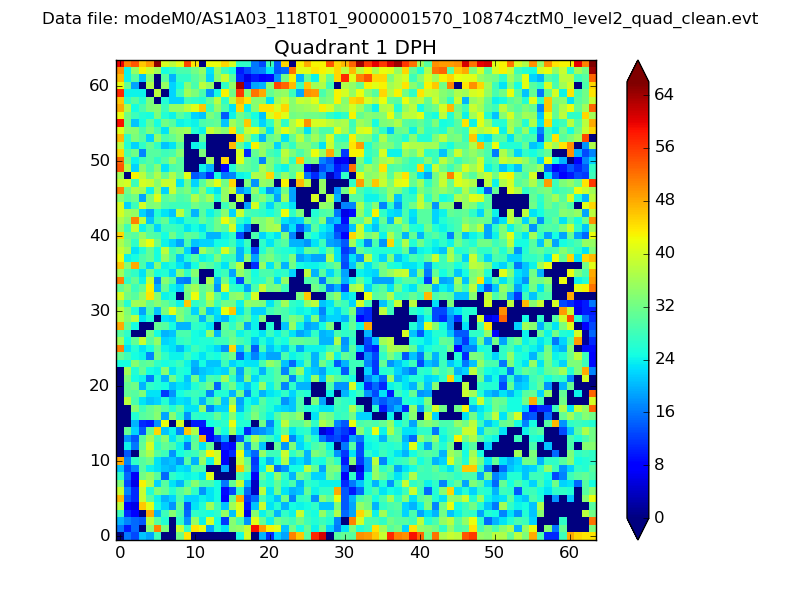 |
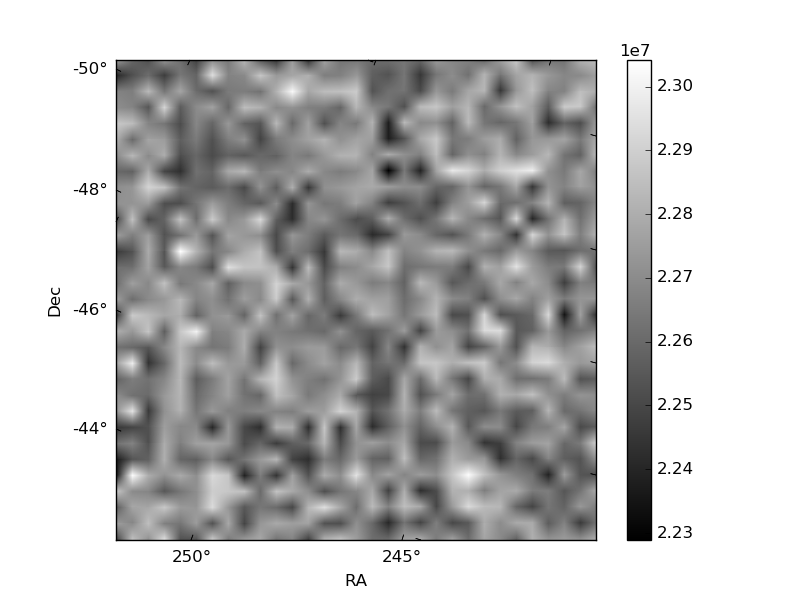
Quadrant B |
|---|---|---|---|
| Quadrant D | 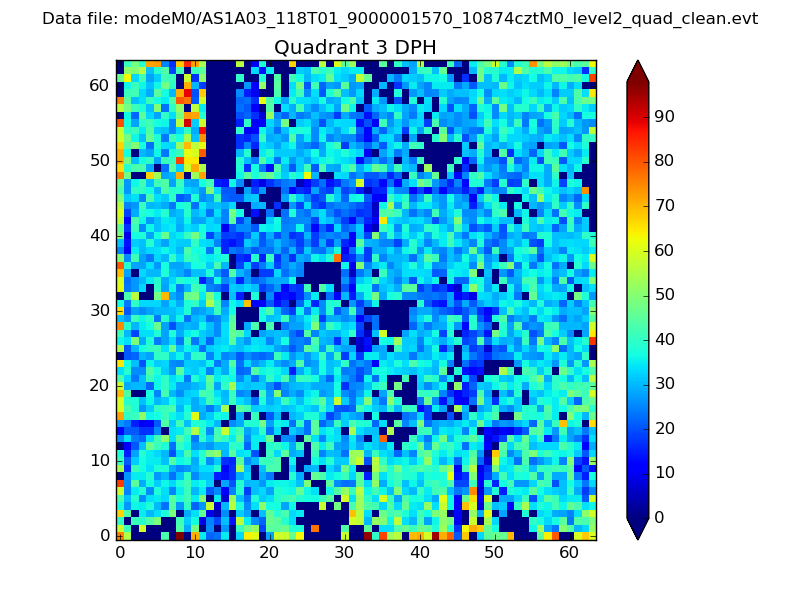 |
 |
Quadrant C |
| Plot type | Count rate plots | Images |
|---|---|---|
| Comparison with Poisson distribution Blue bars denote a histogram of data divided into 1 sec bins. Red curve is a Poisson curve with rate = median count rate of data. |
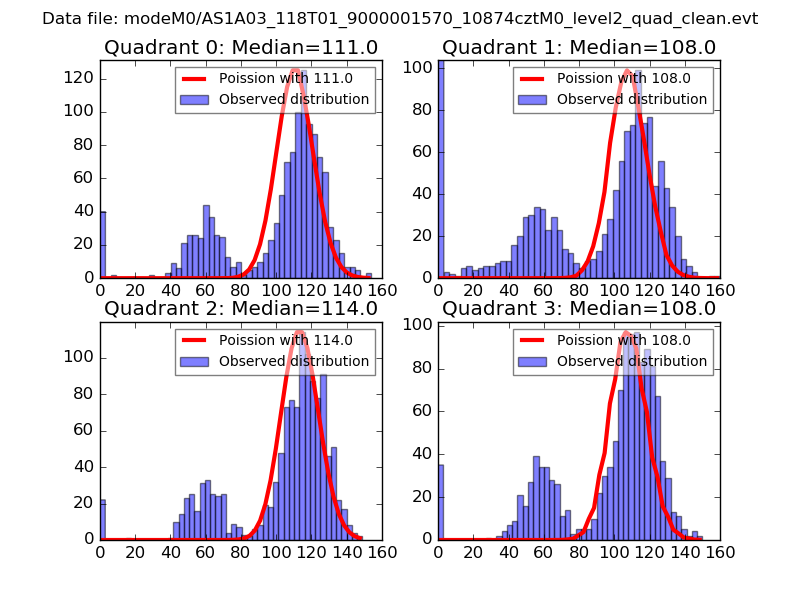 |
 |
| Quadrant-wise count rates Data is divided into 100 sec bins |
 |
|
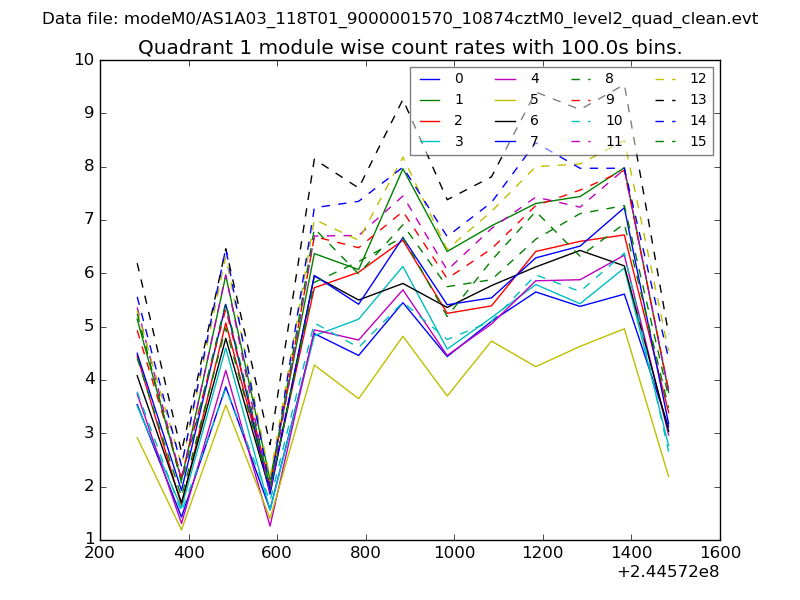
| Module-wise count rates for Quadrant A Data is divided into 100 sec bins |
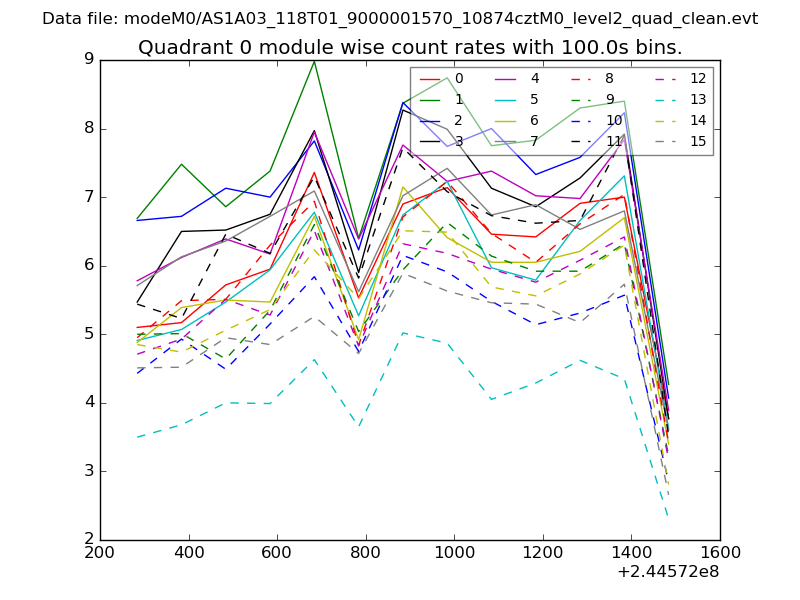 |
 |
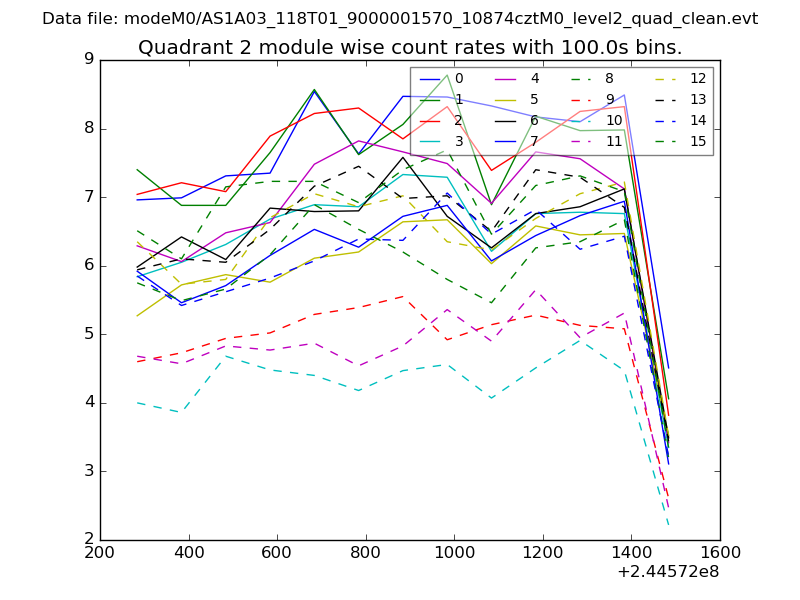
| Module-wise count rates for Quadrant B Data is divided into 100 sec bins |
 |
 |
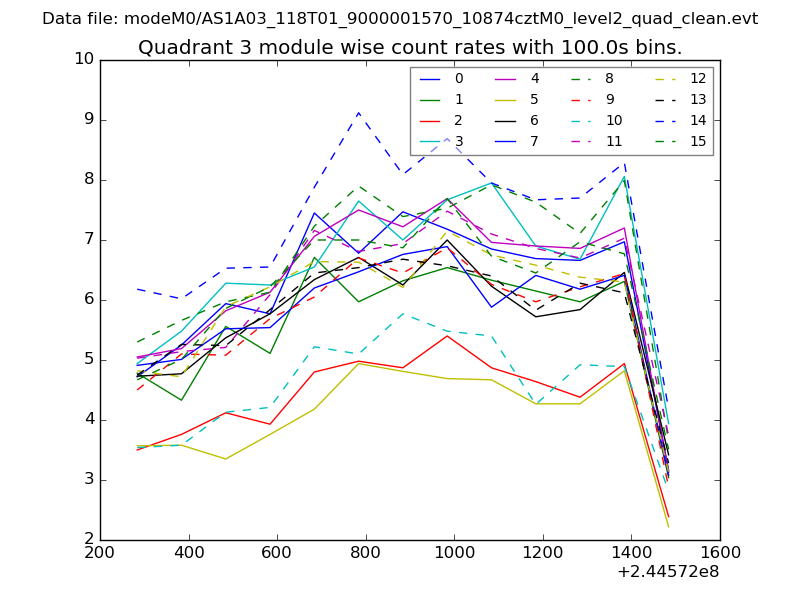
| Module-wise count rates for Quadrant C Data is divided into 100 sec bins |
 |
 |
| Module-wise count rates for Quadrant D Data is divided into 100 sec bins |
 |
 |
| Parameter | Plot |
|---|---|
| CZT HV Monitor | 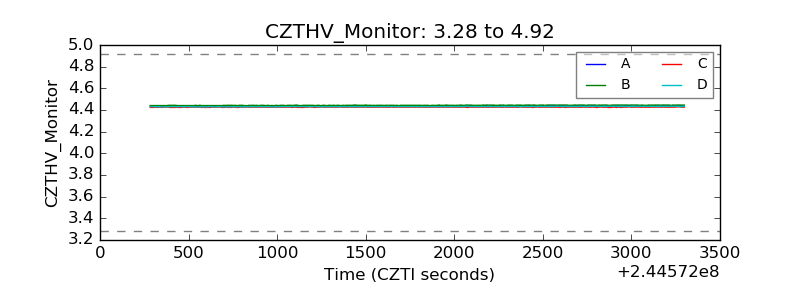 |
| D_VDD | 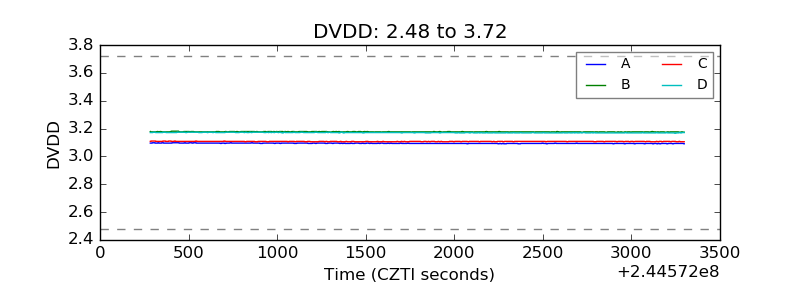 |
| Temperature 1 | 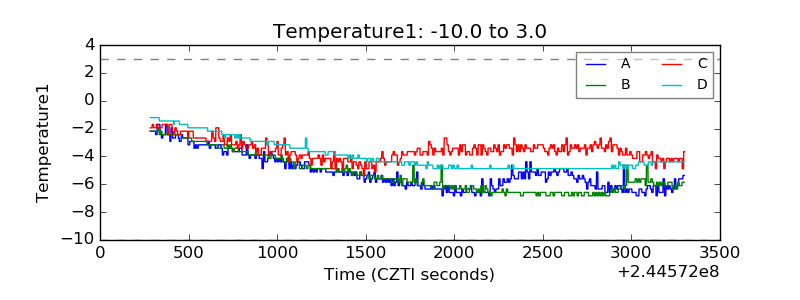 |
| Veto HV Monitor | 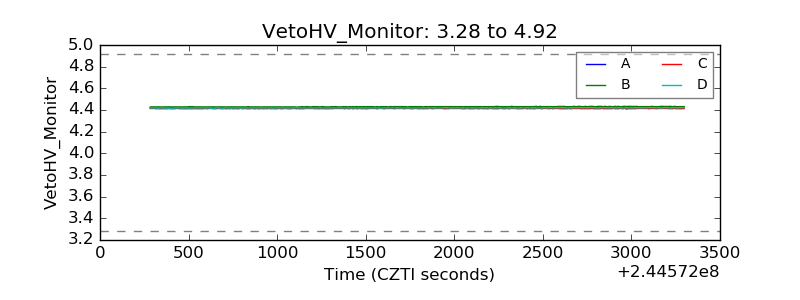 |
| Veto LLD | 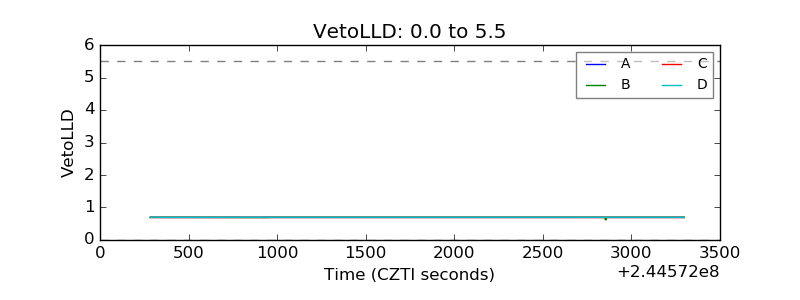 |
| Alpha Counter | 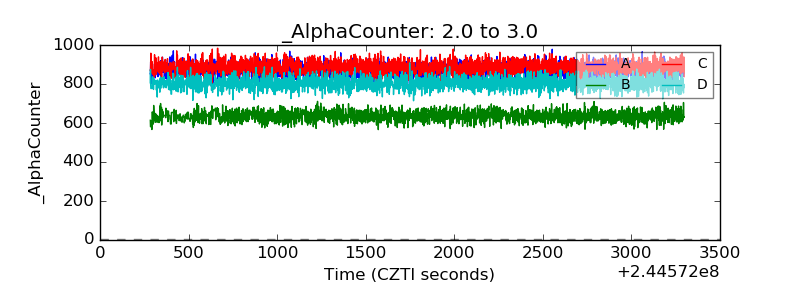 |
| _CPM_Rate | 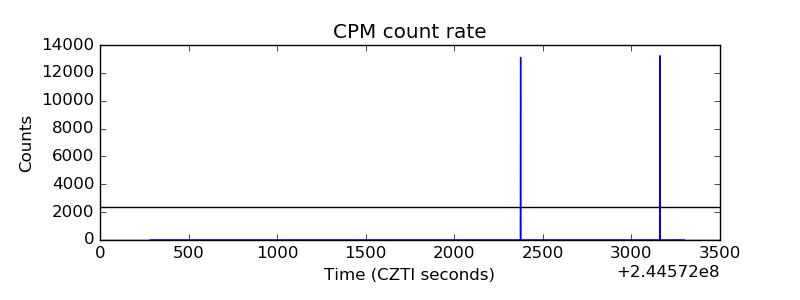 |
| CZT Counter |  |
| +2.5 Volts monitor |  |
| +5 Volts monitor |  |
| _ROLL_ROT | 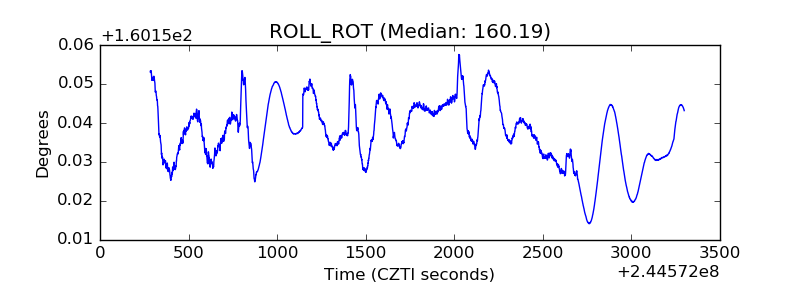 |
| _Roll_DEC | 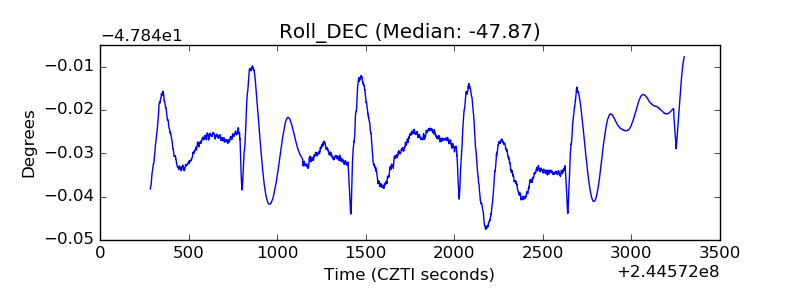 |
| _Roll_RA |  |
| Veto Counter | 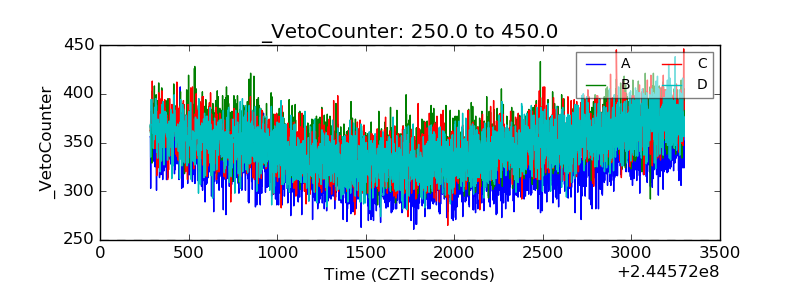 |