| Param | Original file | Final file |
|---|---|---|
| Filename | modeM0/AS1A03_118T01_9000001570_10875cztM0_level2.evt | modeM0/AS1A03_118T01_9000001570_10875cztM0_level2_quad_clean.evt |
| Size (bytes) | 230,068,800 | 25,407,360 |
| Size | 219.4 MB | 24.2 MB |
| Events in quadrant A | 1,654,591 | 141,881 |
| Events in quadrant B | 2,275,088 | 128,513 |
| Events in quadrant C | 1,174,874 | 145,177 |
| Events in quadrant D | 1,657,787 | 139,883 |
| Mode SS | |||
|---|---|---|---|
| Quadrant | BADHDUFLAG | Total packets | Discarded packets |
| A | 0 | 62 | 0 |
| B | 0 | 62 | 0 |
| C | 0 | 62 | 4 |
| D | 0 | 62 | 0 |
| Mode M0 | |||
|---|---|---|---|
| Quadrant | BADHDUFLAG | Total packets | Discarded packets |
| A | 0 | 7087 | 80 |
| B | 0 | 9003 | 96 |
| C | 0 | 6060 | 64 |
| D | 0 | 7149 | 82 |
| Quadrant | Total seconds | Saturated seconds | Saturation percentage |
|---|---|---|---|
| A | 2988 | 61 | 2.041499% |
| B | 2988 | 355 | 11.880857% |
| C | 2986 | 5 | 0.167448% |
| D | 2984 | 59 | 1.977212% |
Noise dominated data is calculated using 1-second bins in cleaned event files. If a bin has >2000 counts, and if more than 50% of those come from <1% of pixels, then it is considered to be noise-dominated and hence unusable.
| Quadrant | # 1 sec bins | Bins with >0 counts | Bins with >2000 counts | High rate bins dominated by noise | Noise dominated (total time) | Noise dominated (detector-on time) | Marked lightcurve |
|---|---|---|---|---|---|---|---|
| A | 3018 | 3017 | 47 | 47 | 1.56% | 1.56% | 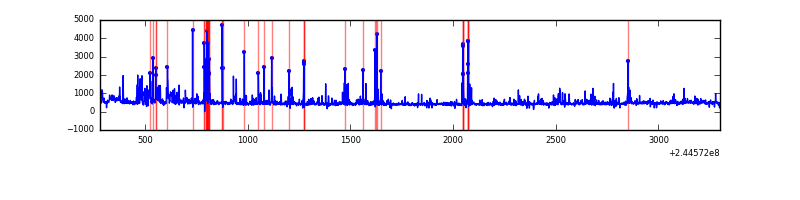 |
| B | 3018 | 3016 | 273 | 273 | 9.05% | 9.05% | 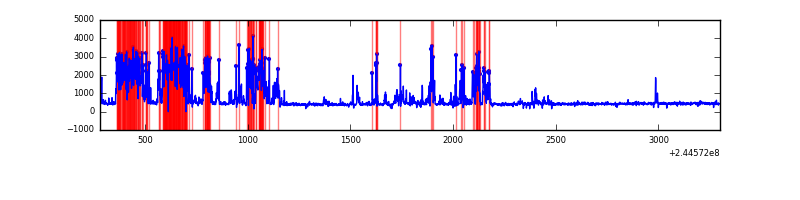 |
| C | 3018 | 3017 | 2 | 2 | 0.07% | 0.07% | 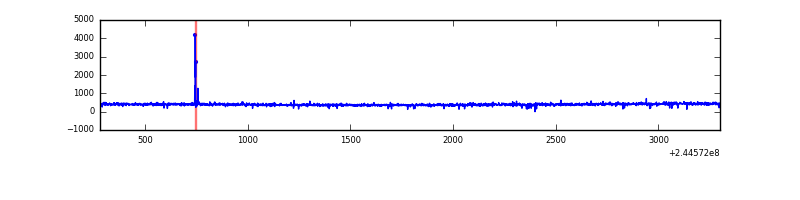 |
| D | 3018 | 3017 | 62 | 62 | 2.05% | 2.06% | 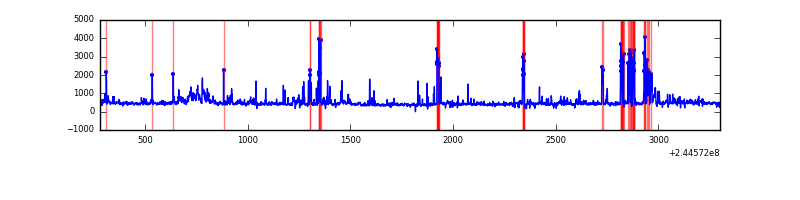 |
Top three noisy pixels from each quadrant. If the there are fewer than three noisy pixels in the level2.evt file, extra rows are filled as -1
| Pixel properties | Quadrant properties | ||||||
|---|---|---|---|---|---|---|---|
| Quadrant | DetID | PixID | Counts | Sigma | Mean | Median | Sigma |
| A | 8 | 5 | 343317 | 5345.62 | 307 | 301 | 64.2 |
| A | 8 | 15 | 68881 | 1068.76 | 307 | 301 | 64.2 |
| A | 15 | 223 | 23653 | 363.92 | 307 | 301 | 64.2 |
| B | 4 | 239 | 1081933 | 18340.58 | 301 | 294 | 59.0 |
| B | 0 | 214 | 7124 | 115.81 | 301 | 294 | 59.0 |
| B | 12 | 111 | 5915 | 95.31 | 301 | 294 | 59.0 |
| C | 14 | 234 | 11824 | 164.1 | 297 | 299 | 70.2 |
| C | 13 | 61 | 2286 | 28.29 | 297 | 299 | 70.2 |
| C | 8 | 222 | 1260 | 13.68 | 297 | 299 | 70.2 |
| D | 1 | 52 | 239156 | 3297.17 | 292 | 283 | 72.4 |
| D | 8 | 195 | 99139 | 1364.51 | 292 | 283 | 72.4 |
| D | 10 | 199 | 65169 | 895.62 | 292 | 283 | 72.4 |
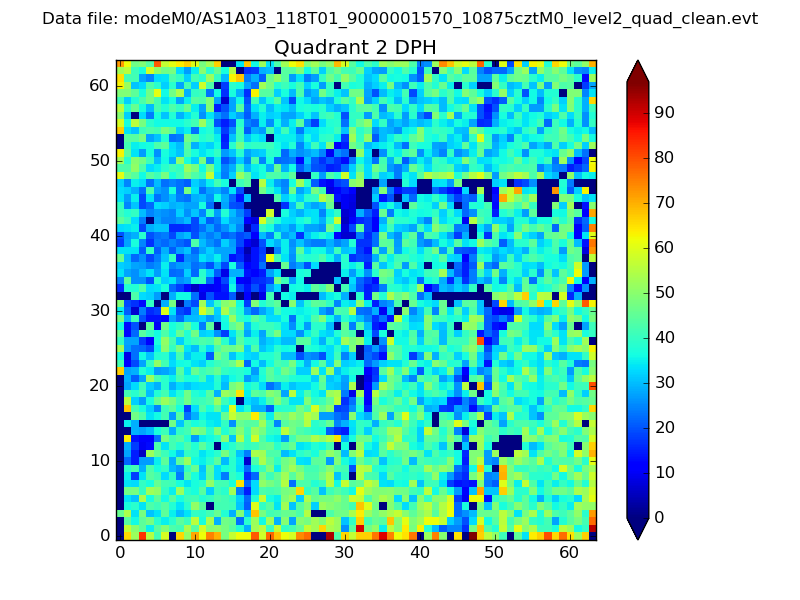
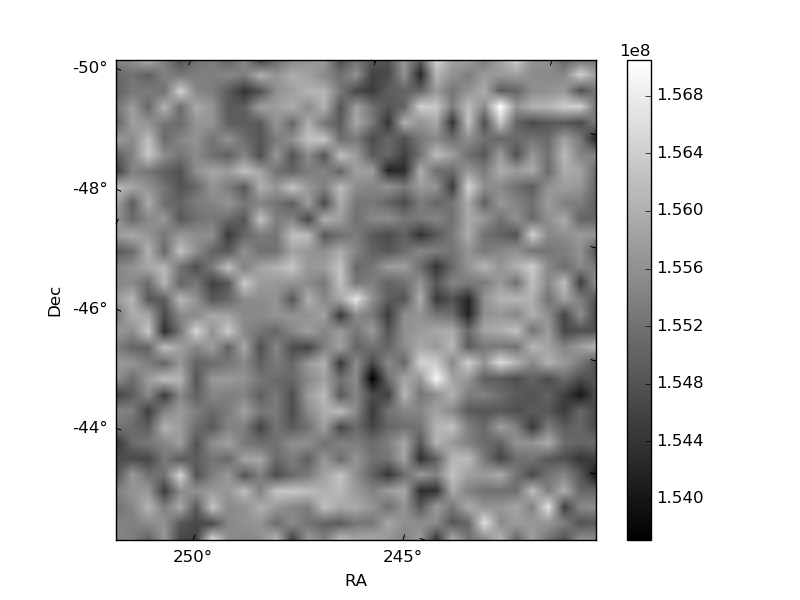
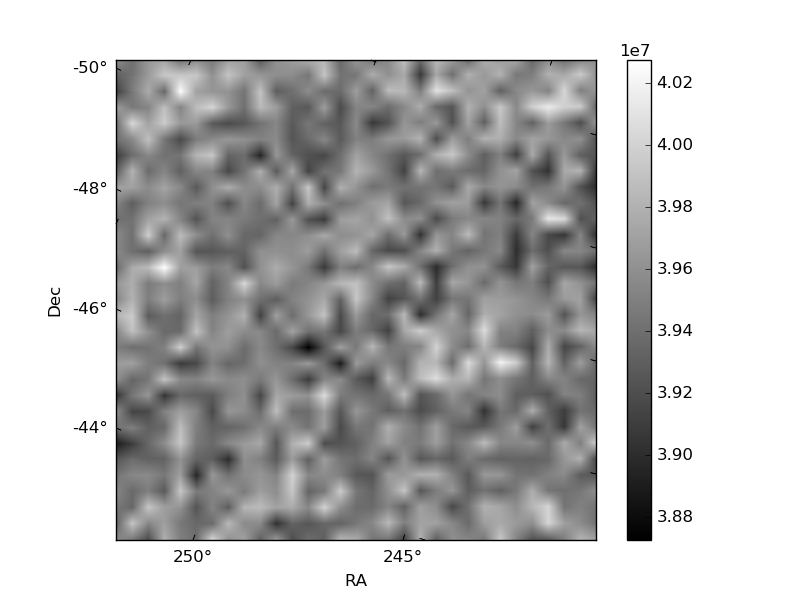
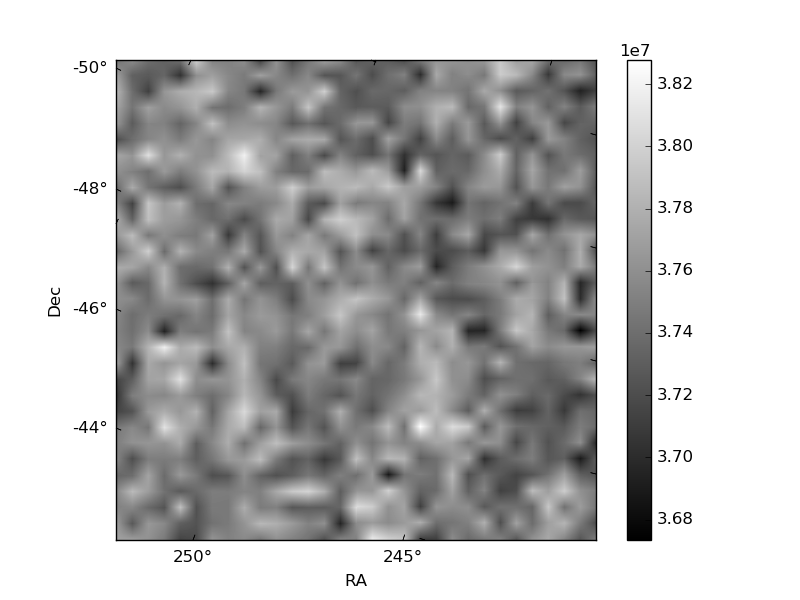
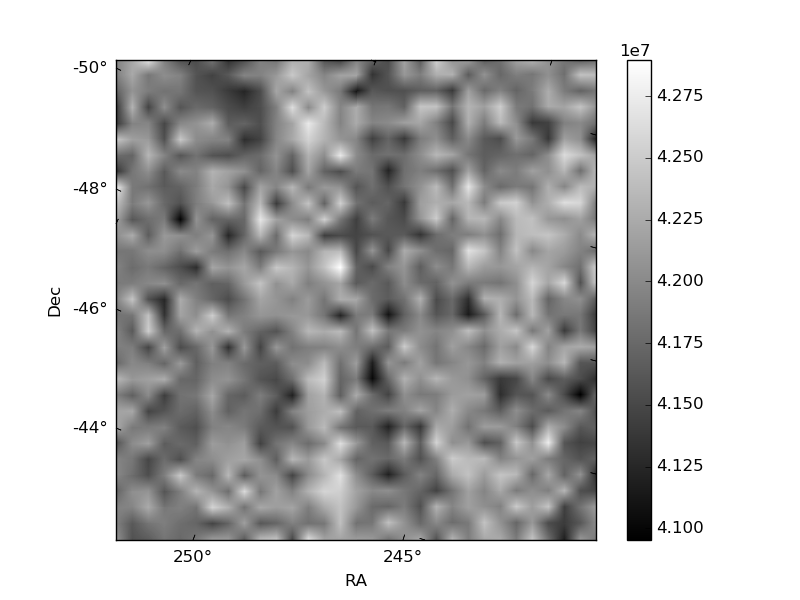
Histogram calculated using DETX and DETY for each event in the final _common_clean file
| Quadrant A | 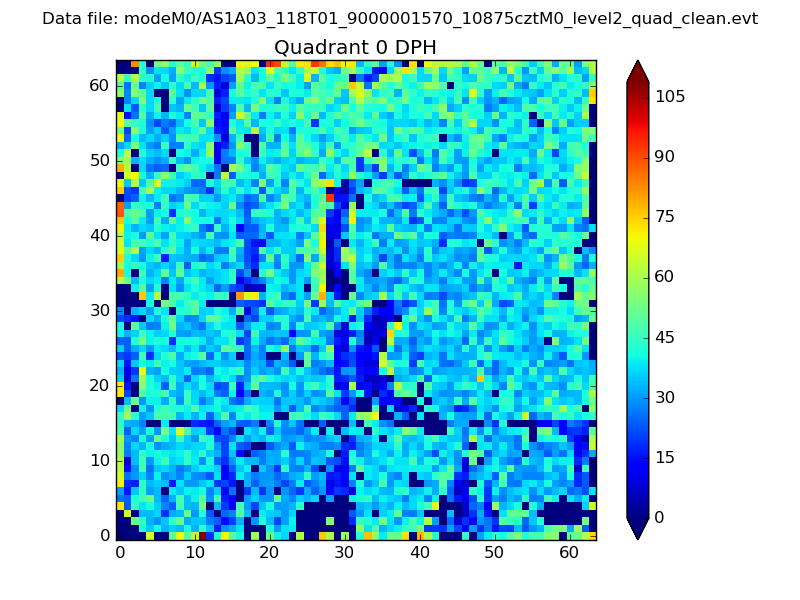 |
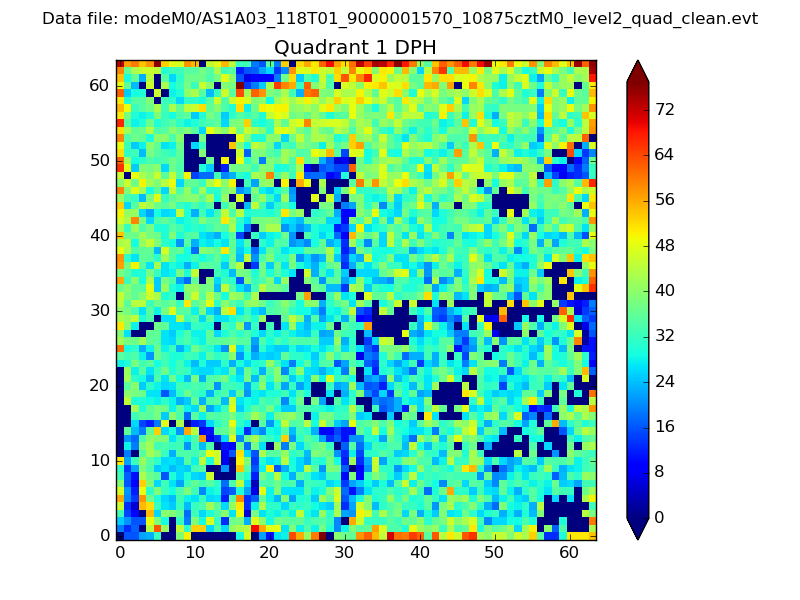 |
Quadrant B |
|---|---|---|---|
| Quadrant D | 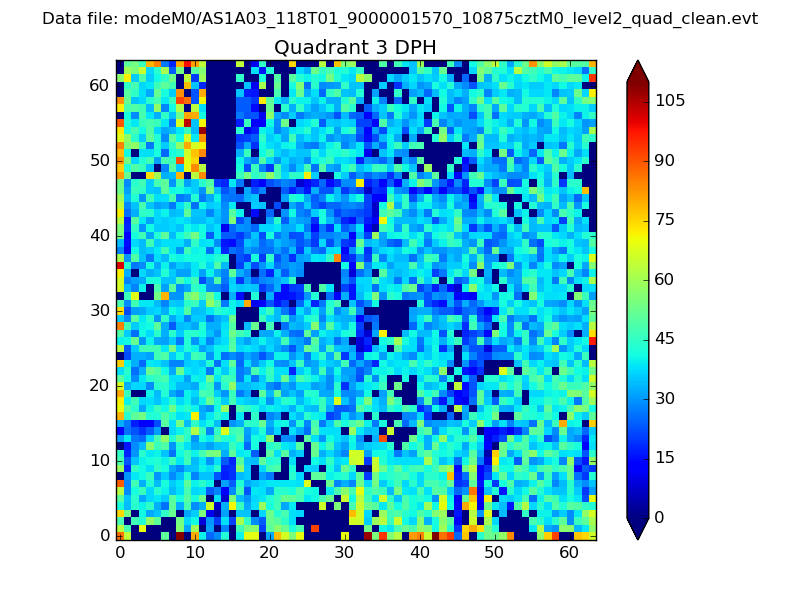 |
 |
Quadrant C |
| Plot type | Count rate plots | Images |
|---|---|---|
| Comparison with Poisson distribution Blue bars denote a histogram of data divided into 1 sec bins. Red curve is a Poisson curve with rate = median count rate of data. |
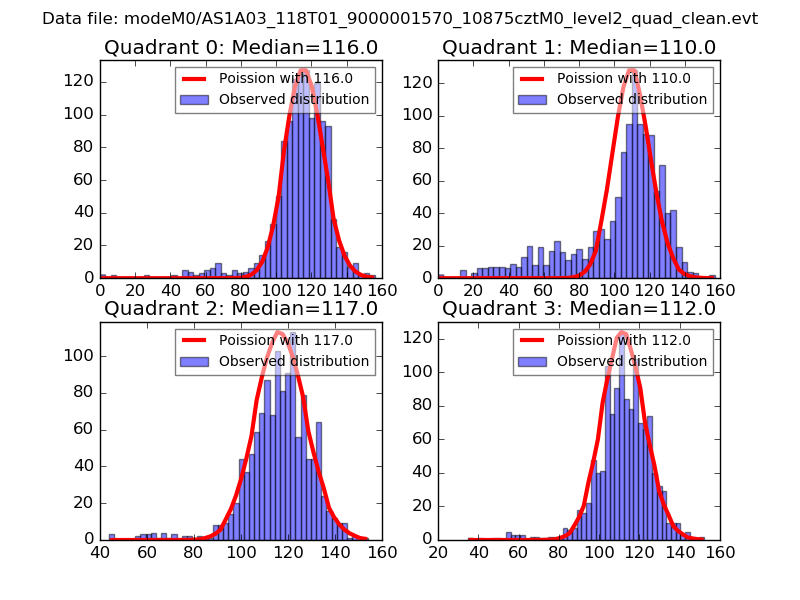 |
 |
| Quadrant-wise count rates Data is divided into 100 sec bins |
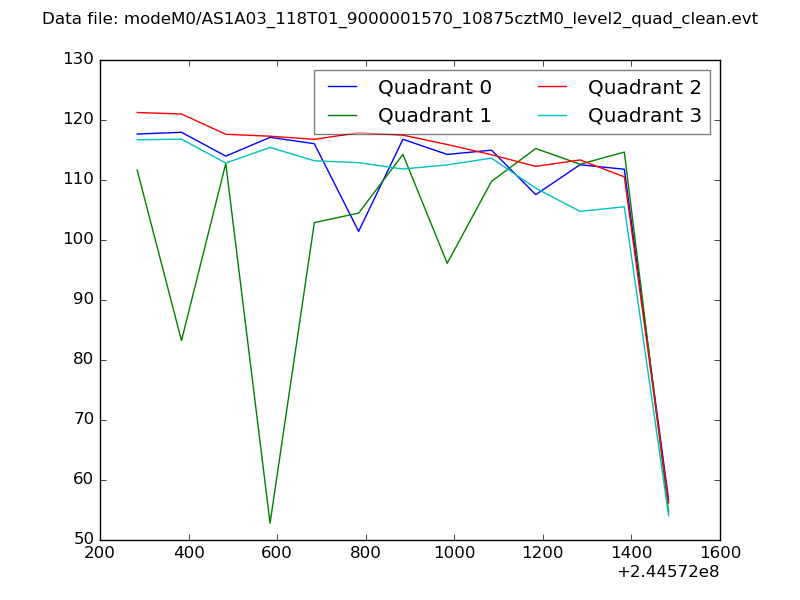 |
|
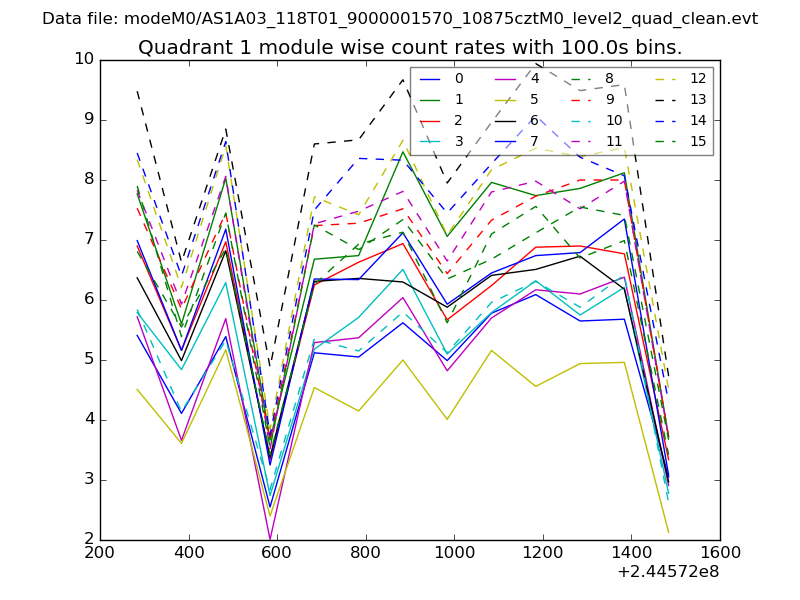
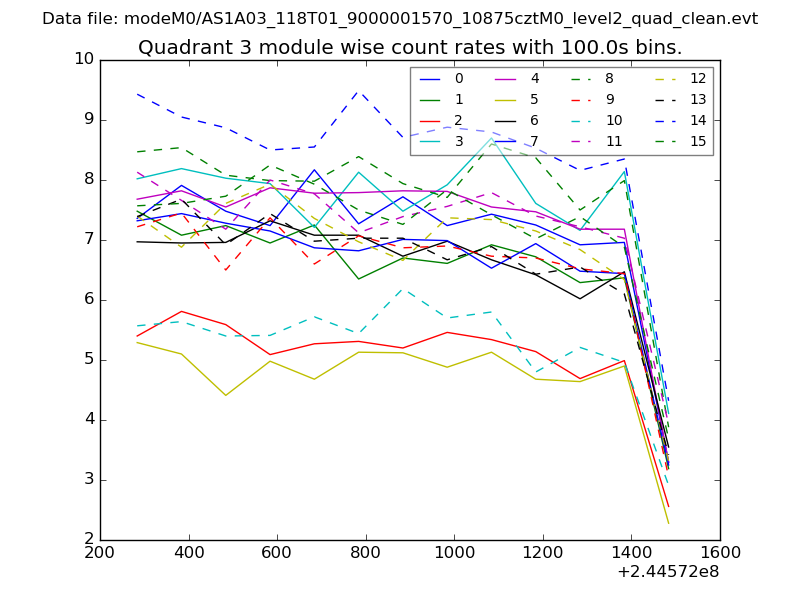
| Module-wise count rates for Quadrant A Data is divided into 100 sec bins |
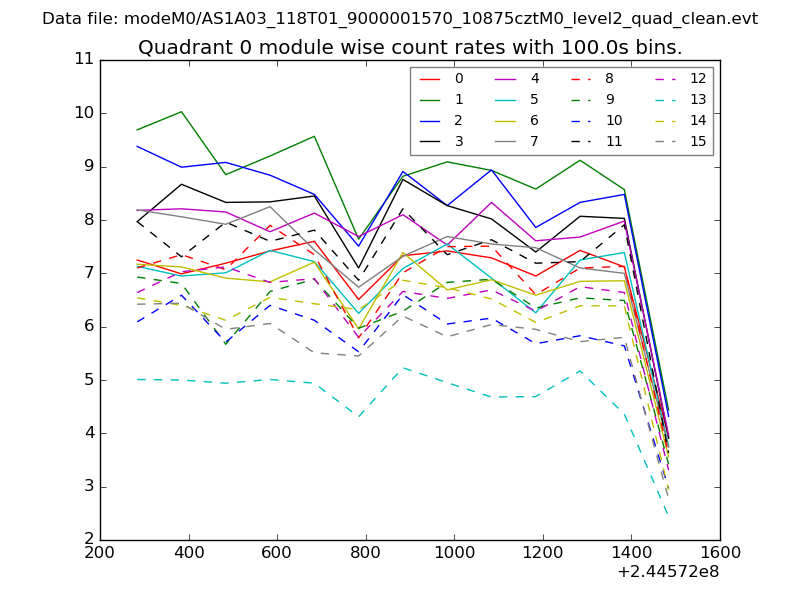 |
 |
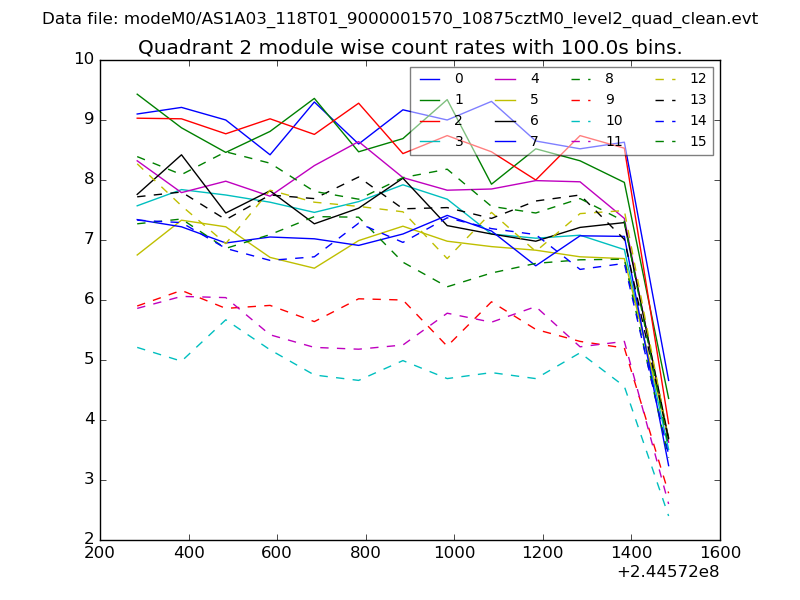
| Module-wise count rates for Quadrant B Data is divided into 100 sec bins |
 |
 |
| Module-wise count rates for Quadrant C Data is divided into 100 sec bins |
 |
 |
| Module-wise count rates for Quadrant D Data is divided into 100 sec bins |
 |
 |
| Parameter | Plot |
|---|---|
| CZT HV Monitor | 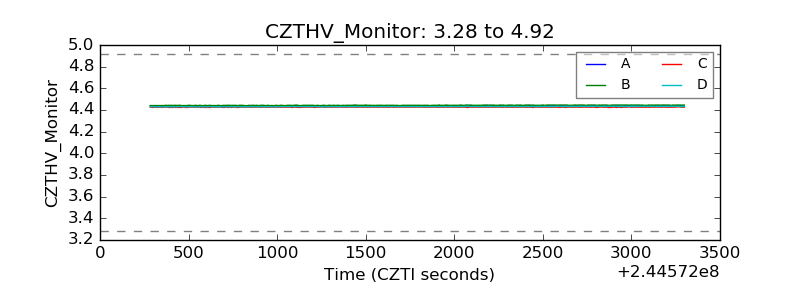 |
| D_VDD | 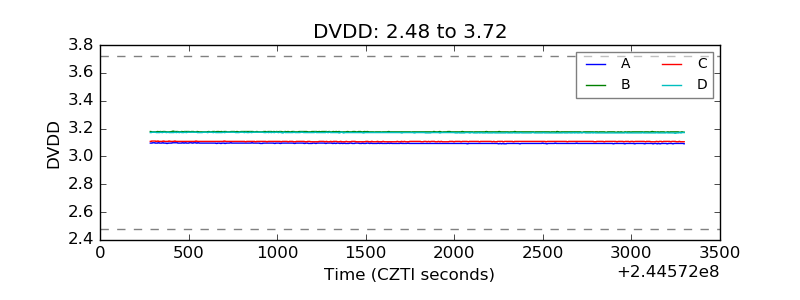 |
| Temperature 1 | 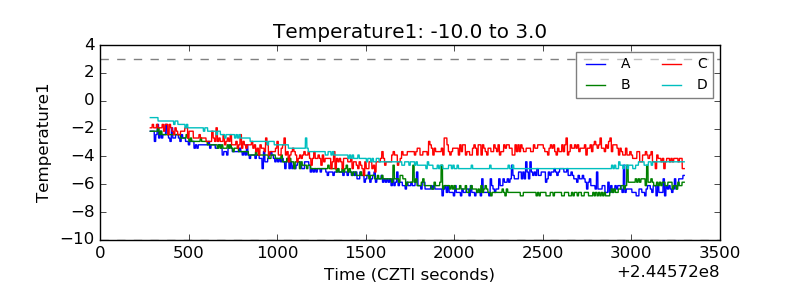 |
| Veto HV Monitor | 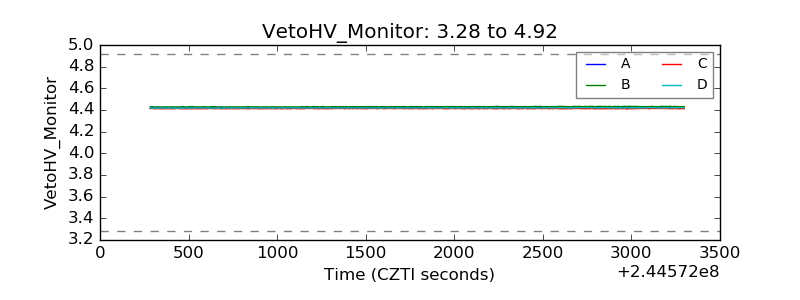 |
| Veto LLD | 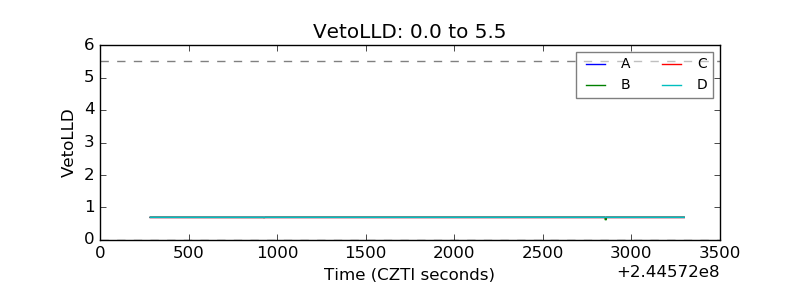 |
| Alpha Counter | 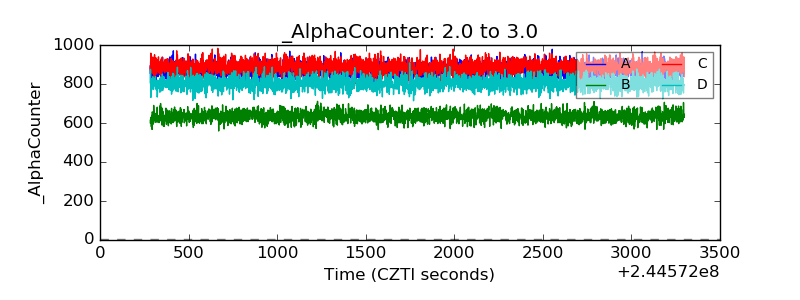 |
| _CPM_Rate | 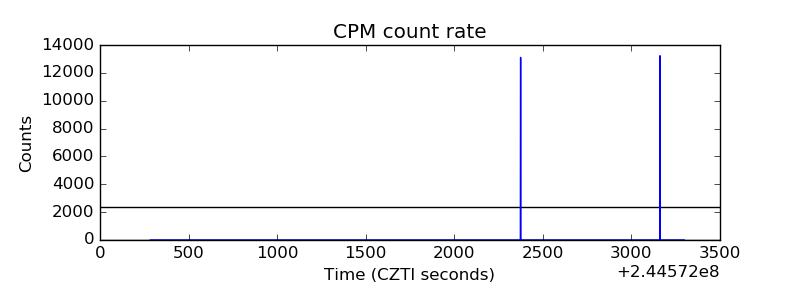 |
| CZT Counter | 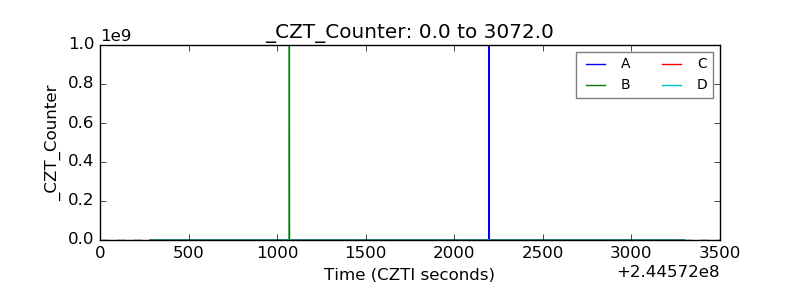 |
| +2.5 Volts monitor |  |
| +5 Volts monitor | 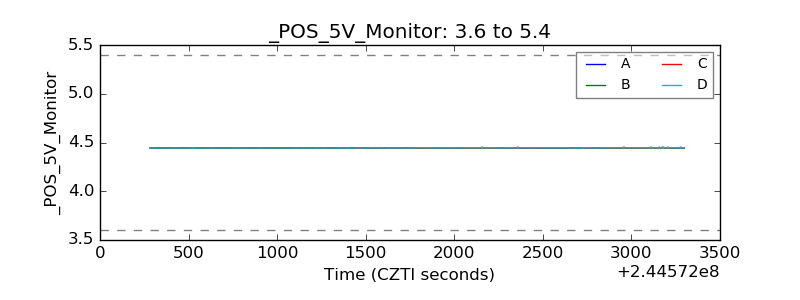 |
| _ROLL_ROT | 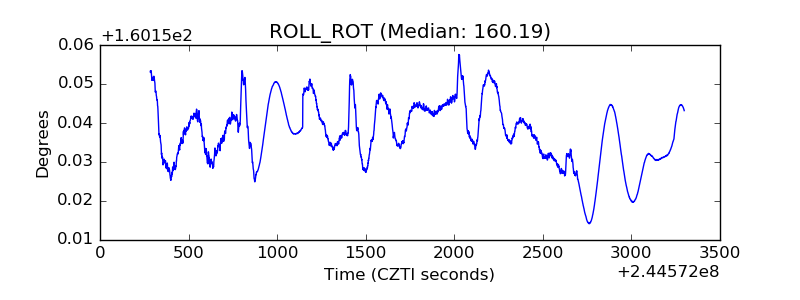 |
| _Roll_DEC | 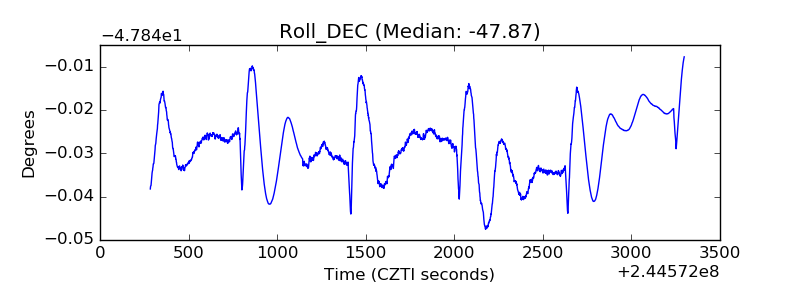 |
| _Roll_RA | 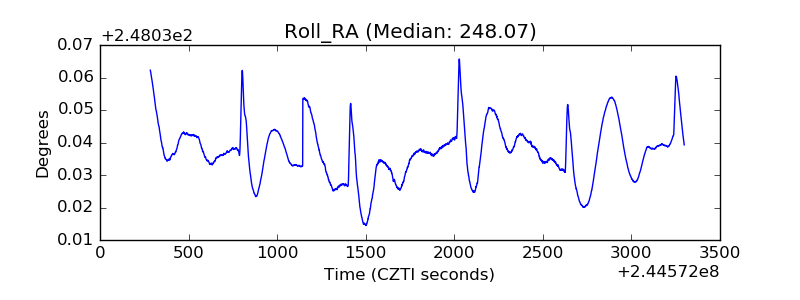 |
| Veto Counter | 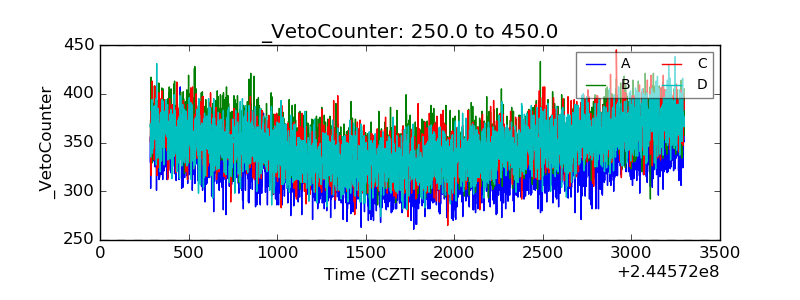 |