| Param | Original file | Final file |
|---|---|---|
| Filename | modeM0/AS1A04_130T01_9000001572cztM0_level2.fits | modeM0/AS1A04_130T01_9000001572cztM0_level2_quad_clean.evt |
| Size (bytes) | 312,082,560 | 283,694,400 |
| Size | 297.6 MB | 270.6 MB |
| Events in quadrant A | 1,842,268 | 1,608,208 |
| Events in quadrant B | 1,772,472 | 1,583,103 |
| Events in quadrant C | 1,888,426 | 1,597,845 |
| Events in quadrant D | 1,532,682 | 1,390,585 |
| Mode M9 | |||
|---|---|---|---|
| Quadrant | BADHDUFLAG | Total packets | Discarded packets |
| A | 0 | 37 | 0 |
| B | 0 | 35 | 0 |
| C | 0 | 35 | 0 |
| D | 0 | 36 | 0 |
| Mode SS | |||
|---|---|---|---|
| Quadrant | BADHDUFLAG | Total packets | Discarded packets |
| A | 0 | 716 | 0 |
| B | 0 | 732 | 0 |
| C | 0 | 732 | 0 |
| D | 0 | 714 | 0 |
| Mode M0 | |||
|---|---|---|---|
| Quadrant | BADHDUFLAG | Total packets | Discarded packets |
| A | 0 | 85299 | 0 |
| B | 0 | 96970 | 0 |
| C | 0 | 72129 | 0 |
| D | 0 | 102166 | 0 |
| Quadrant | Total seconds | Saturated seconds | Saturation percentage |
|---|---|---|---|
| A | 34926 | 1243 | 3.558953% |
| B | 35088 | 2580 | 7.352941% |
| C | 35427 | 137 | 0.386711% |
| D | 34771 | 2798 | 8.046936% |
Noise dominated data is calculated using 1-second bins in cleaned event files. If a bin has >2000 counts, and if more than 50% of those come from <1% of pixels, then it is considered to be noise-dominated and hence unusable.
| Quadrant | # 1 sec bins | Bins with >0 counts | Bins with >2000 counts | High rate bins dominated by noise | Noise dominated (total time) | Noise dominated (detector-on time) | Marked lightcurve |
|---|---|---|---|---|---|---|---|
| A | 41679 | 36403 | 0 | 0 | 0.00% | 0.00% |  |
| B | 41681 | 36554 | 0 | 0 | 0.00% | 0.00% |  |
| C | 42163 | 36903 | 0 | 0 | 0.00% | 0.00% |  |
| D | 42159 | 36007 | 0 | 0 | 0.00% | 0.00% |  |
Top three noisy pixels from each quadrant. If the there are fewer than three noisy pixels in the level2.evt file, extra rows are filled as -1
| Pixel properties | Quadrant properties | ||||||
|---|---|---|---|---|---|---|---|
| Quadrant | DetID | PixID | Counts | Sigma | Mean | Median | Sigma |
| A | 0 | 29 | 1739 | 10.51 | 480 | 446 | 123.0 |
| A | 7 | 110 | 1499 | 8.56 | 480 | 446 | 123.0 |
| A | 9 | 19 | 1420 | 7.92 | 480 | 446 | 123.0 |
| B | 2 | 9 | 1480 | 10.72 | 467 | 443 | 96.7 |
| B | 2 | 8 | 1201 | 7.83 | 467 | 443 | 96.7 |
| B | 14 | 254 | 1175 | 7.56 | 467 | 443 | 96.7 |
| C | 1 | 80 | 1403 | 7.13 | 498 | 460 | 132.3 |
| C | 12 | 241 | 1373 | 6.9 | 498 | 460 | 132.3 |
| C | 1 | 81 | 1327 | 6.55 | 498 | 460 | 132.3 |
| D | 3 | 14 | 1118 | 6.03 | 437 | 397 | 119.7 |
| D | 7 | 3 | 1109 | 5.95 | 437 | 397 | 119.7 |
| D | 6 | 231 | 1101 | 5.88 | 437 | 397 | 119.7 |
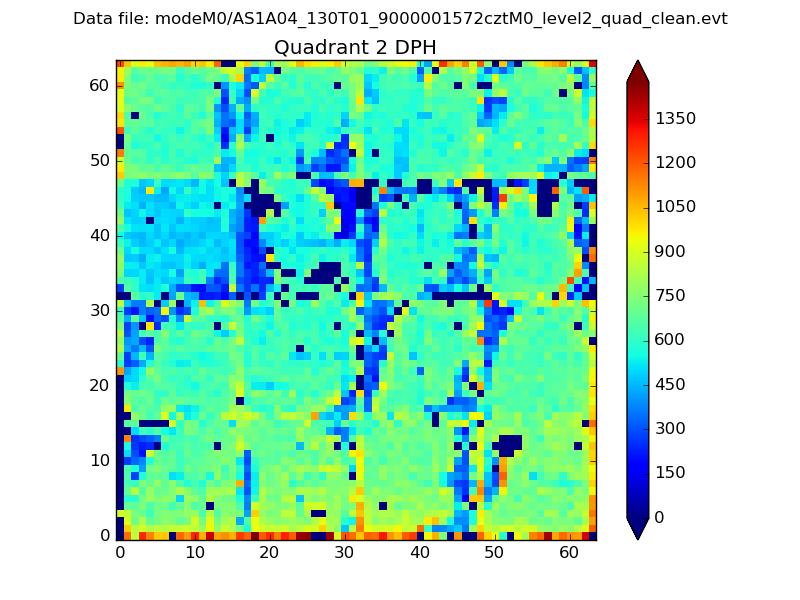
Histogram calculated using DETX and DETY for each event in the final _common_clean file
| Quadrant A |  |
 |
Quadrant B |
|---|---|---|---|
| Quadrant D |  |
 |
Quadrant C |
| Plot type | Count rate plots | Images |
|---|---|---|
| Comparison with Poisson distribution Blue bars denote a histogram of data divided into 1 sec bins. Red curve is a Poisson curve with rate = median count rate of data. |
 |
 |
| Quadrant-wise count rates Data is divided into 100 sec bins |
 |
|
| Module-wise count rates for Quadrant A Data is divided into 100 sec bins |
 |
 |
| Module-wise count rates for Quadrant B Data is divided into 100 sec bins |
 |
 |
| Module-wise count rates for Quadrant C Data is divided into 100 sec bins |
 |
 |
| Module-wise count rates for Quadrant D Data is divided into 100 sec bins |
 |
 |
| Parameter | Plot |
|---|---|
| CZT HV Monitor |  |
| D_VDD |  |
| Temperature 1 |  |
| Veto HV Monitor |  |
| Veto LLD | 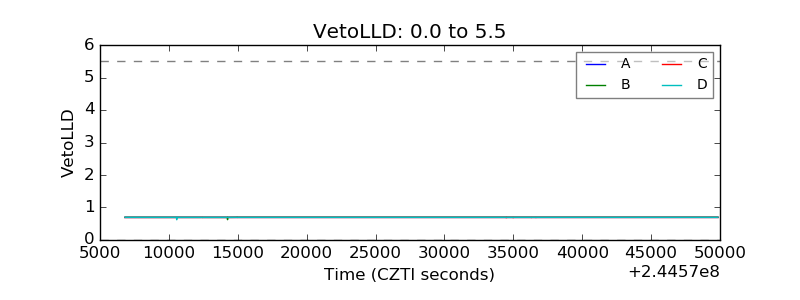 |
| Alpha Counter |  |
| _CPM_Rate |  |
| CZT Counter |  |
| +2.5 Volts monitor |  |
| +5 Volts monitor |  |
| _ROLL_ROT |  |
| _Roll_DEC |  |
| _Roll_RA |  |
| Veto Counter |  |