| Param | Original file | Final file |
|---|---|---|
| Filename | modeM0/AS1A04_130T01_9000001572_10874cztM0_level2.evt | modeM0/AS1A04_130T01_9000001572_10874cztM0_level2_quad_clean.evt |
| Size (bytes) | 375,151,680 | 55,275,840 |
| Size | 357.8 MB | 52.7 MB |
| Events in quadrant A | 3,022,799 | 329,006 |
| Events in quadrant B | 2,990,116 | 350,987 |
| Events in quadrant C | 2,280,535 | 380,026 |
| Events in quadrant D | 2,753,734 | 290,106 |
| Mode M9 | |||
|---|---|---|---|
| Quadrant | BADHDUFLAG | Total packets | Discarded packets |
| A | 0 | 8 | 2 |
| B | 0 | 8 | 4 |
| C | 0 | 8 | 4 |
| D | 0 | 8 | 4 |
| Mode SS | |||
|---|---|---|---|
| Quadrant | BADHDUFLAG | Total packets | Discarded packets |
| A | 0 | 162 | 64 |
| B | 0 | 162 | 54 |
| C | 0 | 162 | 52 |
| D | 0 | 162 | 70 |
| Mode M0 | |||
|---|---|---|---|
| Quadrant | BADHDUFLAG | Total packets | Discarded packets |
| A | 0 | 22901 | 10967 |
| B | 0 | 22616 | 10655 |
| C | 0 | 16169 | 5880 |
| D | 0 | 27376 | 16287 |
| Quadrant | Total seconds | Saturated seconds | Saturation percentage |
|---|---|---|---|
| A | 4408 | 241 | 5.467332% |
| B | 4559 | 274 | 6.010090% |
| C | 4969 | 22 | 0.442745% |
| D | 4251 | 262 | 6.163256% |
Noise dominated data is calculated using 1-second bins in cleaned event files. If a bin has >2000 counts, and if more than 50% of those come from <1% of pixels, then it is considered to be noise-dominated and hence unusable.
| Quadrant | # 1 sec bins | Bins with >0 counts | Bins with >2000 counts | High rate bins dominated by noise | Noise dominated (total time) | Noise dominated (detector-on time) | Marked lightcurve |
|---|---|---|---|---|---|---|---|
| A | 8685 | 5951 | 102 | 102 | 1.17% | 1.71% | 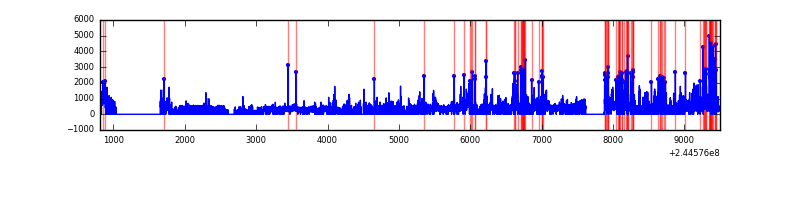 |
| B | 8686 | 6047 | 60 | 60 | 0.69% | 0.99% | 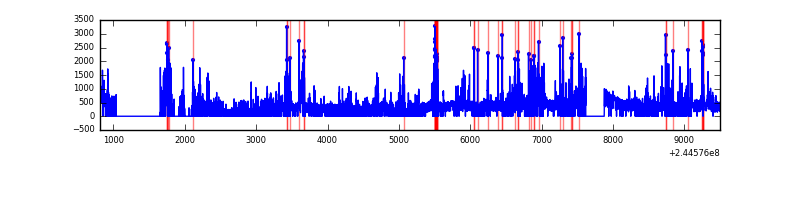 |
| C | 8686 | 6544 | 0 | 0 | 0.00% | 0.00% | 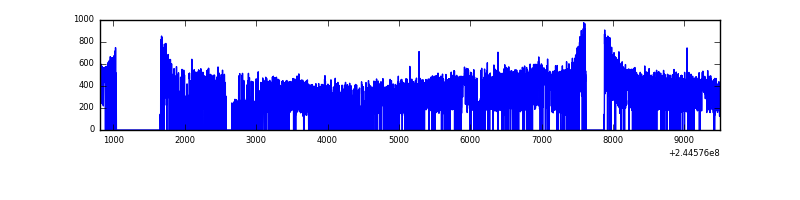 |
| D | 8686 | 5535 | 202 | 202 | 2.33% | 3.65% | 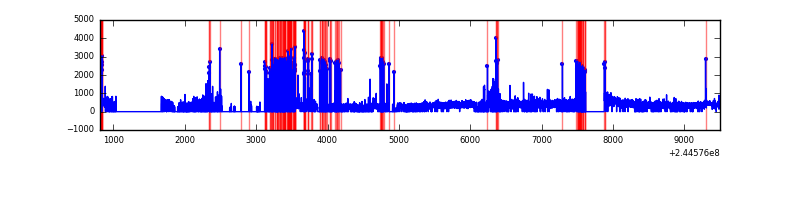 |
Top three noisy pixels from each quadrant. If the there are fewer than three noisy pixels in the level2.evt file, extra rows are filled as -1
| Pixel properties | Quadrant properties | ||||||
|---|---|---|---|---|---|---|---|
| Quadrant | DetID | PixID | Counts | Sigma | Mean | Median | Sigma |
| A | 8 | 5 | 644052 | 5974.89 | 519 | 508 | 107.7 |
| A | 15 | 223 | 196348 | 1818.25 | 519 | 508 | 107.7 |
| A | 5 | 112 | 67594 | 622.85 | 519 | 508 | 107.7 |
| B | 4 | 239 | 843781 | 7981.67 | 541 | 527 | 105.6 |
| B | 0 | 214 | 15071 | 137.66 | 541 | 527 | 105.6 |
| B | 12 | 111 | 11402 | 102.94 | 541 | 527 | 105.6 |
| C | 13 | 61 | 4282 | 26.65 | 584 | 587 | 138.7 |
| C | 8 | 222 | 1654 | 7.69 | 584 | 587 | 138.7 |
| C | 3 | 202 | 1484 | 6.47 | 584 | 587 | 138.7 |
| D | 1 | 52 | 734389 | 6172.83 | 481 | 467 | 118.9 |
| D | 8 | 195 | 108363 | 907.49 | 481 | 467 | 118.9 |
| D | 13 | 104 | 33669 | 279.25 | 481 | 467 | 118.9 |
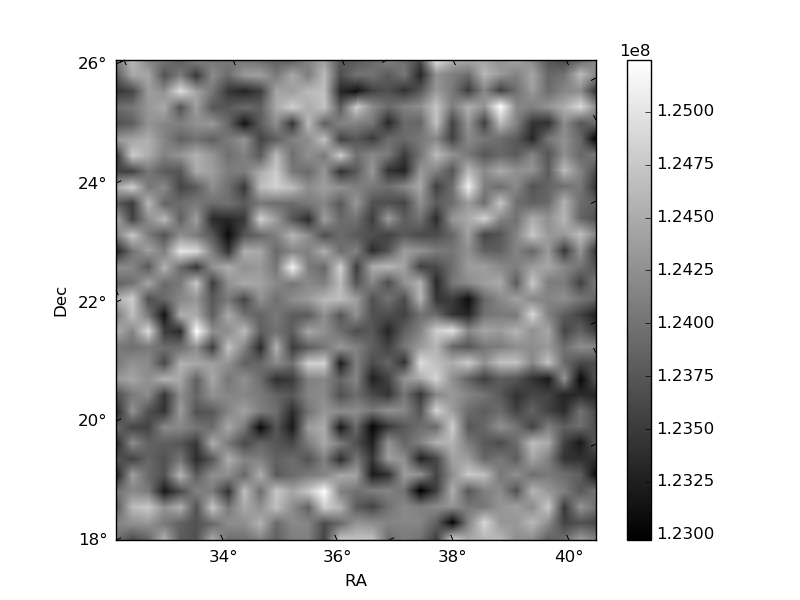
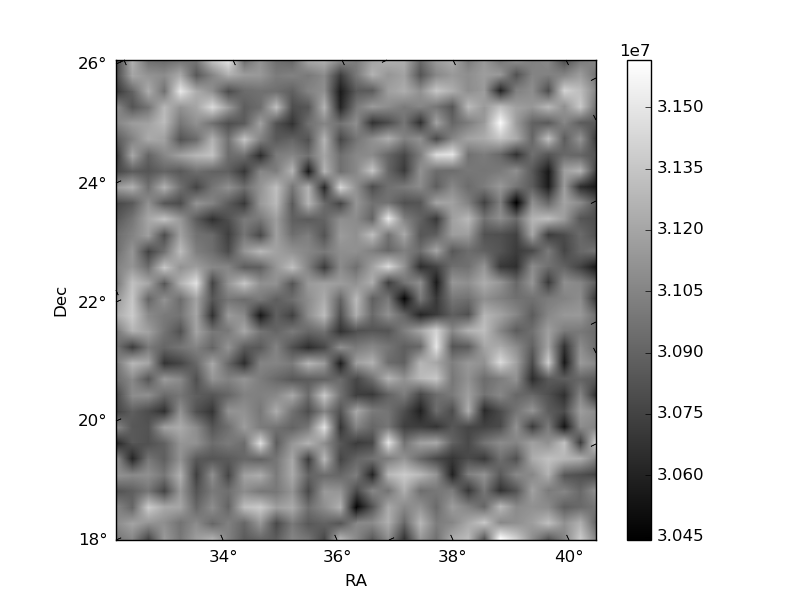
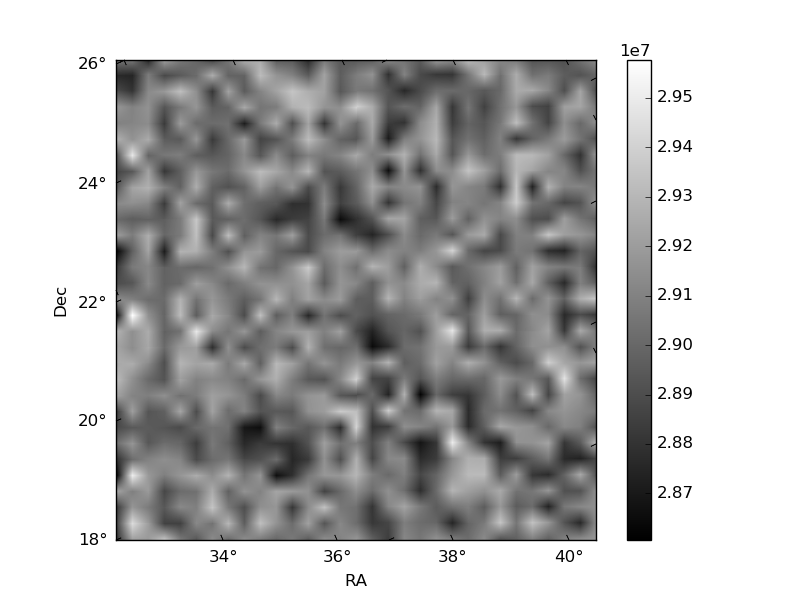
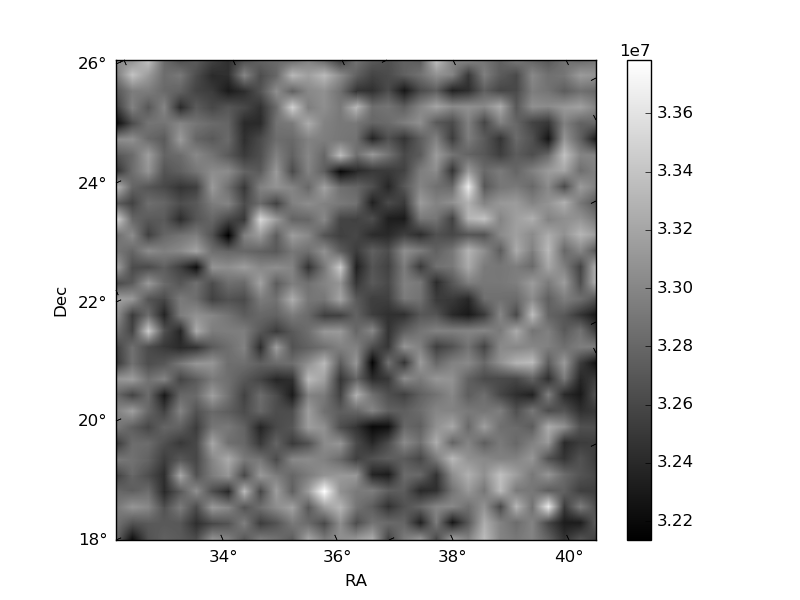
Histogram calculated using DETX and DETY for each event in the final _common_clean file
| Quadrant A | 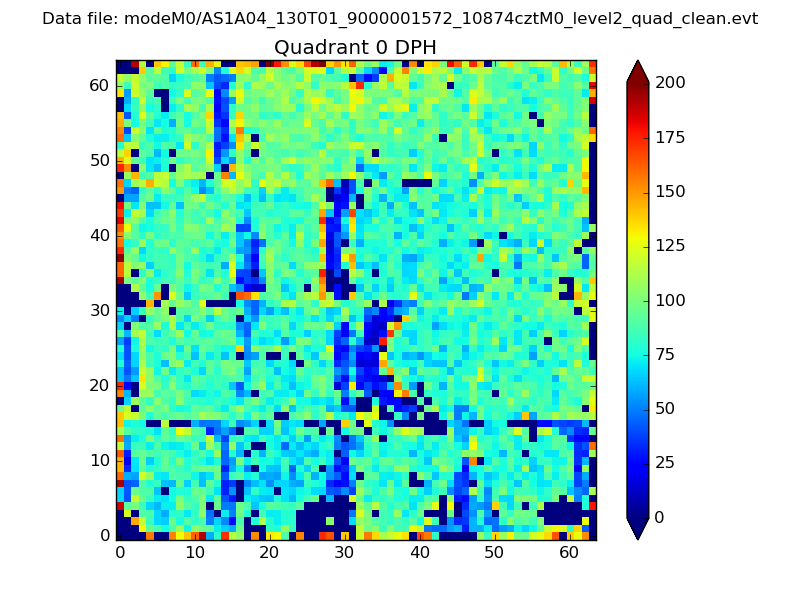 |
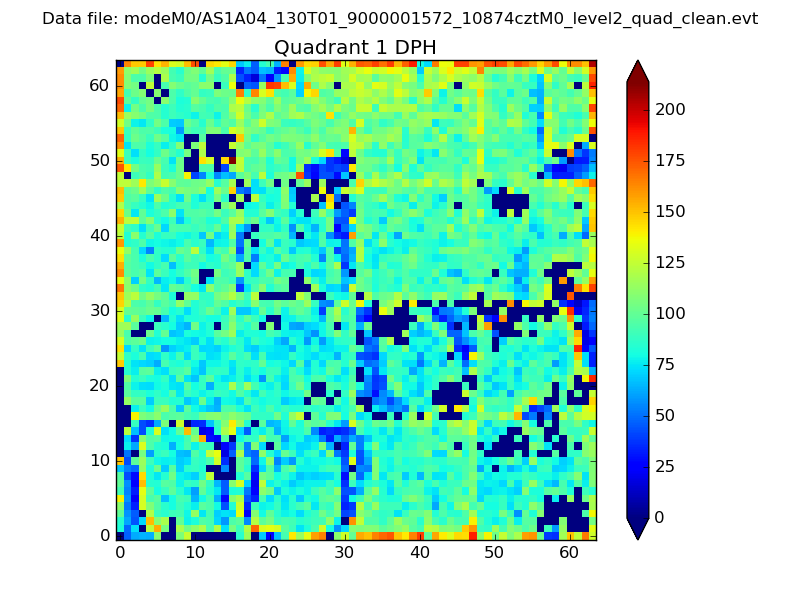 |
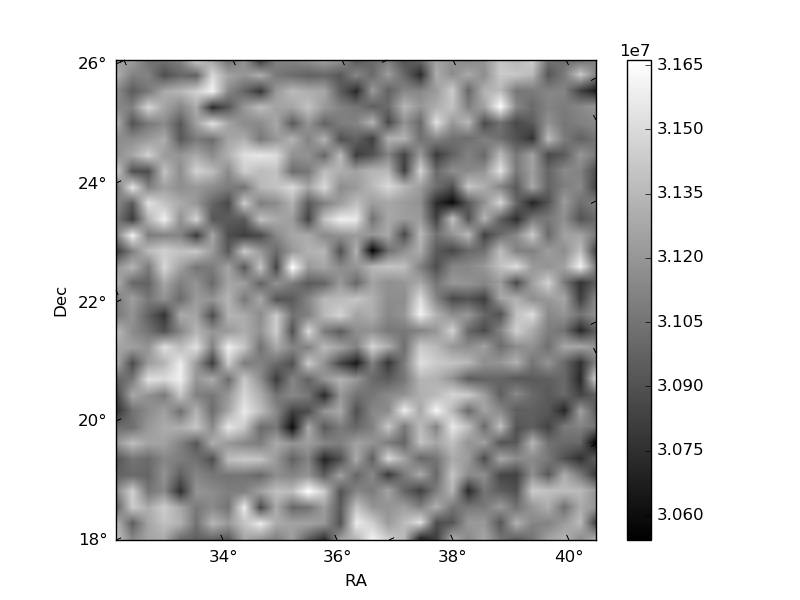
Quadrant B |
|---|---|---|---|
| Quadrant D | 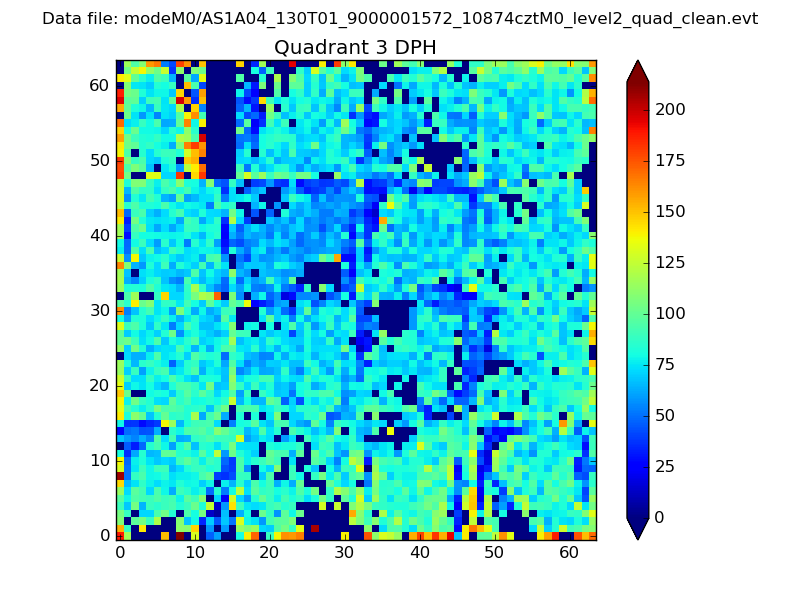 |
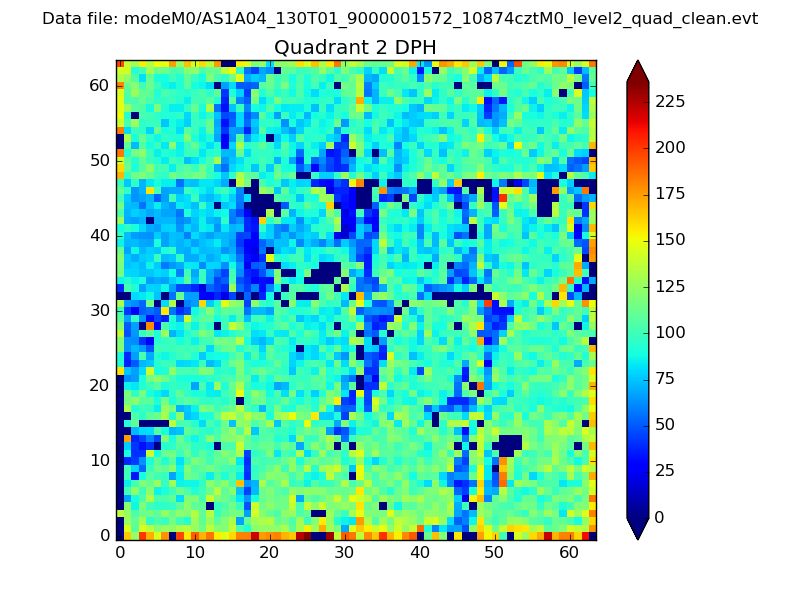 |
Quadrant C |
| Plot type | Count rate plots | Images |
|---|---|---|
| Comparison with Poisson distribution Blue bars denote a histogram of data divided into 1 sec bins. Red curve is a Poisson curve with rate = median count rate of data. |
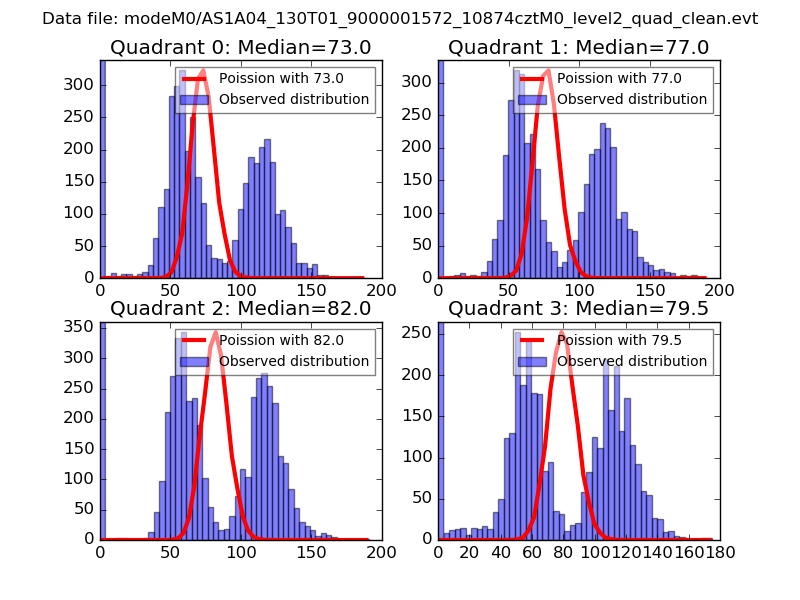 |
 |
| Quadrant-wise count rates Data is divided into 100 sec bins |
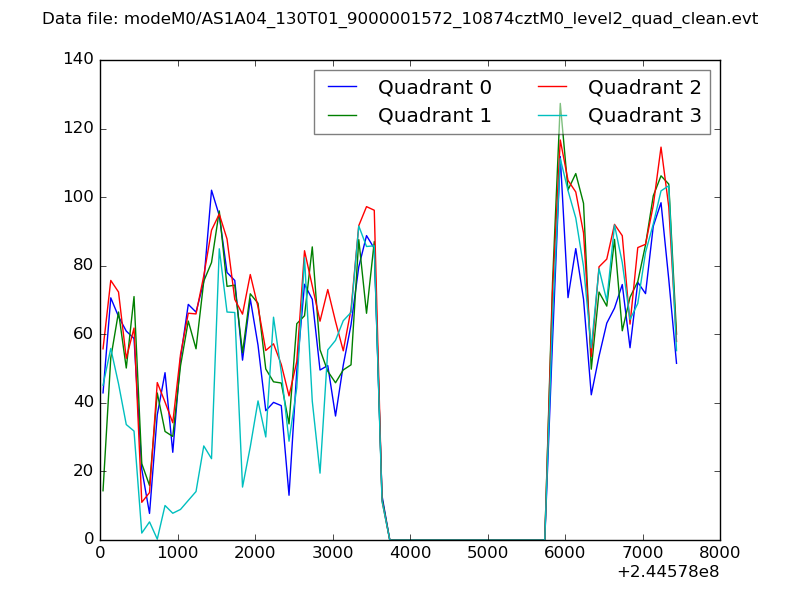 |
|
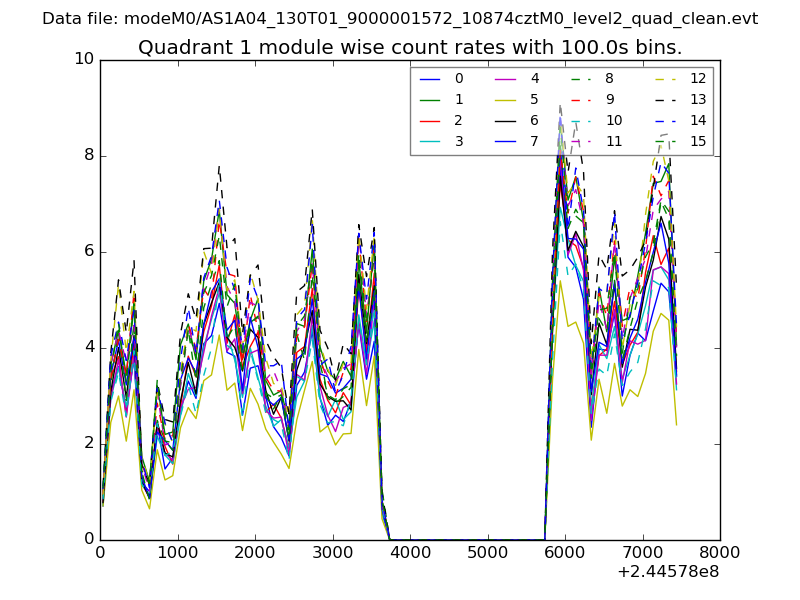
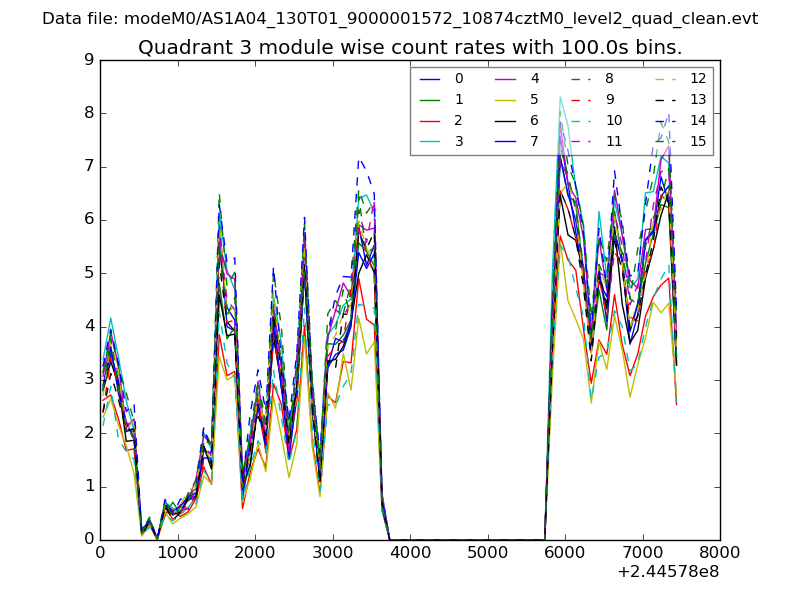
| Module-wise count rates for Quadrant A Data is divided into 100 sec bins |
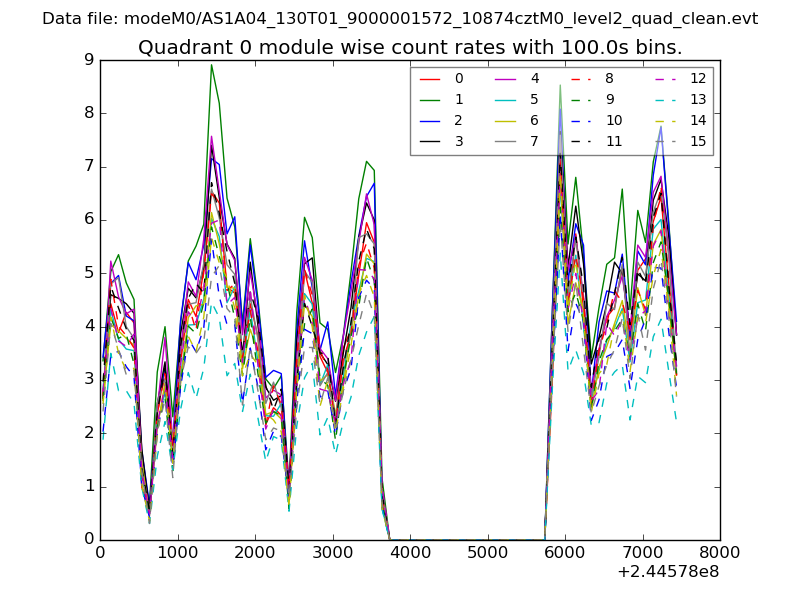 |
 |
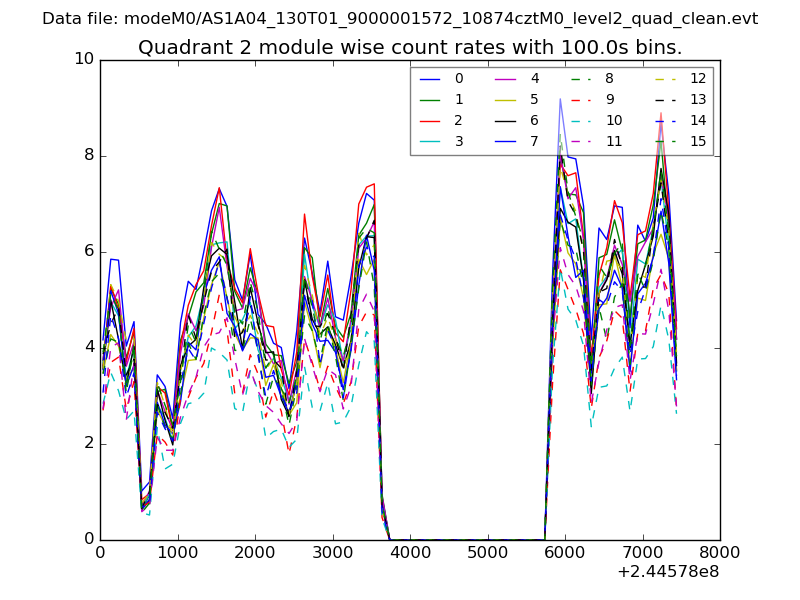
| Module-wise count rates for Quadrant B Data is divided into 100 sec bins |
 |
 |
| Module-wise count rates for Quadrant C Data is divided into 100 sec bins |
 |
 |
| Module-wise count rates for Quadrant D Data is divided into 100 sec bins |
 |
 |
| Parameter | Plot |
|---|---|
| CZT HV Monitor | 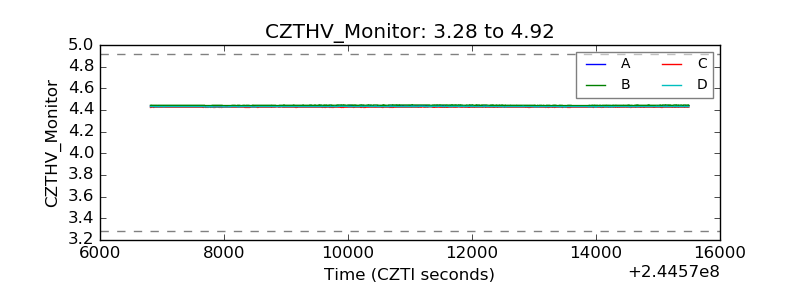 |
| D_VDD | 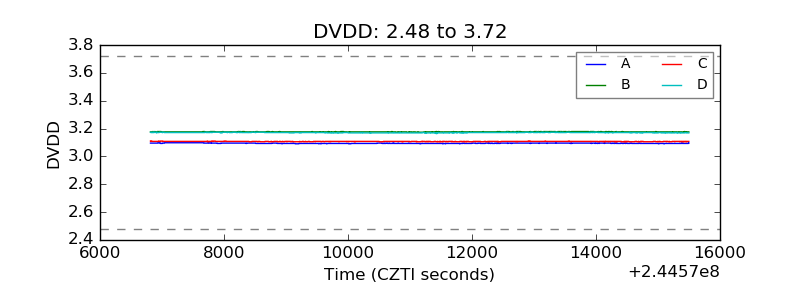 |
| Temperature 1 |  |
| Veto HV Monitor | 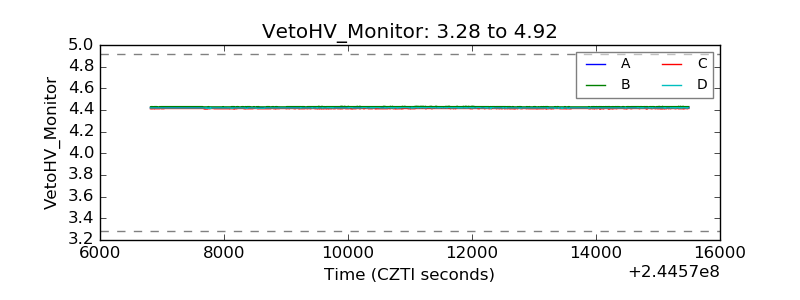 |
| Veto LLD |  |
| Alpha Counter | 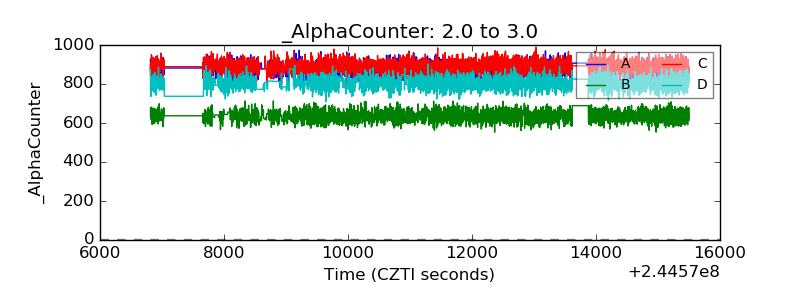 |
| _CPM_Rate | 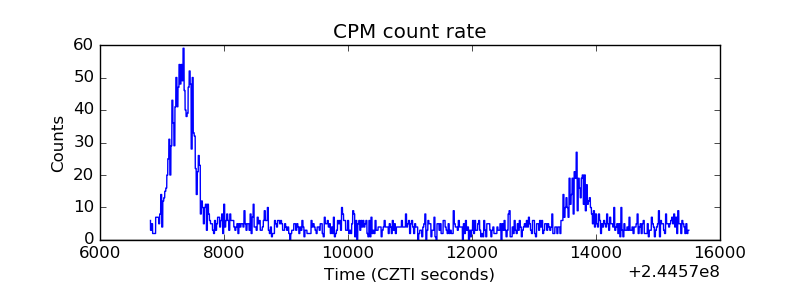 |
| CZT Counter | 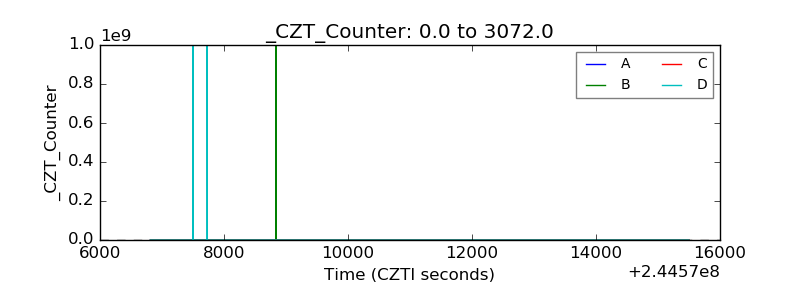 |
| +2.5 Volts monitor |  |
| +5 Volts monitor |  |
| _ROLL_ROT | 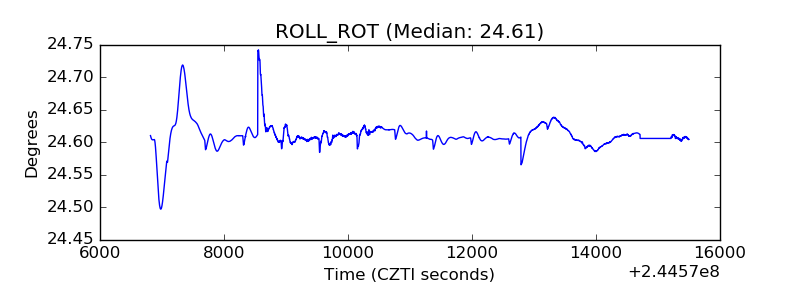 |
| _Roll_DEC | 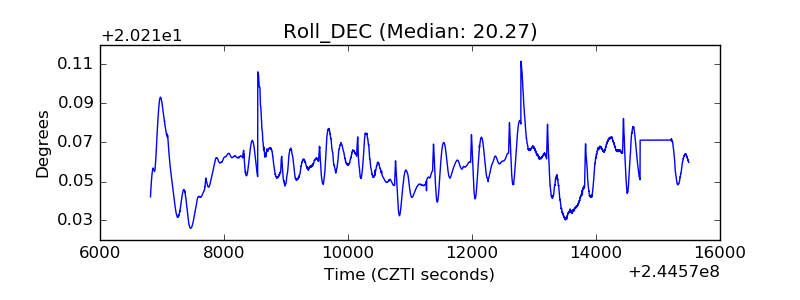 |
| _Roll_RA | 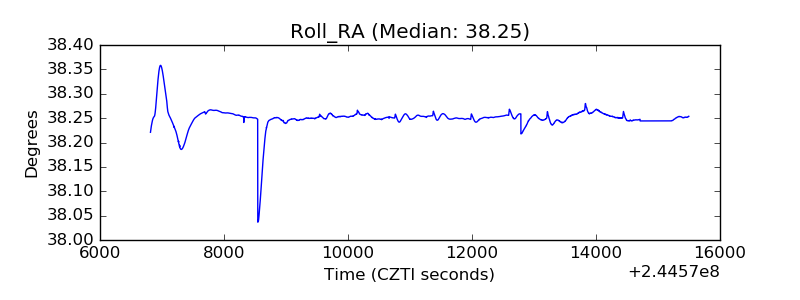 |
| Veto Counter | 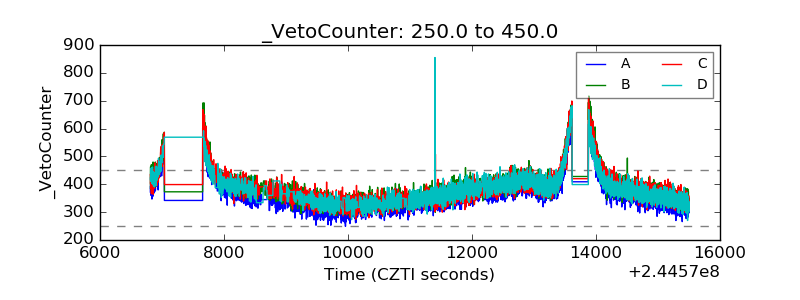 |