| Param | Original file | Final file |
|---|---|---|
| Filename | modeM0/AS1A04_130T01_9000001572_10875cztM0_level2.evt | modeM0/AS1A04_130T01_9000001572_10875cztM0_level2_quad_clean.evt |
| Size (bytes) | 1,362,424,320 | 162,184,320 |
| Size | 1.3 GB | 154.7 MB |
| Events in quadrant A | 9,721,661 | 1,012,770 |
| Events in quadrant B | 9,450,621 | 1,035,275 |
| Events in quadrant C | 6,240,162 | 1,052,975 |
| Events in quadrant D | 14,920,076 | 858,859 |
| Mode M9 | |||
|---|---|---|---|
| Quadrant | BADHDUFLAG | Total packets | Discarded packets |
| A | 0 | 10 | 0 |
| B | 0 | 10 | 0 |
| C | 0 | 10 | 0 |
| D | 0 | 10 | 0 |
| Mode SS | |||
|---|---|---|---|
| Quadrant | BADHDUFLAG | Total packets | Discarded packets |
| A | 0 | 284 | 0 |
| B | 0 | 284 | 2 |
| C | 0 | 284 | 0 |
| D | 0 | 284 | 0 |
| Mode M0 | |||
|---|---|---|---|
| Quadrant | BADHDUFLAG | Total packets | Discarded packets |
| A | 0 | 38493 | 200 |
| B | 0 | 37817 | 199 |
| C | 0 | 28587 | 101 |
| D | 0 | 54703 | 879 |
| Quadrant | Total seconds | Saturated seconds | Saturation percentage |
|---|---|---|---|
| A | 13768 | 911 | 6.616793% |
| B | 13766 | 1121 | 8.143251% |
| C | 13788 | 91 | 0.659994% |
| D | 13702 | 3422 | 24.974456% |
Noise dominated data is calculated using 1-second bins in cleaned event files. If a bin has >2000 counts, and if more than 50% of those come from <1% of pixels, then it is considered to be noise-dominated and hence unusable.
| Quadrant | # 1 sec bins | Bins with >0 counts | Bins with >2000 counts | High rate bins dominated by noise | Noise dominated (total time) | Noise dominated (detector-on time) | Marked lightcurve |
|---|---|---|---|---|---|---|---|
| A | 14966 | 13835 | 539 | 539 | 3.60% | 3.90% | 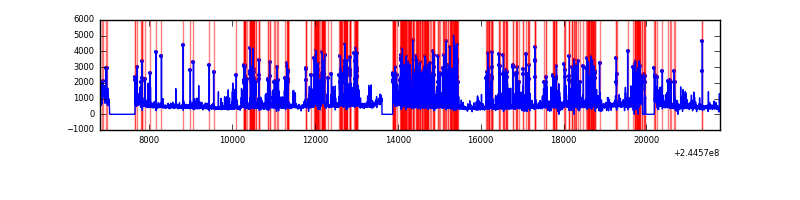 |
| B | 14966 | 13835 | 491 | 491 | 3.28% | 3.55% | 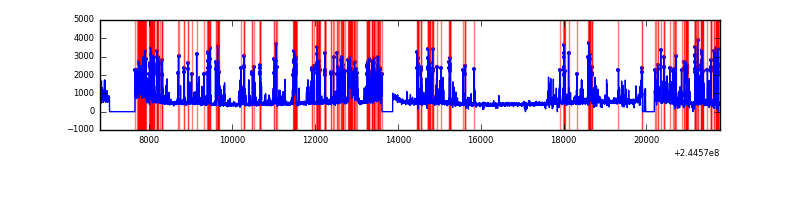 |
| C | 14966 | 13839 | 0 | 0 | 0.00% | 0.00% | 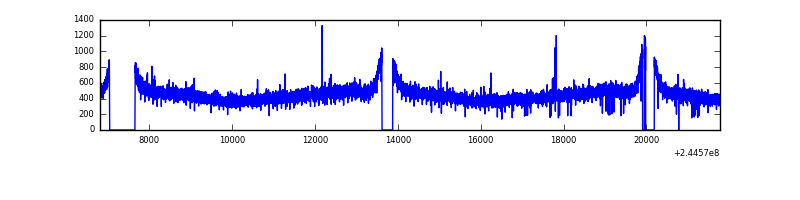 |
| D | 14966 | 13776 | 3085 | 3085 | 20.61% | 22.39% | 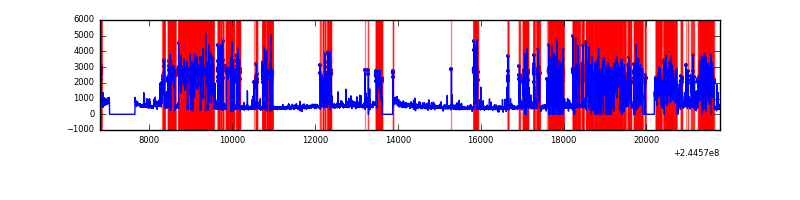 |
Top three noisy pixels from each quadrant. If the there are fewer than three noisy pixels in the level2.evt file, extra rows are filled as -1
| Pixel properties | Quadrant properties | ||||||
|---|---|---|---|---|---|---|---|
| Quadrant | DetID | PixID | Counts | Sigma | Mean | Median | Sigma |
| A | 8 | 5 | 2450680 | 7541.81 | 1594 | 1559 | 324.7 |
| A | 15 | 223 | 634736 | 1949.8 | 1594 | 1559 | 324.7 |
| A | 15 | 239 | 216914 | 663.16 | 1594 | 1559 | 324.7 |
| B | 4 | 239 | 3062769 | 9867.18 | 1609 | 1567 | 310.2 |
| B | 0 | 214 | 38997 | 120.65 | 1609 | 1567 | 310.2 |
| B | 12 | 111 | 34644 | 106.62 | 1609 | 1567 | 310.2 |
| C | 13 | 61 | 11843 | 27.46 | 1597 | 1605 | 372.8 |
| C | 14 | 234 | 11406 | 26.29 | 1597 | 1605 | 372.8 |
| C | 12 | 4 | 4719 | 8.35 | 1597 | 1605 | 372.8 |
| D | 1 | 52 | 8973405 | 26936.84 | 1362 | 1323 | 333.1 |
| D | 8 | 195 | 286555 | 856.35 | 1362 | 1323 | 333.1 |
| D | 9 | 85 | 158890 | 473.06 | 1362 | 1323 | 333.1 |
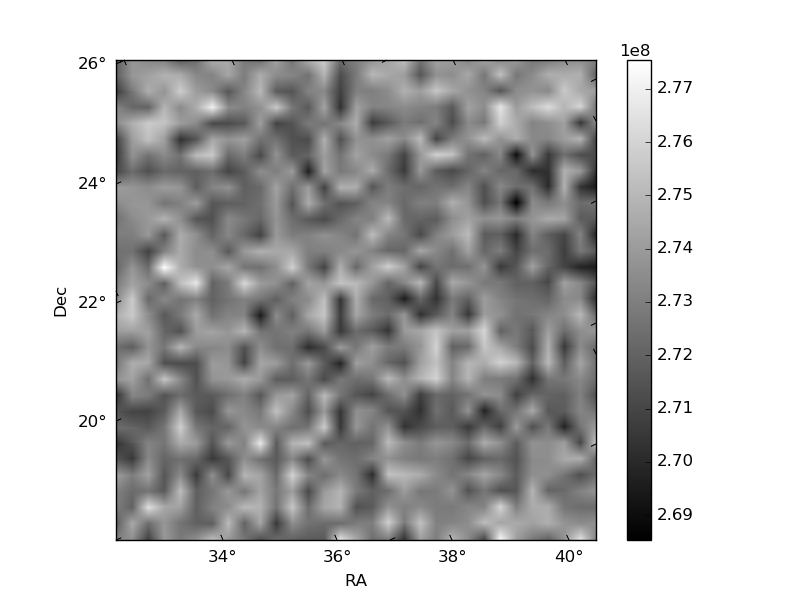
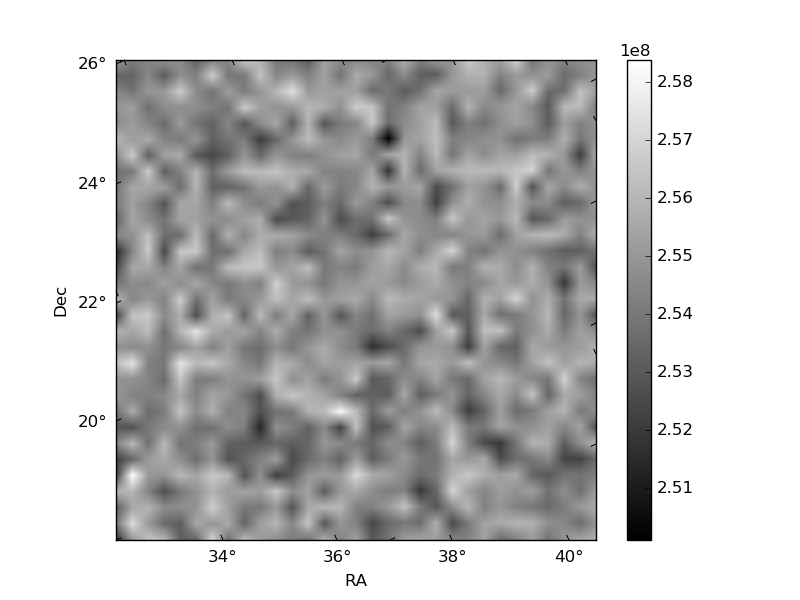
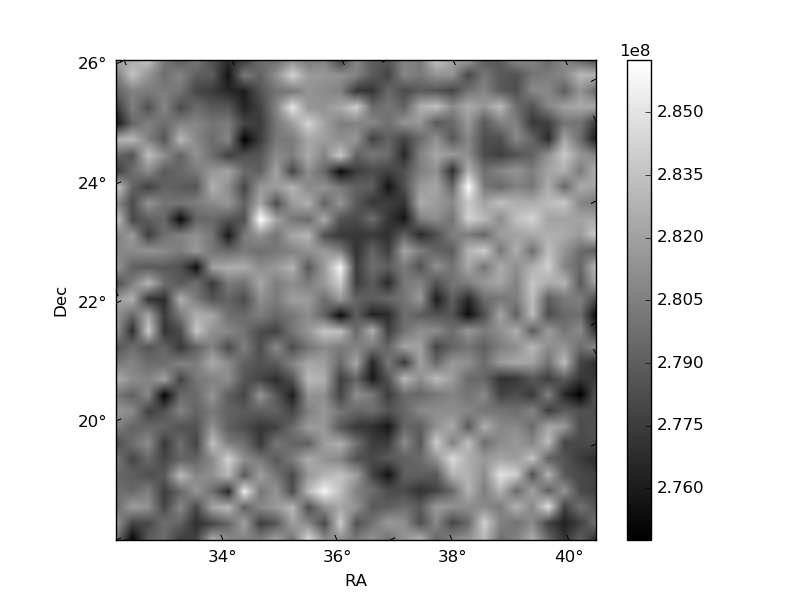
Histogram calculated using DETX and DETY for each event in the final _common_clean file
| Quadrant A |  |
 |
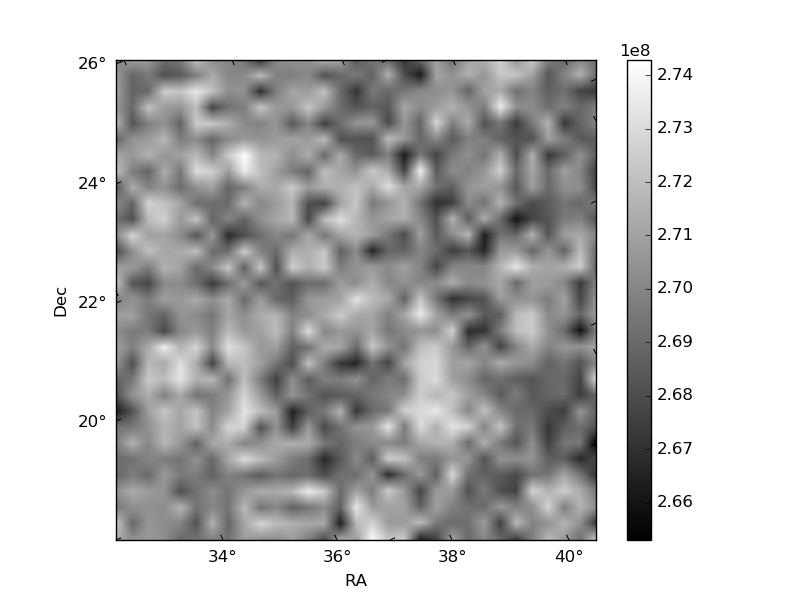
Quadrant B |
|---|---|---|---|
| Quadrant D |  |
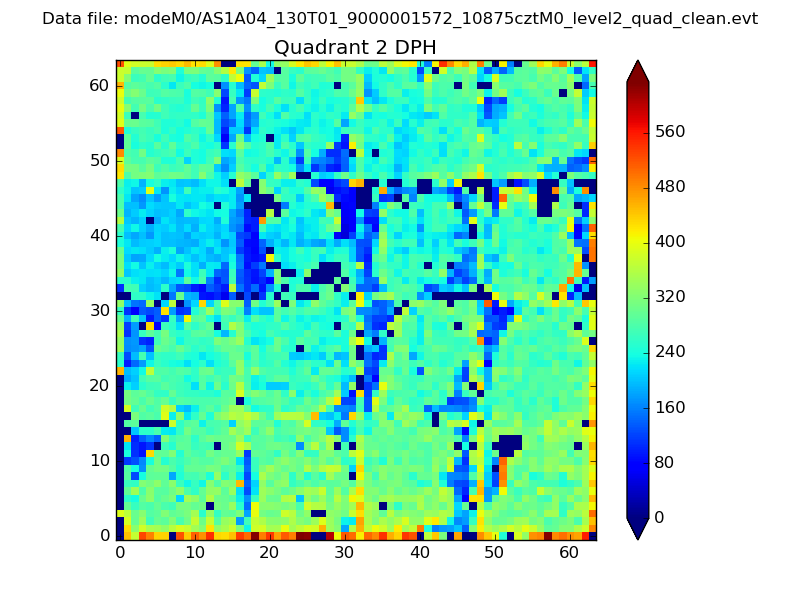 |
Quadrant C |
| Plot type | Count rate plots | Images |
|---|---|---|
| Comparison with Poisson distribution Blue bars denote a histogram of data divided into 1 sec bins. Red curve is a Poisson curve with rate = median count rate of data. |
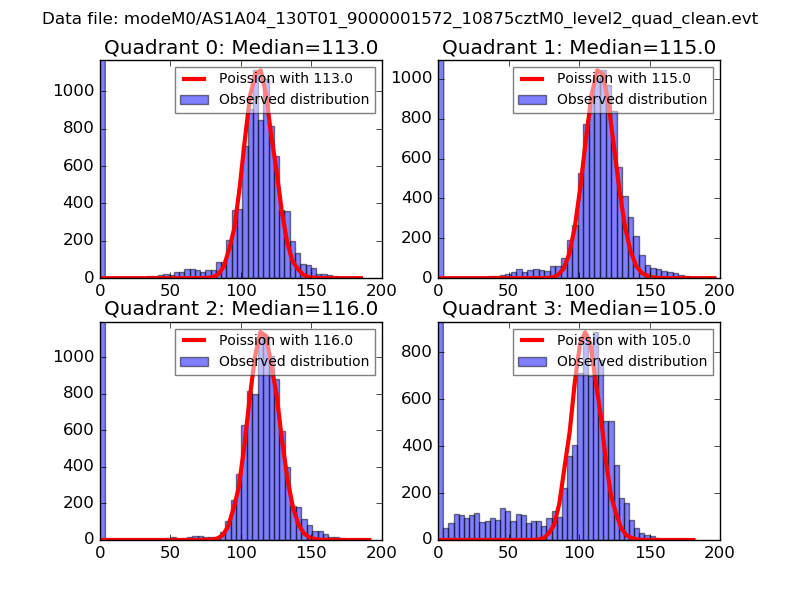 |
 |
| Quadrant-wise count rates Data is divided into 100 sec bins |
 |
|
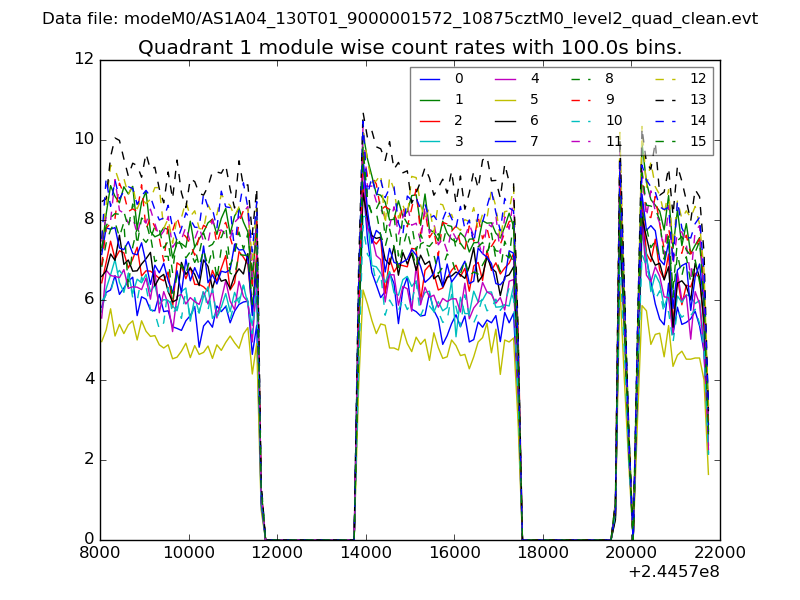
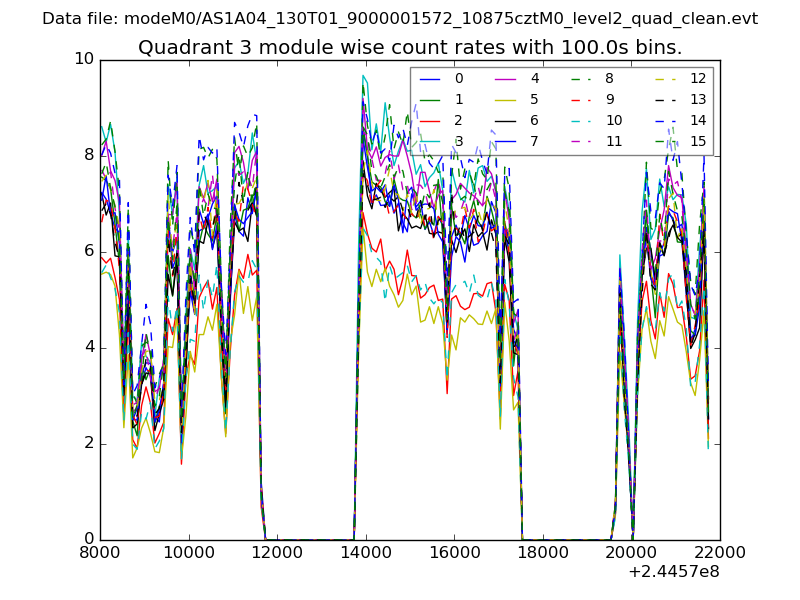
| Module-wise count rates for Quadrant A Data is divided into 100 sec bins |
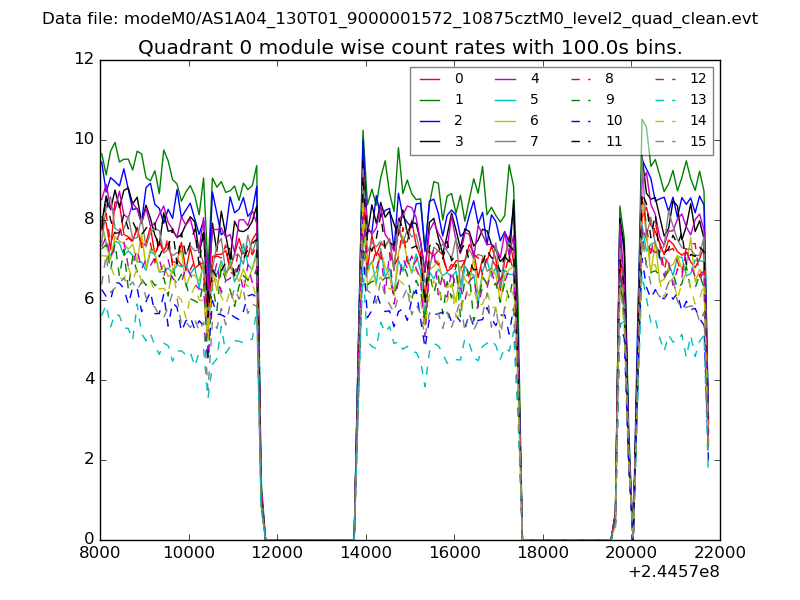 |
 |
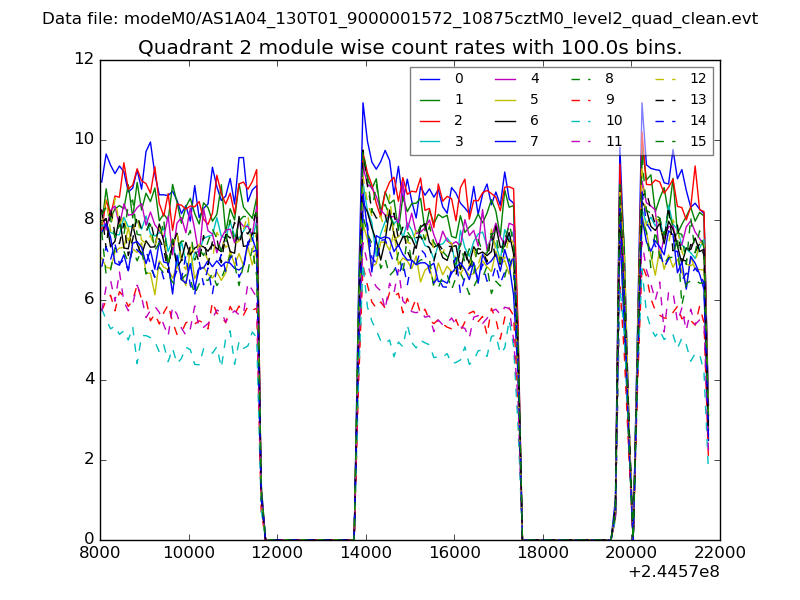
| Module-wise count rates for Quadrant B Data is divided into 100 sec bins |
 |
 |
| Module-wise count rates for Quadrant C Data is divided into 100 sec bins |
 |
 |
| Module-wise count rates for Quadrant D Data is divided into 100 sec bins |
 |
 |
| Parameter | Plot |
|---|---|
| CZT HV Monitor | 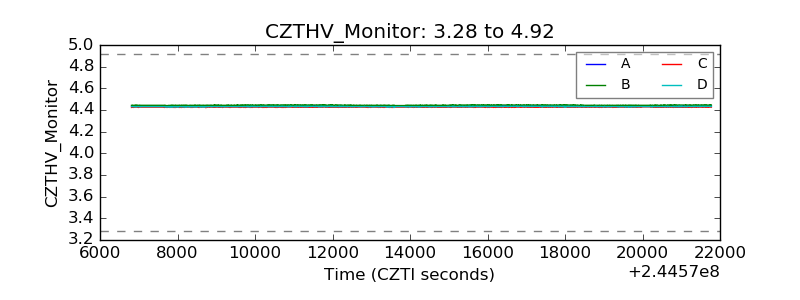 |
| D_VDD | 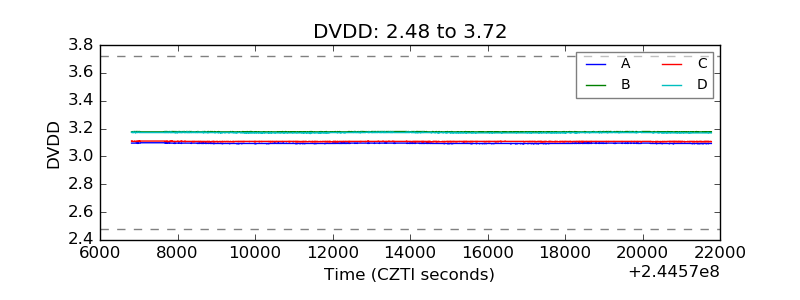 |
| Temperature 1 | 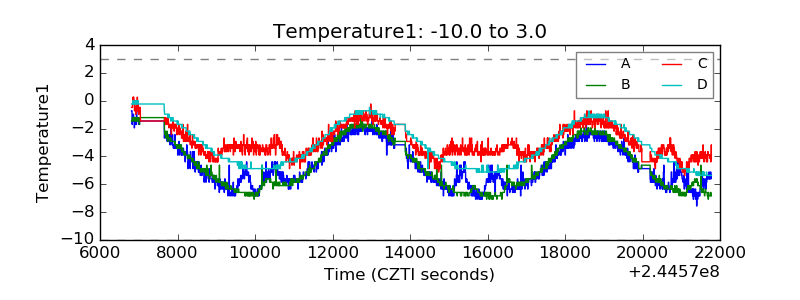 |
| Veto HV Monitor | 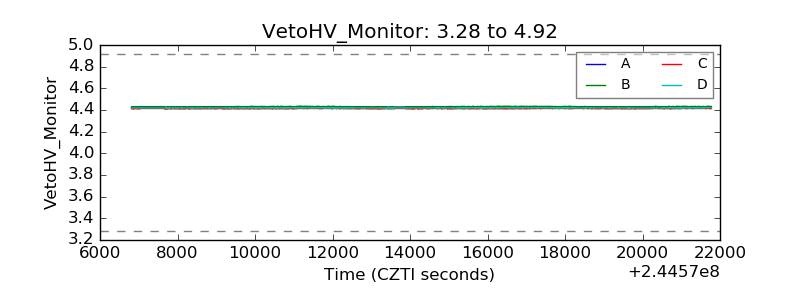 |
| Veto LLD | 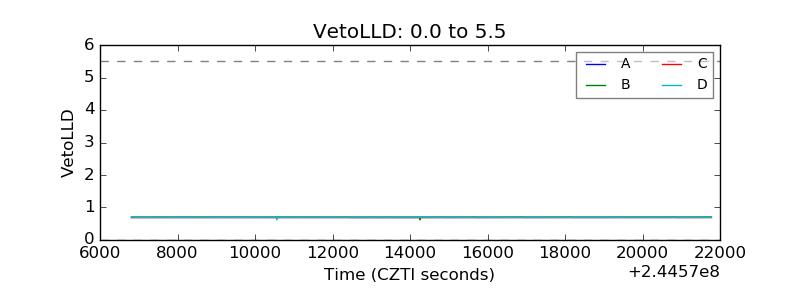 |
| Alpha Counter | 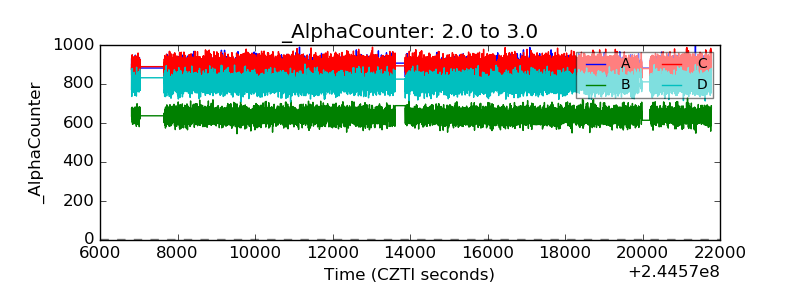 |
| _CPM_Rate | 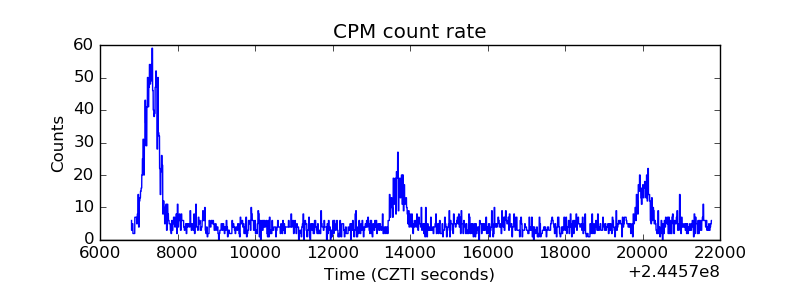 |
| CZT Counter | 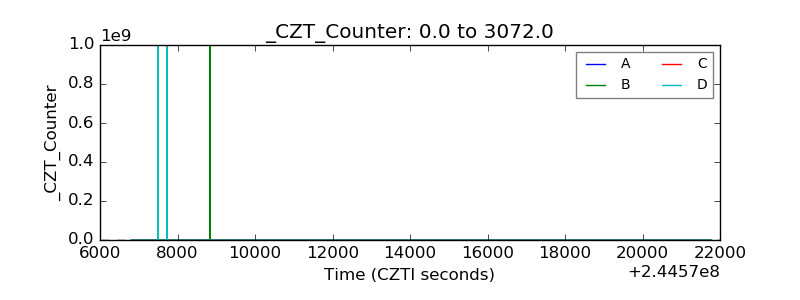 |
| +2.5 Volts monitor |  |
| +5 Volts monitor |  |
| _ROLL_ROT | 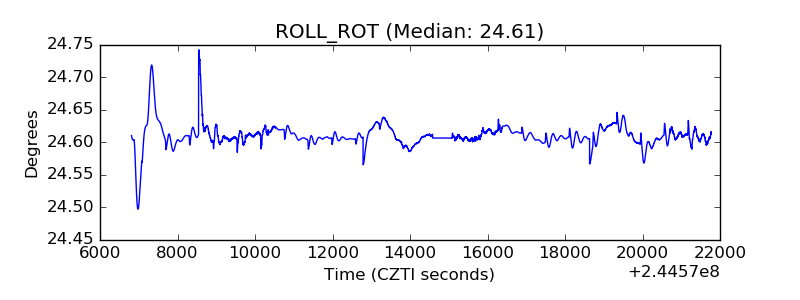 |
| _Roll_DEC | 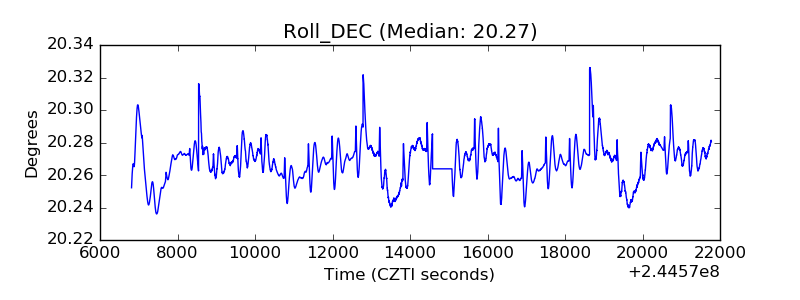 |
| _Roll_RA | 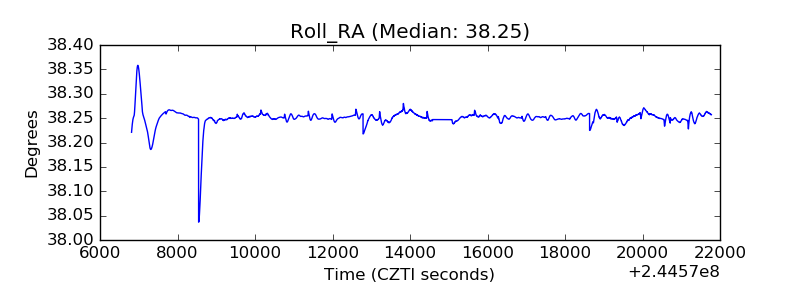 |
| Veto Counter | 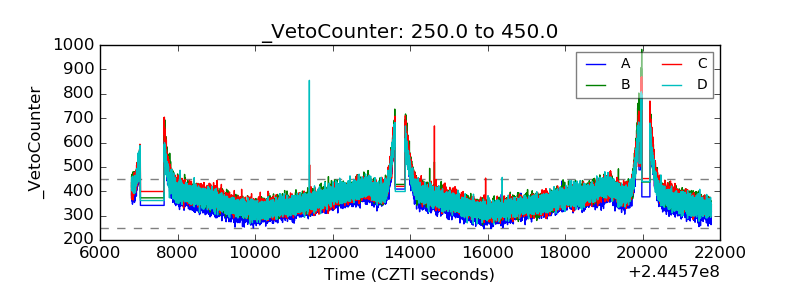 |