| Param | Original file | Final file |
|---|---|---|
| Filename | modeM0/AS1A04_130T01_9000001572_10878cztM0_level2.evt | modeM0/AS1A04_130T01_9000001572_10878cztM0_level2_quad_clean.evt |
| Size (bytes) | 1,513,157,760 | 221,662,080 |
| Size | 1.4 GB | 211.4 MB |
| Events in quadrant A | 9,822,612 | 1,378,051 |
| Events in quadrant B | 13,528,981 | 1,365,836 |
| Events in quadrant C | 8,158,333 | 1,400,421 |
| Events in quadrant D | 13,067,652 | 1,293,622 |
| Mode M9 | |||
|---|---|---|---|
| Quadrant | BADHDUFLAG | Total packets | Discarded packets |
| A | 0 | 19 | 0 |
| B | 0 | 19 | 0 |
| C | 0 | 19 | 0 |
| D | 0 | 19 | 0 |
| Mode SS | |||
|---|---|---|---|
| Quadrant | BADHDUFLAG | Total packets | Discarded packets |
| A | 0 | 380 | 2 |
| B | 0 | 380 | 6 |
| C | 0 | 380 | 4 |
| D | 0 | 380 | 8 |
| Mode M0 | |||
|---|---|---|---|
| Quadrant | BADHDUFLAG | Total packets | Discarded packets |
| A | 0 | 41961 | 397 |
| B | 0 | 53784 | 862 |
| C | 0 | 38083 | 356 |
| D | 0 | 52386 | 719 |
| Quadrant | Total seconds | Saturated seconds | Saturation percentage |
|---|---|---|---|
| A | 18515 | 222 | 1.199028% |
| B | 18481 | 1622 | 8.776581% |
| C | 18524 | 68 | 0.367091% |
| D | 18475 | 1032 | 5.585927% |
Noise dominated data is calculated using 1-second bins in cleaned event files. If a bin has >2000 counts, and if more than 50% of those come from <1% of pixels, then it is considered to be noise-dominated and hence unusable.
| Quadrant | # 1 sec bins | Bins with >0 counts | Bins with >2000 counts | High rate bins dominated by noise | Noise dominated (total time) | Noise dominated (detector-on time) | Marked lightcurve |
|---|---|---|---|---|---|---|---|
| A | 20509 | 18689 | 60 | 60 | 0.29% | 0.32% |  |
| B | 20509 | 18672 | 897 | 897 | 4.37% | 4.80% | 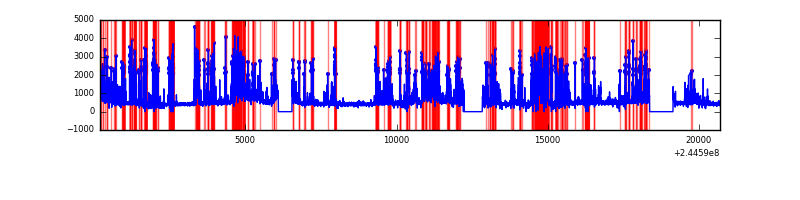 |
| C | 20509 | 18691 | 1 | 1 | 0.00% | 0.01% |  |
| D | 20510 | 18684 | 887 | 887 | 4.32% | 4.75% | 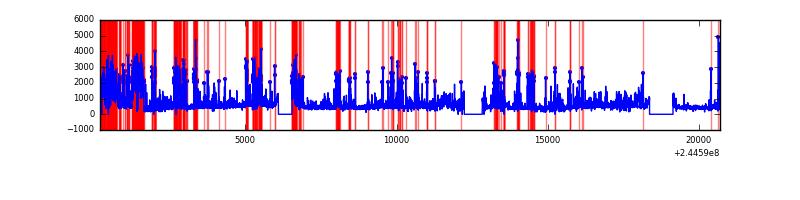 |
Top three noisy pixels from each quadrant. If the there are fewer than three noisy pixels in the level2.evt file, extra rows are filled as -1
| Pixel properties | Quadrant properties | ||||||
|---|---|---|---|---|---|---|---|
| Quadrant | DetID | PixID | Counts | Sigma | Mean | Median | Sigma |
| A | 8 | 5 | 1369744 | 3151.54 | 2138 | 2091 | 434.0 |
| A | 15 | 223 | 83703 | 188.06 | 2138 | 2091 | 434.0 |
| A | 15 | 239 | 34810 | 75.4 | 2138 | 2091 | 434.0 |
| B | 4 | 239 | 5217191 | 12995.81 | 2095 | 2041 | 401.3 |
| B | 0 | 187 | 49759 | 118.91 | 2095 | 2041 | 401.3 |
| B | 12 | 111 | 46244 | 110.15 | 2095 | 2041 | 401.3 |
| C | 13 | 61 | 15234 | 27.08 | 2084 | 2092 | 485.3 |
| C | 8 | 128 | 12989 | 22.45 | 2084 | 2092 | 485.3 |
| C | 14 | 234 | 8782 | 13.78 | 2084 | 2092 | 485.3 |
| D | 1 | 52 | 4145129 | 8407.34 | 2032 | 1965 | 492.8 |
| D | 5 | 222 | 265314 | 534.39 | 2032 | 1965 | 492.8 |
| D | 13 | 249 | 229990 | 462.71 | 2032 | 1965 | 492.8 |
Histogram calculated using DETX and DETY for each event in the final _common_clean file
| Quadrant A |  |
 |
Quadrant B |
|---|---|---|---|
| Quadrant D |  |
 |
Quadrant C |
| Plot type | Count rate plots | Images |
|---|---|---|
| Comparison with Poisson distribution Blue bars denote a histogram of data divided into 1 sec bins. Red curve is a Poisson curve with rate = median count rate of data. |
 |
 |
| Quadrant-wise count rates Data is divided into 100 sec bins |
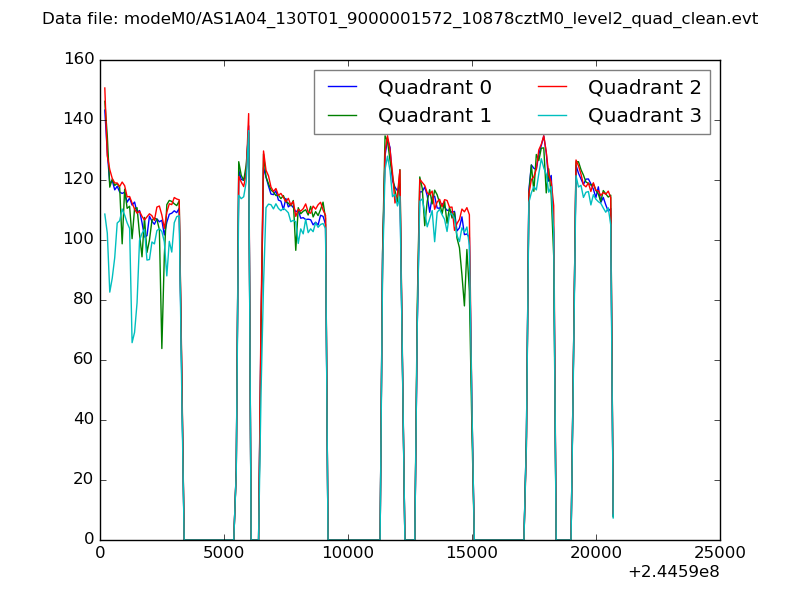 |
|
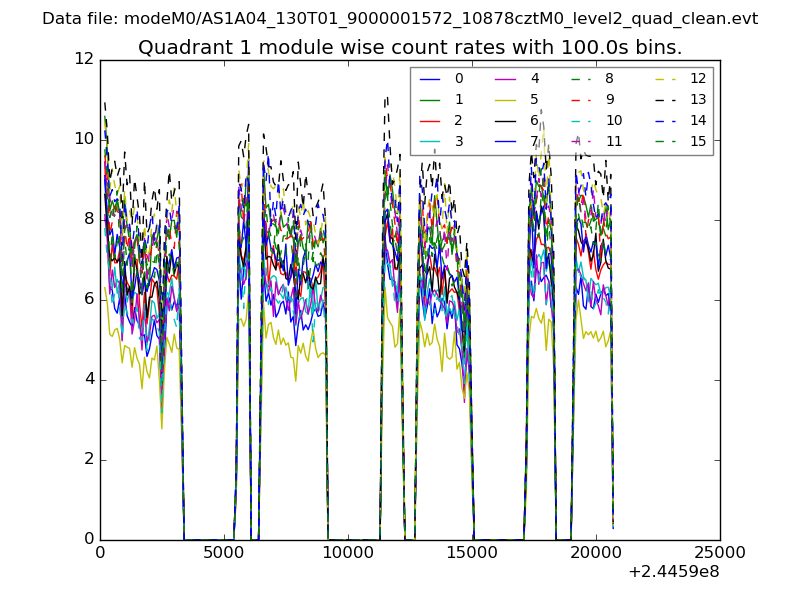
| Module-wise count rates for Quadrant A Data is divided into 100 sec bins |
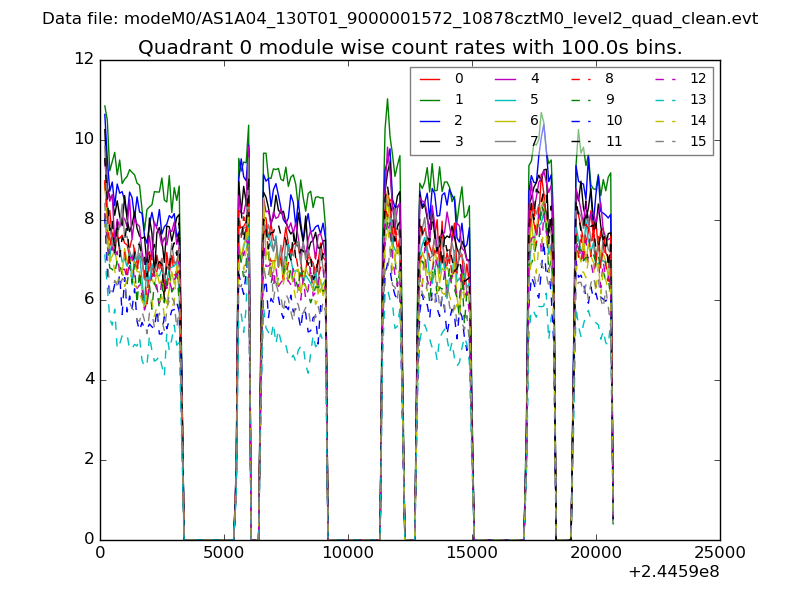 |
 |
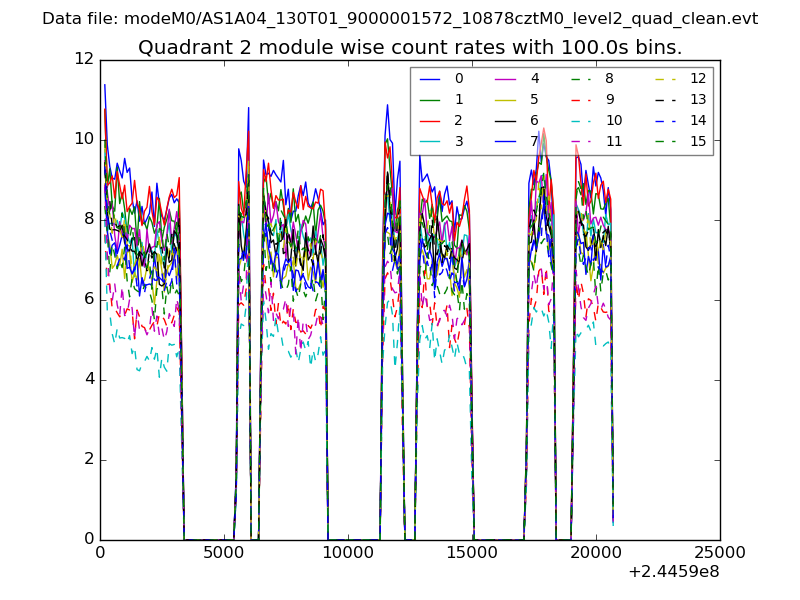
| Module-wise count rates for Quadrant B Data is divided into 100 sec bins |
 |
 |
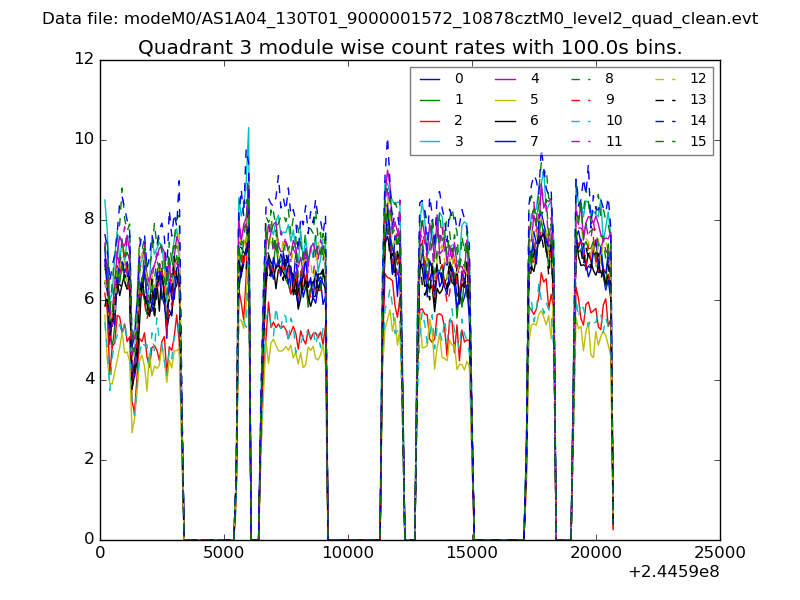
| Module-wise count rates for Quadrant C Data is divided into 100 sec bins |
 |
 |
| Module-wise count rates for Quadrant D Data is divided into 100 sec bins |
 |
 |
| Parameter | Plot |
|---|---|
| CZT HV Monitor | 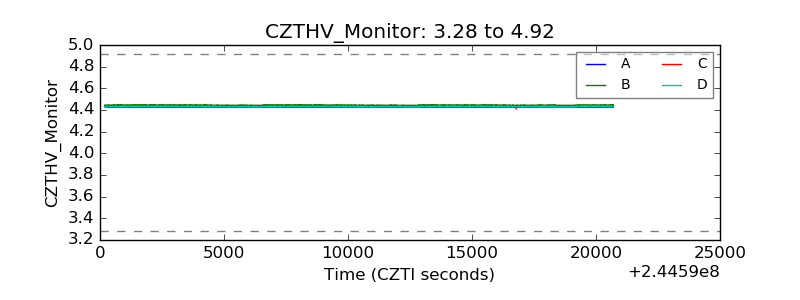 |
| D_VDD |  |
| Temperature 1 |  |
| Veto HV Monitor |  |
| Veto LLD |  |
| Alpha Counter | 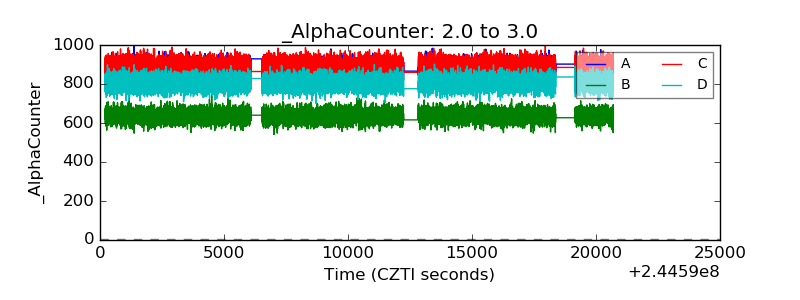 |
| _CPM_Rate | 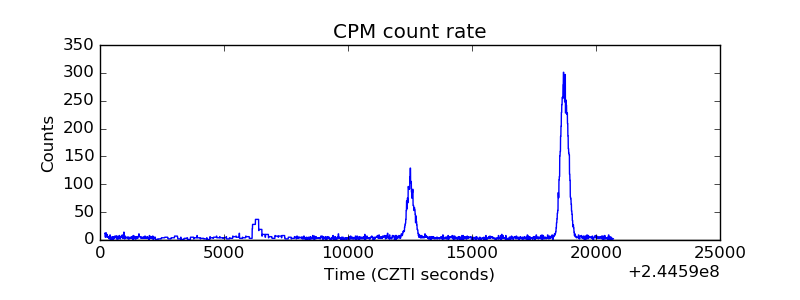 |
| CZT Counter |  |
| +2.5 Volts monitor |  |
| +5 Volts monitor |  |
| _ROLL_ROT | 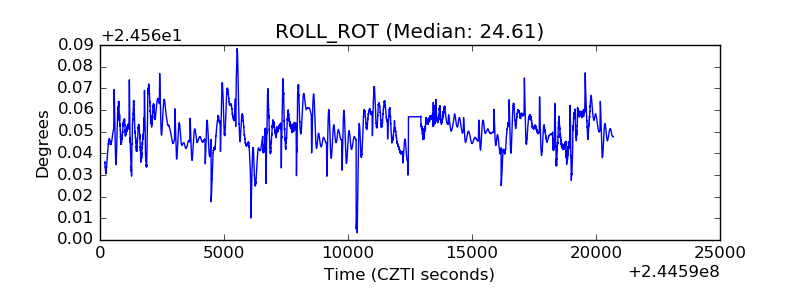 |
| _Roll_DEC |  |
| _Roll_RA |  |
| Veto Counter | 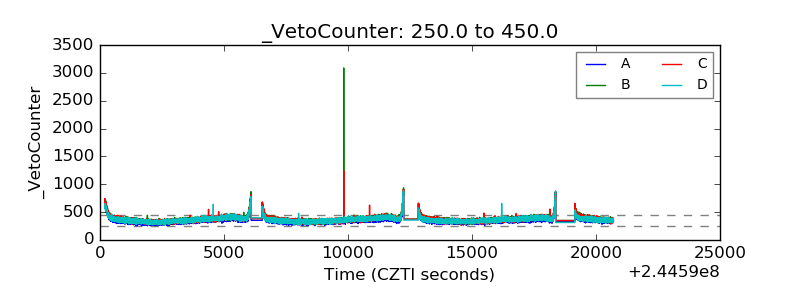 |