| Param | Original file | Final file |
|---|---|---|
| Filename | modeM0/AS1A04_130T01_9000001572_10879cztM0_level2.evt | modeM0/AS1A04_130T01_9000001572_10879cztM0_level2_quad_clean.evt |
| Size (bytes) | 529,637,760 | 76,207,680 |
| Size | 505.1 MB | 72.7 MB |
| Events in quadrant A | 4,412,102 | 471,993 |
| Events in quadrant B | 4,505,203 | 475,438 |
| Events in quadrant C | 2,710,048 | 477,058 |
| Events in quadrant D | 3,994,483 | 452,462 |
| Mode M9 | |||
|---|---|---|---|
| Quadrant | BADHDUFLAG | Total packets | Discarded packets |
| A | 0 | 10 | 0 |
| B | 0 | 10 | 0 |
| C | 0 | 10 | 0 |
| D | 0 | 10 | 0 |
| Mode SS | |||
|---|---|---|---|
| Quadrant | BADHDUFLAG | Total packets | Discarded packets |
| A | 0 | 124 | 0 |
| B | 0 | 124 | 0 |
| C | 0 | 124 | 0 |
| D | 0 | 124 | 0 |
| Mode M0 | |||
|---|---|---|---|
| Quadrant | BADHDUFLAG | Total packets | Discarded packets |
| A | 0 | 17146 | 2 |
| B | 0 | 17548 | 1 |
| C | 0 | 12443 | 1 |
| D | 0 | 16272 | 1 |
| Quadrant | Total seconds | Saturated seconds | Saturation percentage |
|---|---|---|---|
| A | 6172 | 521 | 8.441348% |
| B | 6172 | 428 | 6.934543% |
| C | 6172 | 7 | 0.113415% |
| D | 6172 | 71 | 1.150356% |
Noise dominated data is calculated using 1-second bins in cleaned event files. If a bin has >2000 counts, and if more than 50% of those come from <1% of pixels, then it is considered to be noise-dominated and hence unusable.
| Quadrant | # 1 sec bins | Bins with >0 counts | Bins with >2000 counts | High rate bins dominated by noise | Noise dominated (total time) | Noise dominated (detector-on time) | Marked lightcurve |
|---|---|---|---|---|---|---|---|
| A | 7127 | 6173 | 376 | 376 | 5.28% | 6.09% | 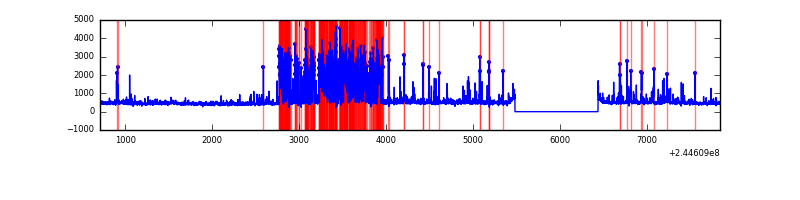 |
| B | 7127 | 6173 | 238 | 238 | 3.34% | 3.86% | 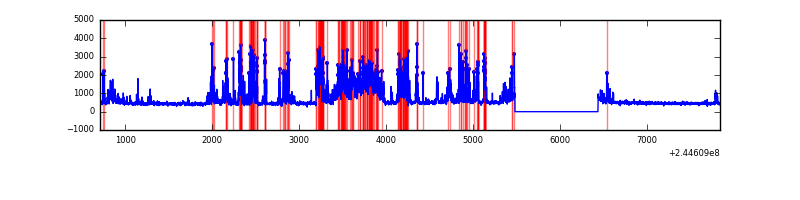 |
| C | 7127 | 6173 | 1 | 1 | 0.01% | 0.02% |  |
| D | 7127 | 6173 | 46 | 46 | 0.65% | 0.75% | 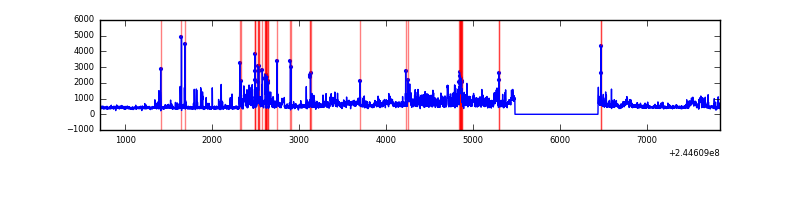 |
Top three noisy pixels from each quadrant. If the there are fewer than three noisy pixels in the level2.evt file, extra rows are filled as -1
| Pixel properties | Quadrant properties | ||||||
|---|---|---|---|---|---|---|---|
| Quadrant | DetID | PixID | Counts | Sigma | Mean | Median | Sigma |
| A | 8 | 5 | 1685897 | 11698.13 | 701 | 683 | 144.1 |
| A | 11 | 29 | 16064 | 106.77 | 701 | 683 | 144.1 |
| A | 0 | 226 | 6427 | 39.87 | 701 | 683 | 144.1 |
| B | 4 | 239 | 1724821 | 12740.8 | 703 | 687 | 135.3 |
| B | 0 | 187 | 23814 | 170.9 | 703 | 687 | 135.3 |
| B | 12 | 111 | 15422 | 108.89 | 703 | 687 | 135.3 |
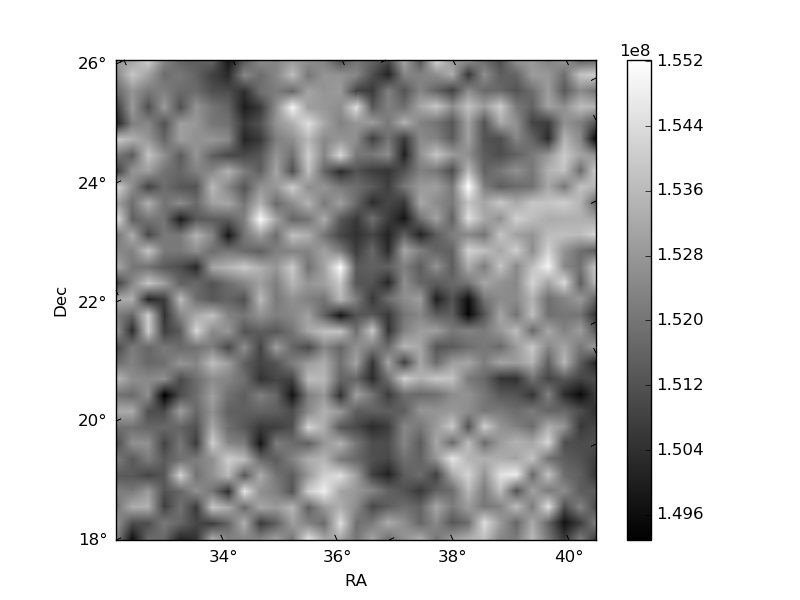
| C | 14 | 234 | 7837 | 44.14 | 693 | 696 | 161.8 |
| C | 13 | 61 | 5004 | 26.63 | 693 | 696 | 161.8 |
| C | 8 | 222 | 1823 | 6.97 | 693 | 696 | 161.8 |
| D | 1 | 52 | 993189 | 5926.54 | 689 | 669 | 167.5 |
| D | 5 | 222 | 167580 | 996.66 | 689 | 669 | 167.5 |
| D | 13 | 152 | 76574 | 453.24 | 689 | 669 | 167.5 |
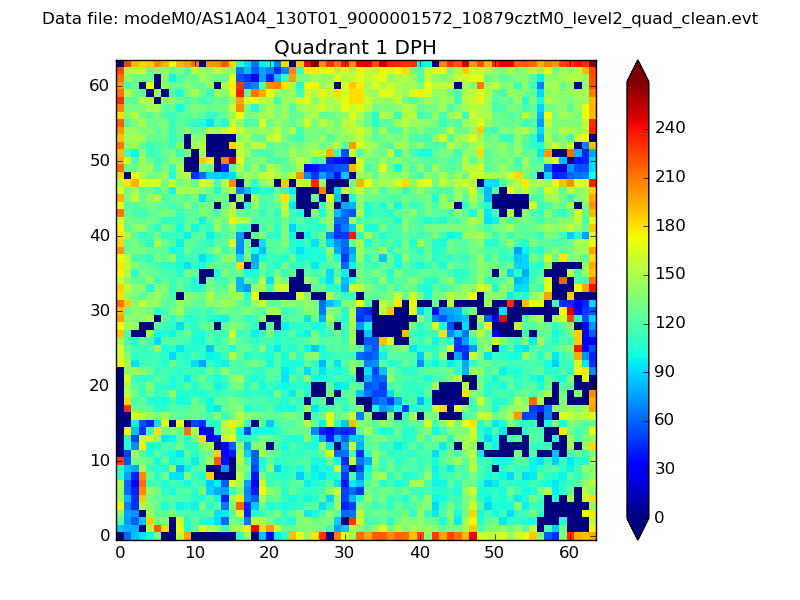
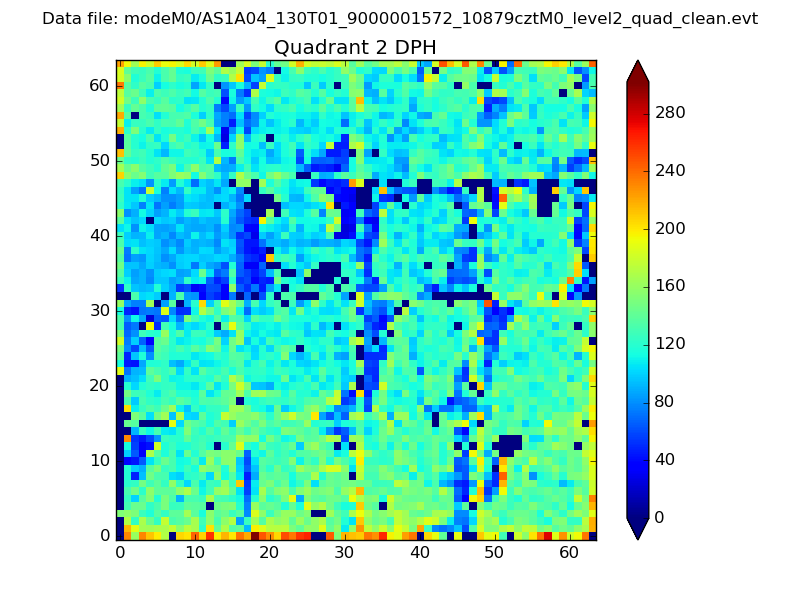
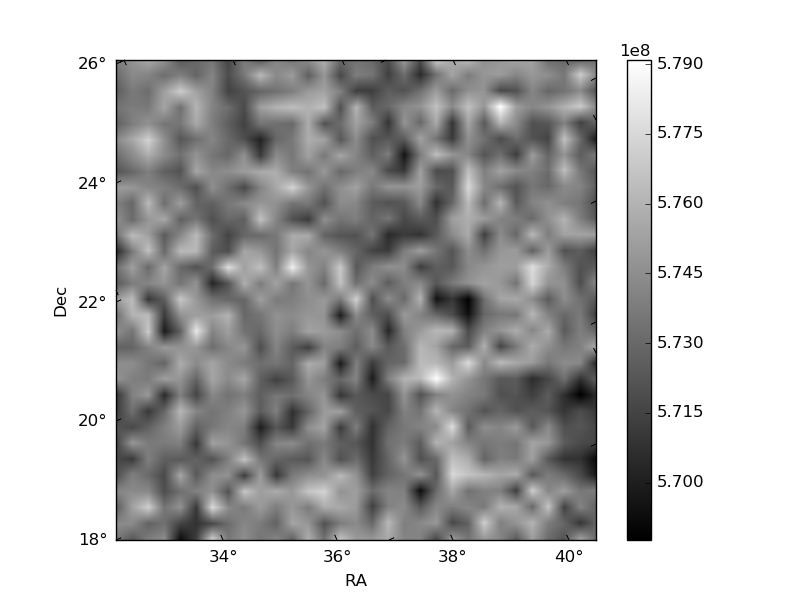
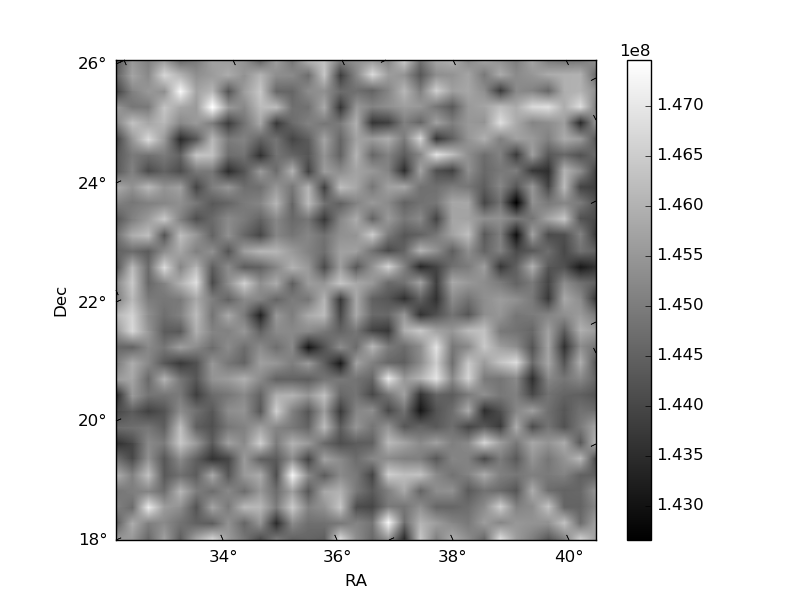
Histogram calculated using DETX and DETY for each event in the final _common_clean file
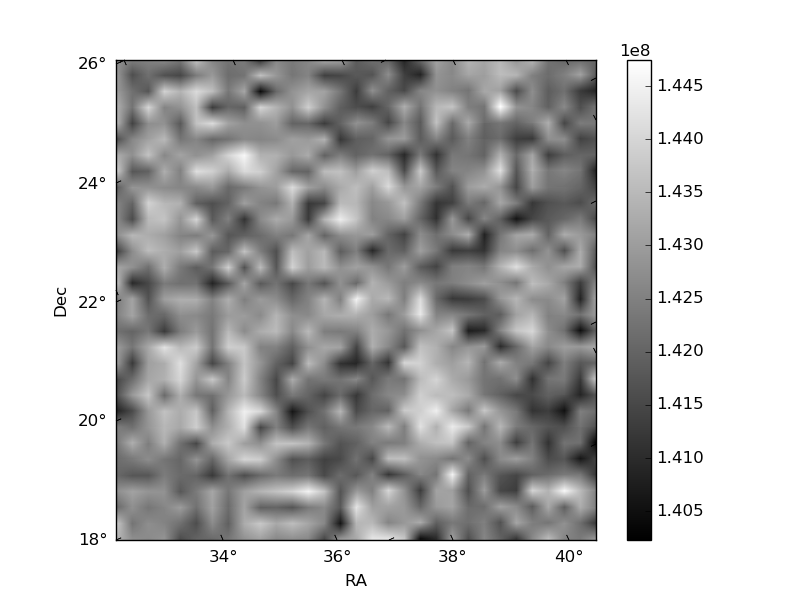
| Quadrant A | 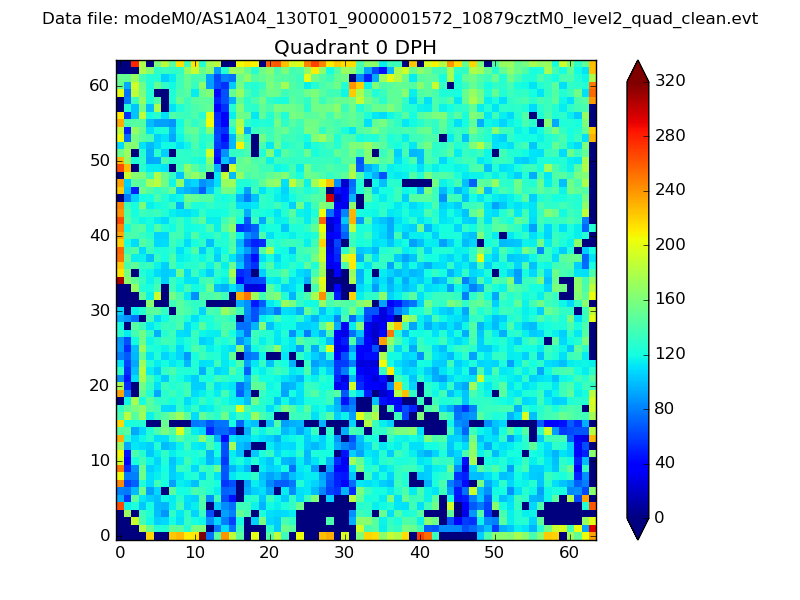 |
 |
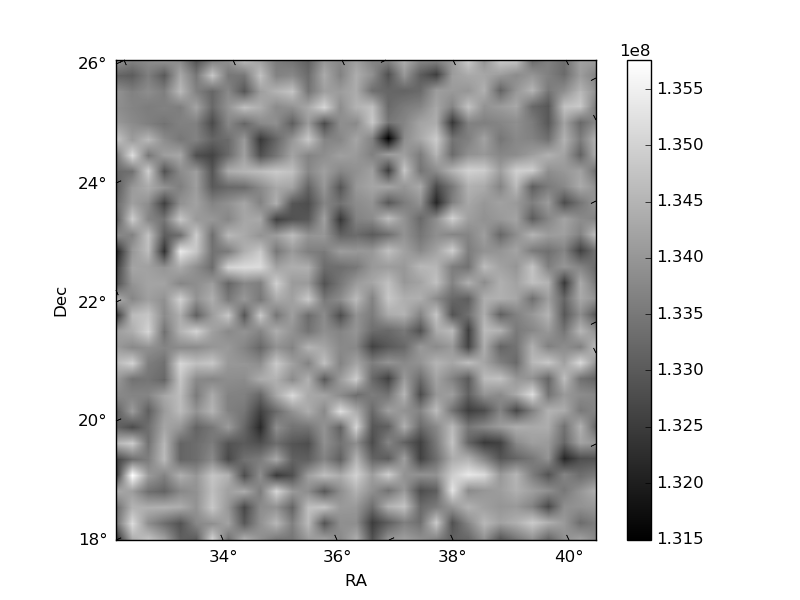
Quadrant B |
|---|---|---|---|
| Quadrant D | 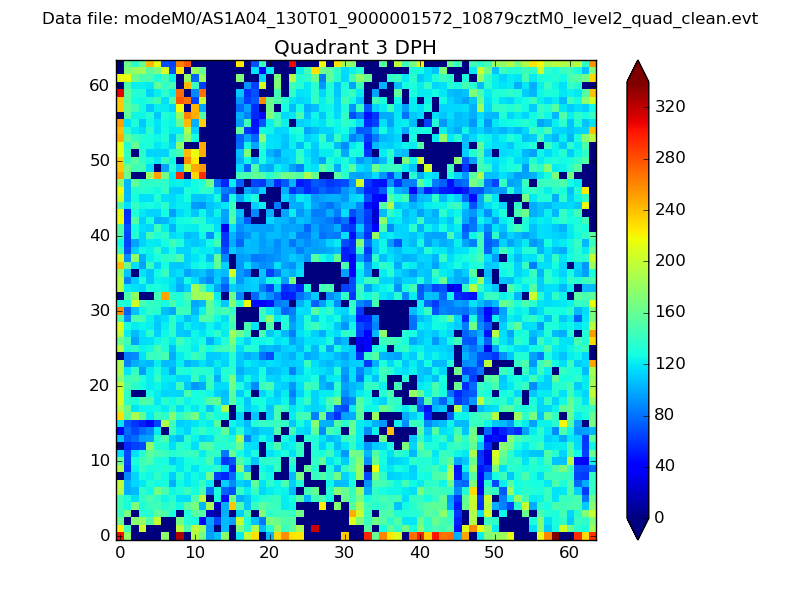 |
 |
Quadrant C |
| Plot type | Count rate plots | Images |
|---|---|---|
| Comparison with Poisson distribution Blue bars denote a histogram of data divided into 1 sec bins. Red curve is a Poisson curve with rate = median count rate of data. |
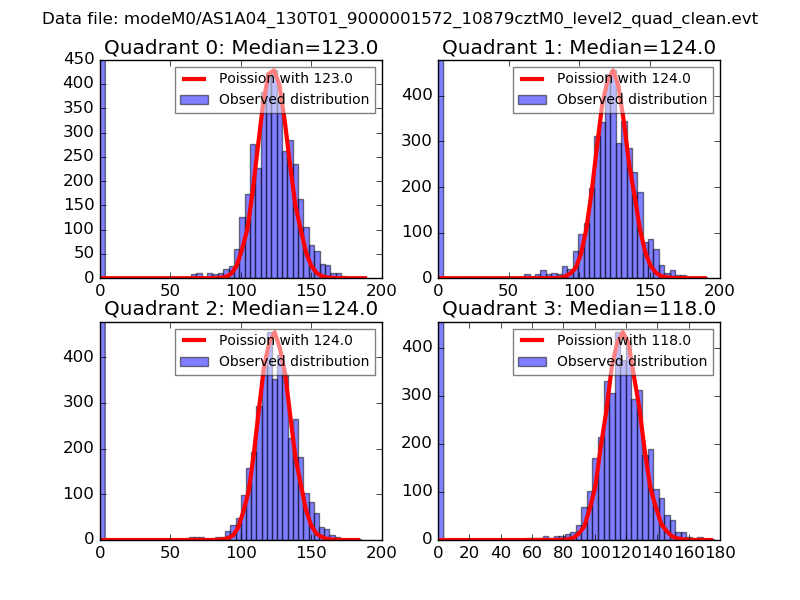 |
 |
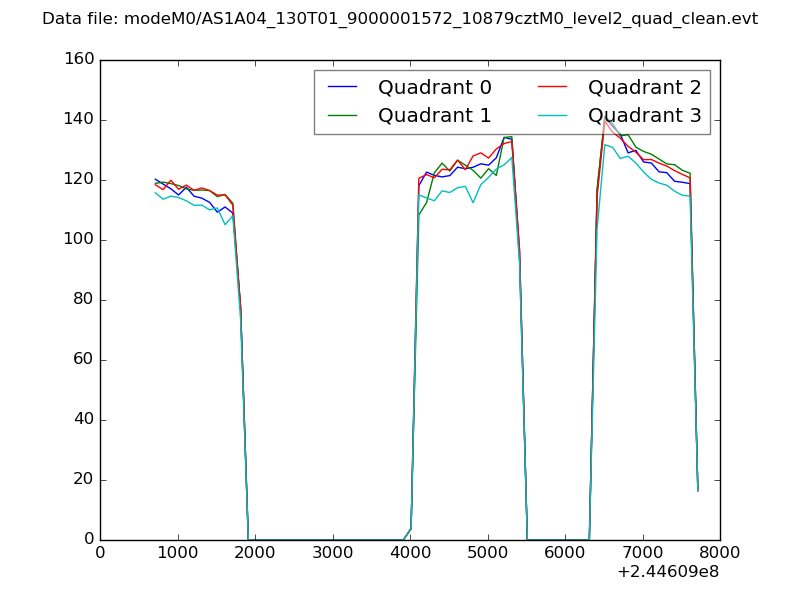
| Quadrant-wise count rates Data is divided into 100 sec bins |
 |
|
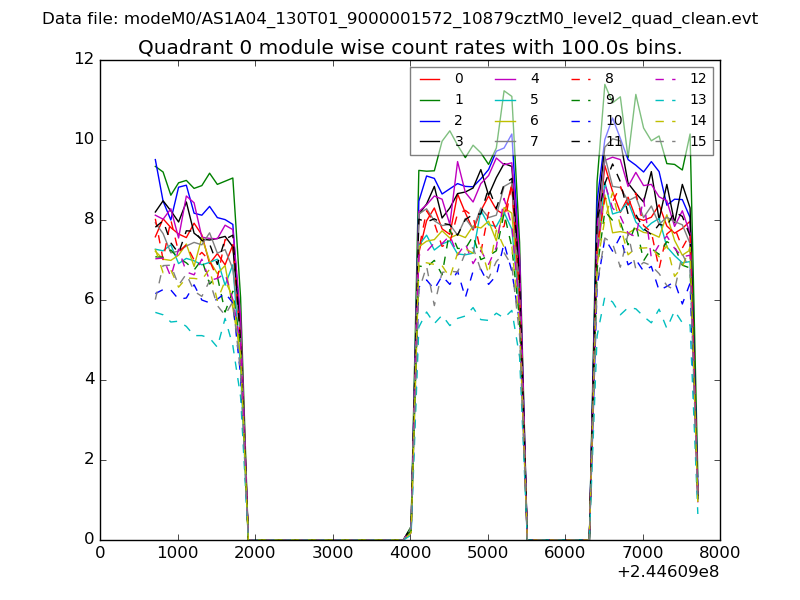
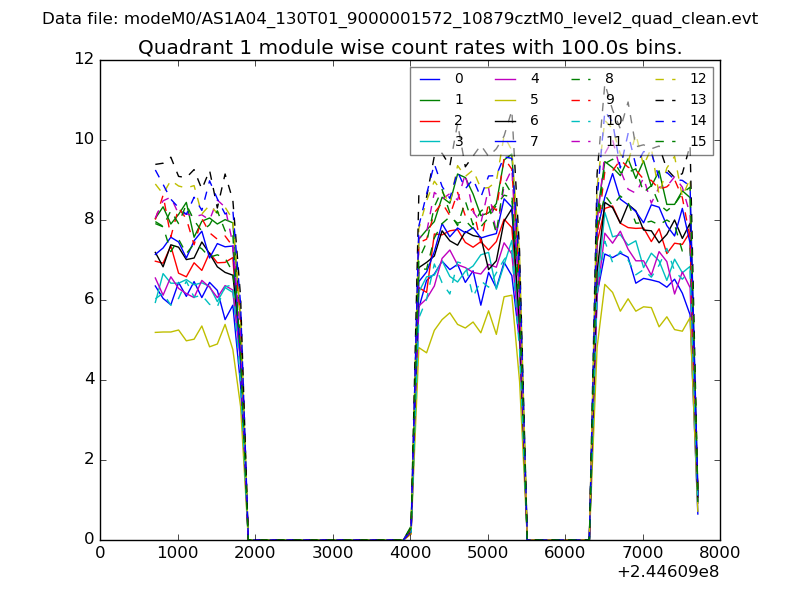
| Module-wise count rates for Quadrant A Data is divided into 100 sec bins |
 |
 |
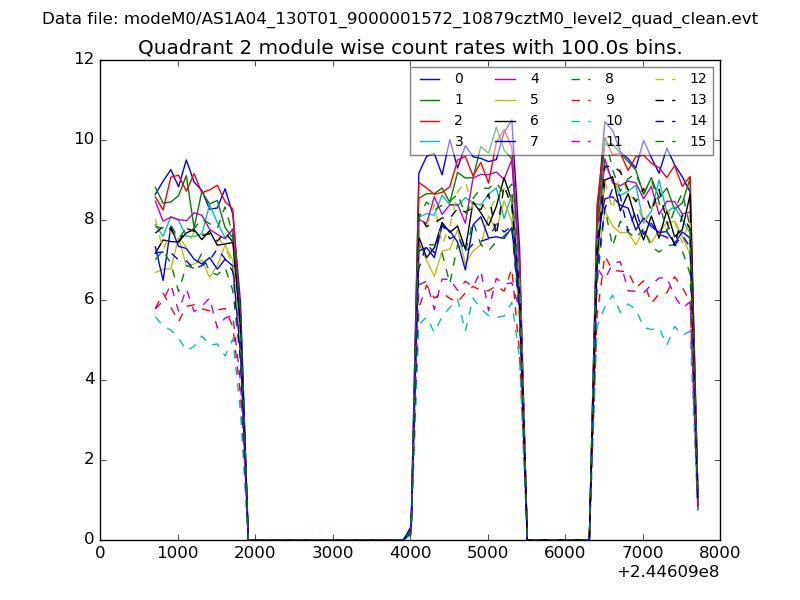
| Module-wise count rates for Quadrant B Data is divided into 100 sec bins |
 |
 |
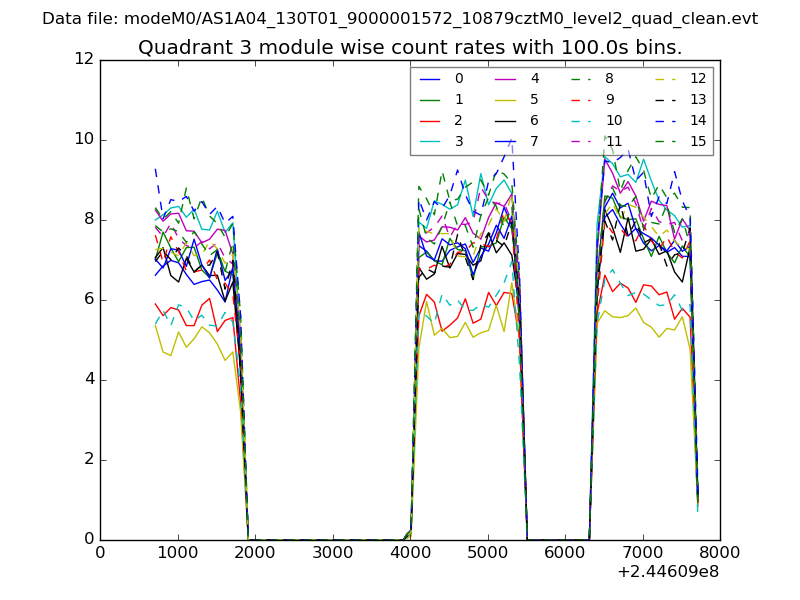
| Module-wise count rates for Quadrant C Data is divided into 100 sec bins |
 |
 |
| Module-wise count rates for Quadrant D Data is divided into 100 sec bins |
 |
 |
| Parameter | Plot |
|---|---|
| CZT HV Monitor | 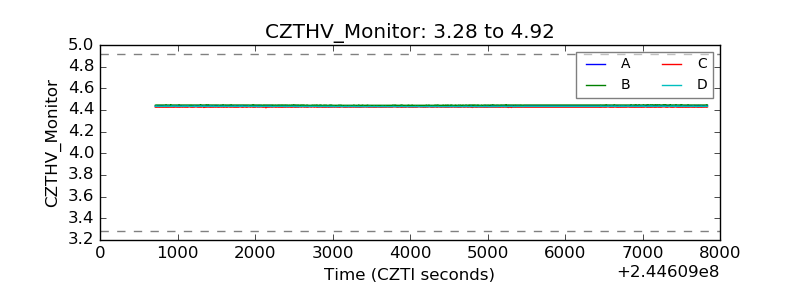 |
| D_VDD | 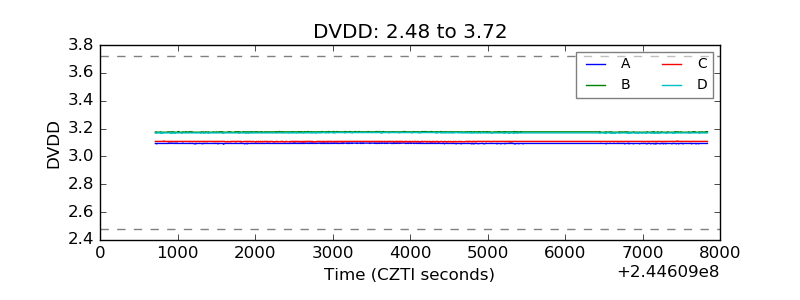 |
| Temperature 1 | 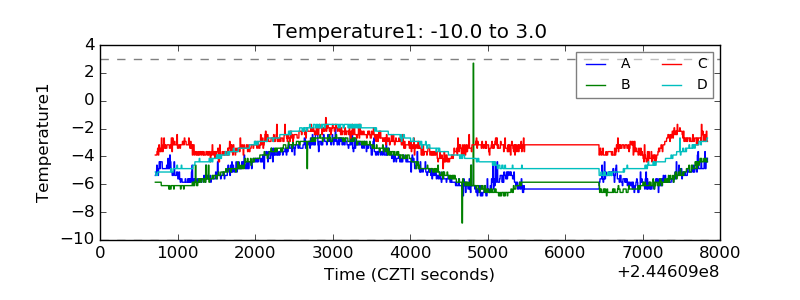 |
| Veto HV Monitor | 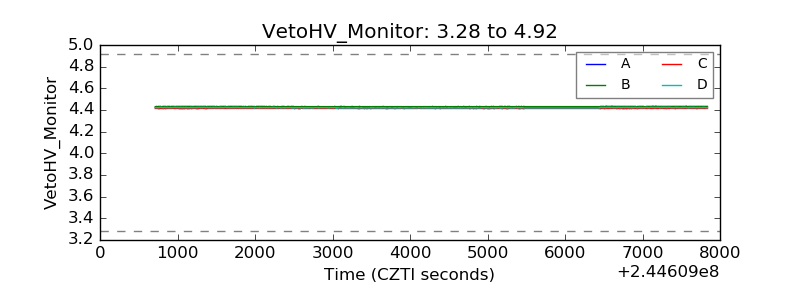 |
| Veto LLD | 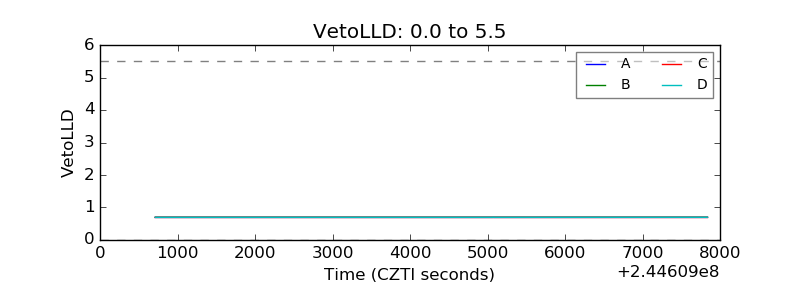 |
| Alpha Counter | 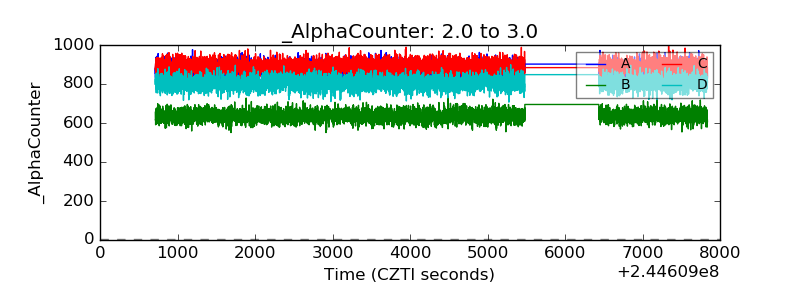 |
| _CPM_Rate | 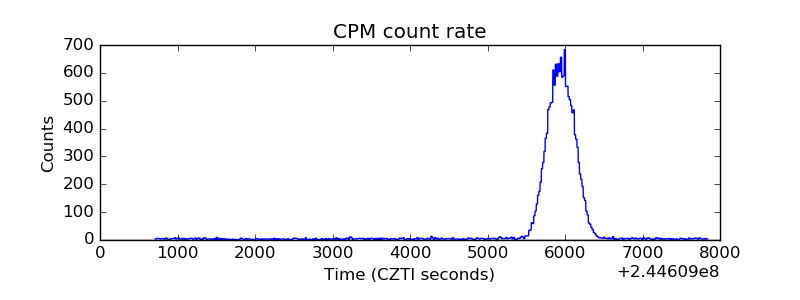 |
| CZT Counter | 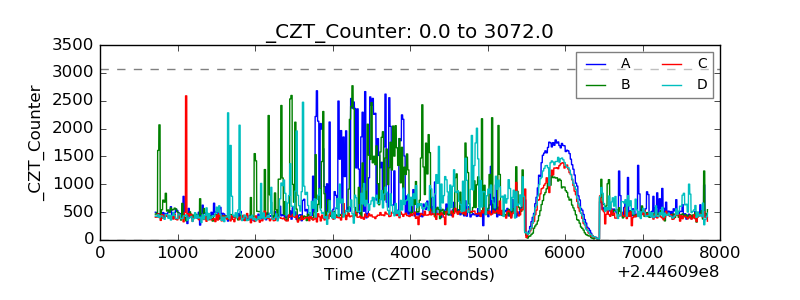 |
| +2.5 Volts monitor | 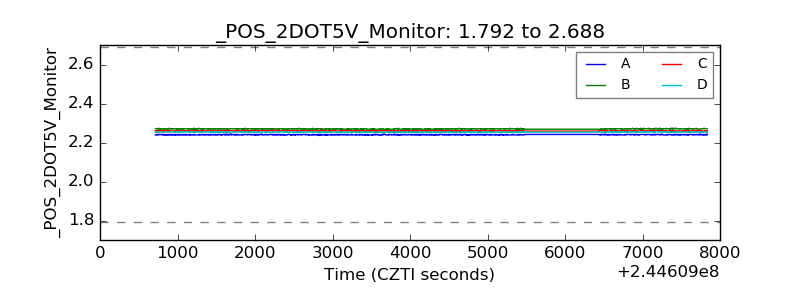 |
| +5 Volts monitor |  |
| _ROLL_ROT | 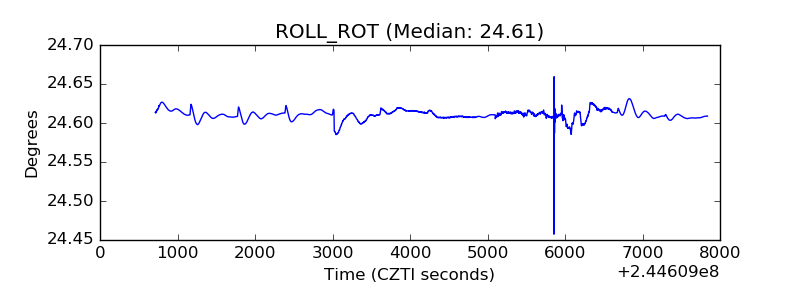 |
| _Roll_DEC | 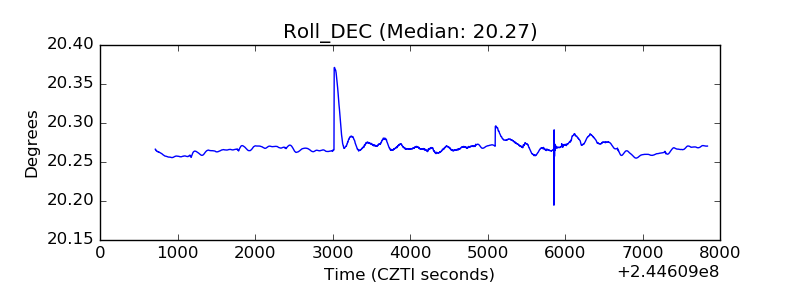 |
| _Roll_RA | 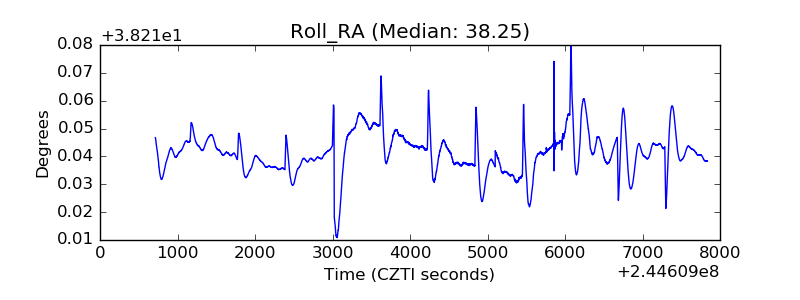 |
| Veto Counter | 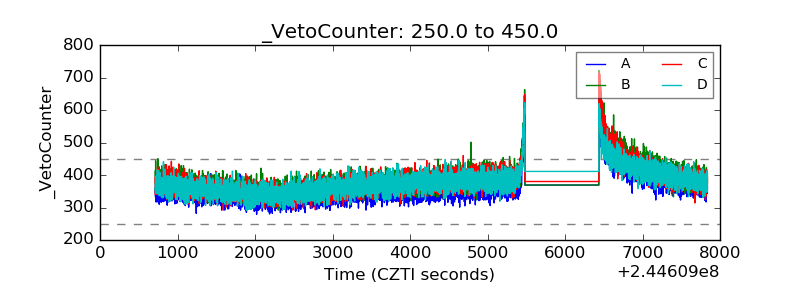 |