| Param | Original file | Final file |
|---|---|---|
| Filename | modeM0/AS1A04_130T01_9000001572_10881cztM0_level2.evt | modeM0/AS1A04_130T01_9000001572_10881cztM0_level2_quad_clean.evt |
| Size (bytes) | 337,743,360 | 46,324,800 |
| Size | 322.1 MB | 44.2 MB |
| Events in quadrant A | 2,370,486 | 273,124 |
| Events in quadrant B | 2,746,868 | 279,505 |
| Events in quadrant C | 1,952,450 | 276,298 |
| Events in quadrant D | 2,858,144 | 262,911 |
| Mode M9 | |||
|---|---|---|---|
| Quadrant | BADHDUFLAG | Total packets | Discarded packets |
| A | 0 | 5 | 0 |
| B | 0 | 5 | 0 |
| C | 0 | 5 | 0 |
| D | 0 | 6 | 0 |
| Mode SS | |||
|---|---|---|---|
| Quadrant | BADHDUFLAG | Total packets | Discarded packets |
| A | 0 | 88 | 0 |
| B | 0 | 88 | 0 |
| C | 0 | 88 | 0 |
| D | 0 | 88 | 0 |
| Mode M0 | |||
|---|---|---|---|
| Quadrant | BADHDUFLAG | Total packets | Discarded packets |
| A | 0 | 9863 | 1 |
| B | 0 | 11024 | 1 |
| C | 0 | 8906 | 1 |
| D | 0 | 11491 | 1 |
| Quadrant | Total seconds | Saturated seconds | Saturation percentage |
|---|---|---|---|
| A | 4415 | 75 | 1.698754% |
| B | 4415 | 166 | 3.759909% |
| C | 4415 | 5 | 0.113250% |
| D | 4415 | 71 | 1.608154% |
Noise dominated data is calculated using 1-second bins in cleaned event files. If a bin has >2000 counts, and if more than 50% of those come from <1% of pixels, then it is considered to be noise-dominated and hence unusable.
| Quadrant | # 1 sec bins | Bins with >0 counts | Bins with >2000 counts | High rate bins dominated by noise | Noise dominated (total time) | Noise dominated (detector-on time) | Marked lightcurve |
|---|---|---|---|---|---|---|---|
| A | 4415 | 4415 | 52 | 52 | 1.18% | 1.18% | 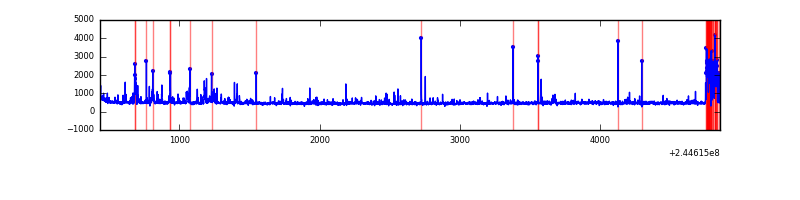 |
| B | 4415 | 4415 | 106 | 106 | 2.40% | 2.40% | 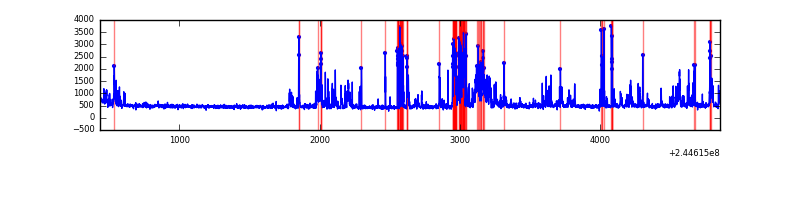 |
| C | 4415 | 4415 | 0 | 0 | 0.00% | 0.00% | 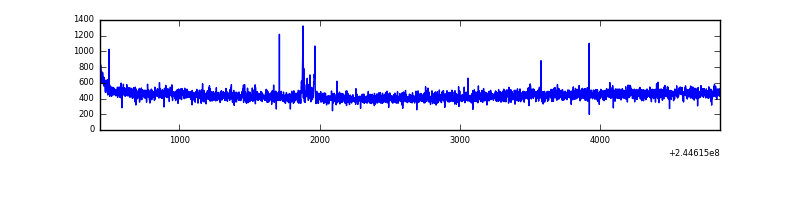 |
| D | 4415 | 4415 | 45 | 45 | 1.02% | 1.02% | 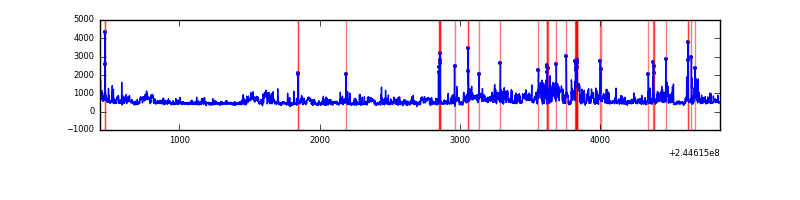 |
Top three noisy pixels from each quadrant. If the there are fewer than three noisy pixels in the level2.evt file, extra rows are filled as -1
| Pixel properties | Quadrant properties | ||||||
|---|---|---|---|---|---|---|---|
| Quadrant | DetID | PixID | Counts | Sigma | Mean | Median | Sigma |
| A | 8 | 5 | 248160 | 2345.12 | 513 | 502 | 105.6 |
| A | 15 | 223 | 75418 | 709.39 | 513 | 502 | 105.6 |
| A | 15 | 239 | 39334 | 367.71 | 513 | 502 | 105.6 |
| B | 4 | 239 | 754376 | 7625.76 | 506 | 493 | 98.9 |
| B | 12 | 111 | 10904 | 105.31 | 506 | 493 | 98.9 |
| B | 0 | 187 | 10418 | 100.39 | 506 | 493 | 98.9 |
| C | 12 | 4 | 15692 | 130.76 | 496 | 499 | 116.2 |
| C | 13 | 61 | 3702 | 27.57 | 496 | 499 | 116.2 |
| C | 14 | 234 | 1354 | 7.36 | 496 | 499 | 116.2 |
| D | 1 | 52 | 645115 | 5345.39 | 495 | 481 | 120.6 |
| D | 5 | 222 | 137291 | 1134.45 | 495 | 481 | 120.6 |
| D | 13 | 138 | 62889 | 517.5 | 495 | 481 | 120.6 |
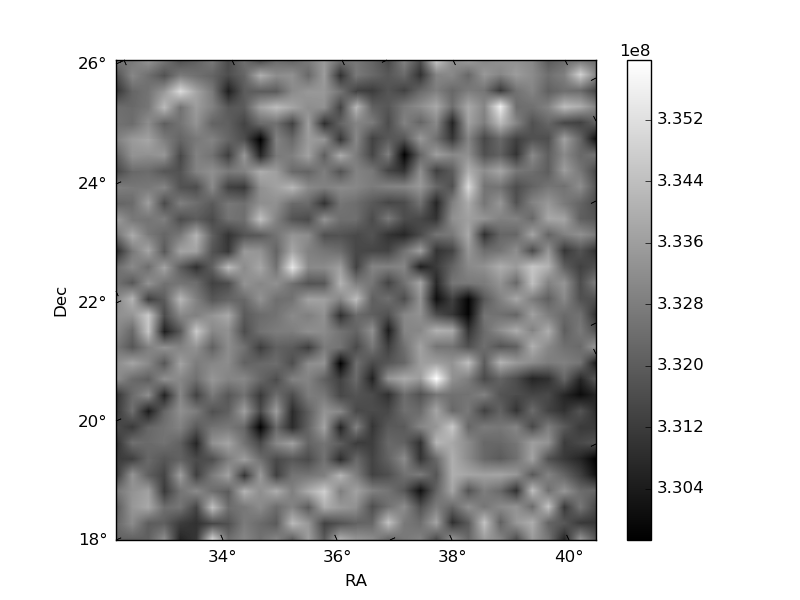
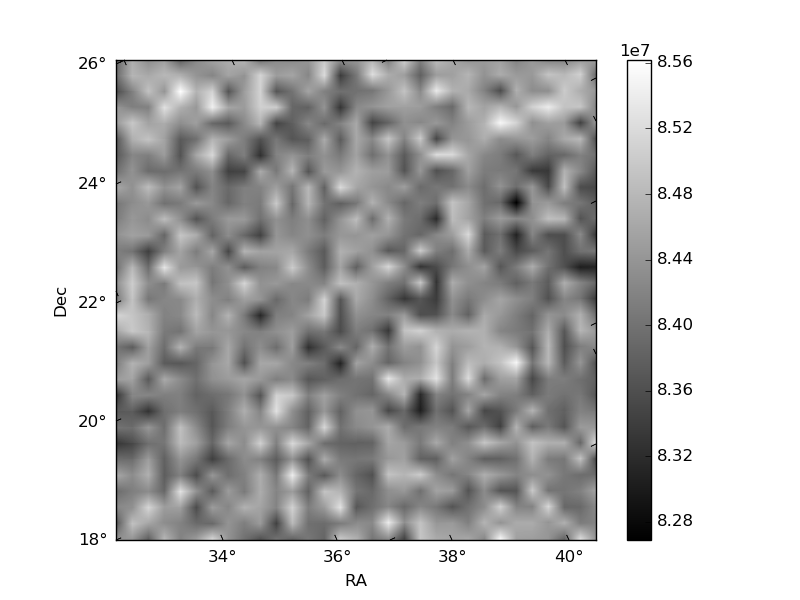
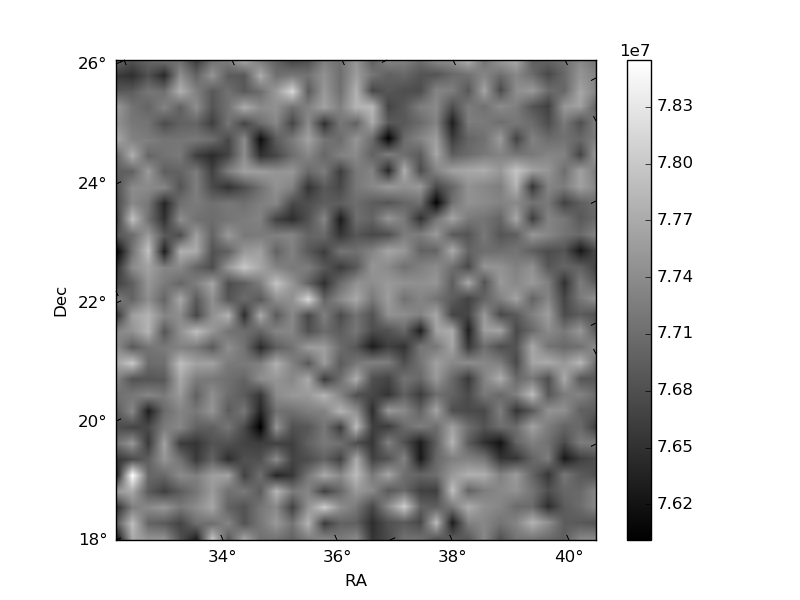
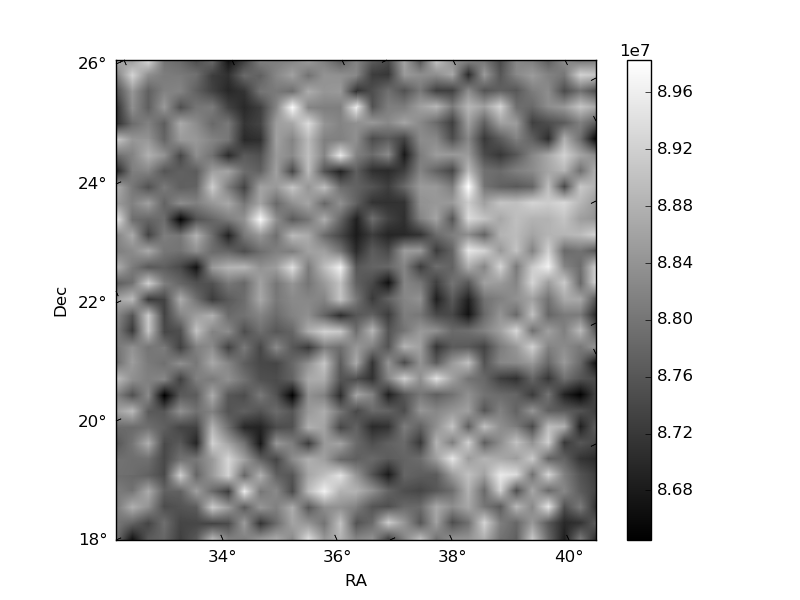
Histogram calculated using DETX and DETY for each event in the final _common_clean file
| Quadrant A | 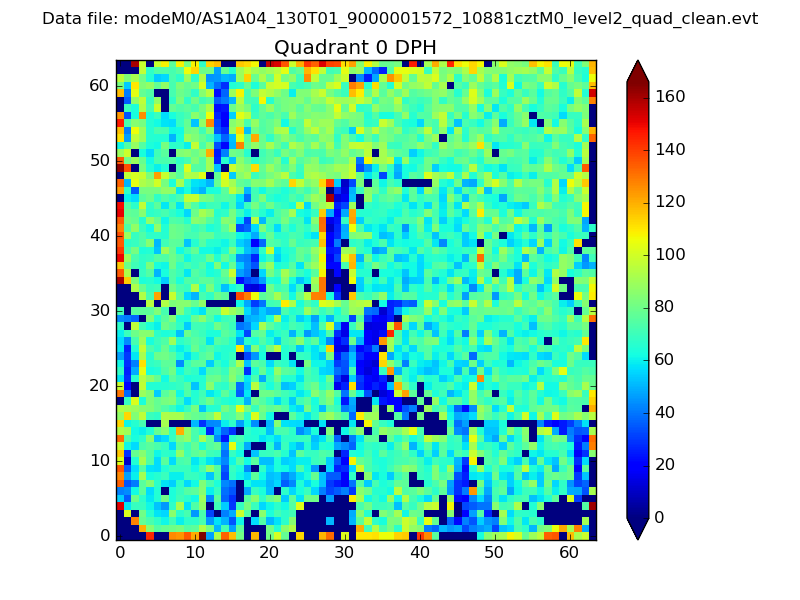 |
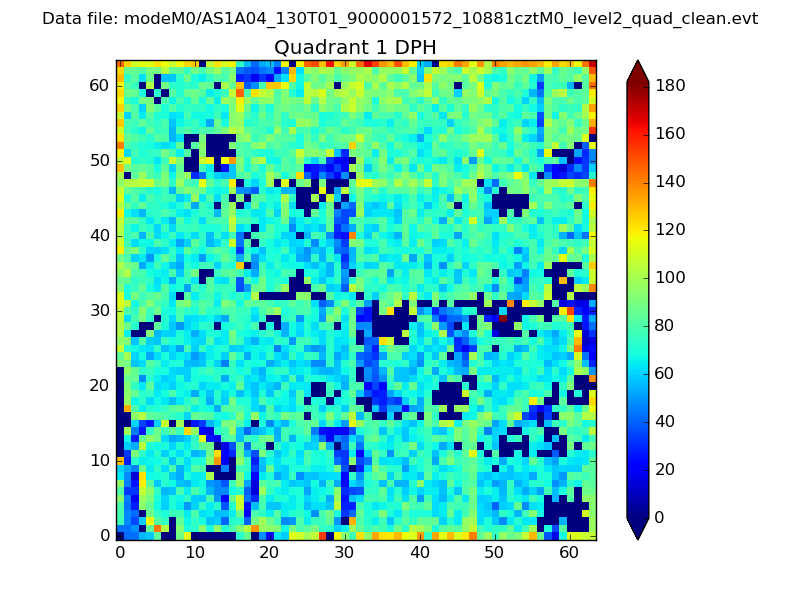 |
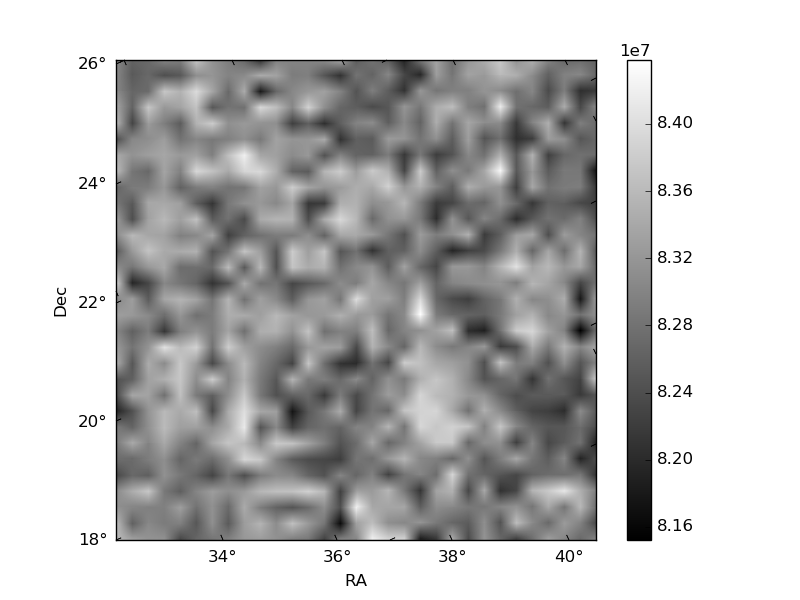
Quadrant B |
|---|---|---|---|
| Quadrant D | 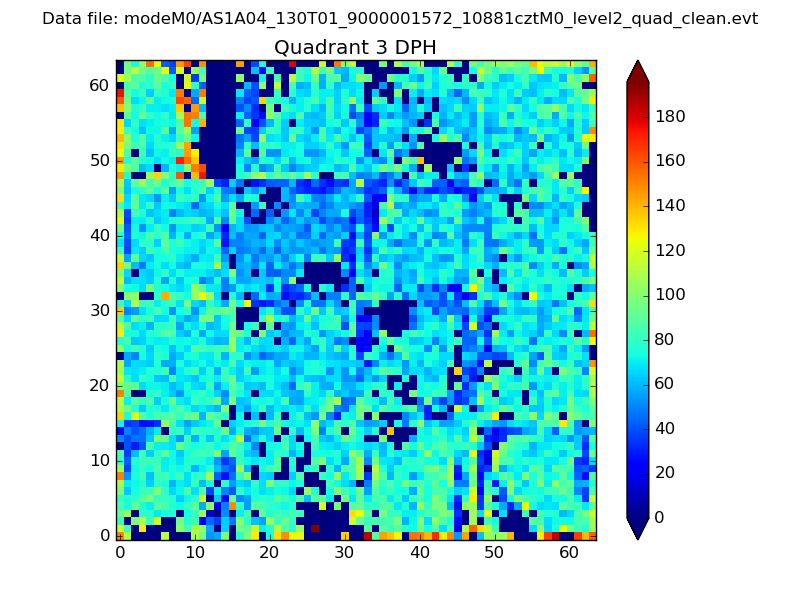 |
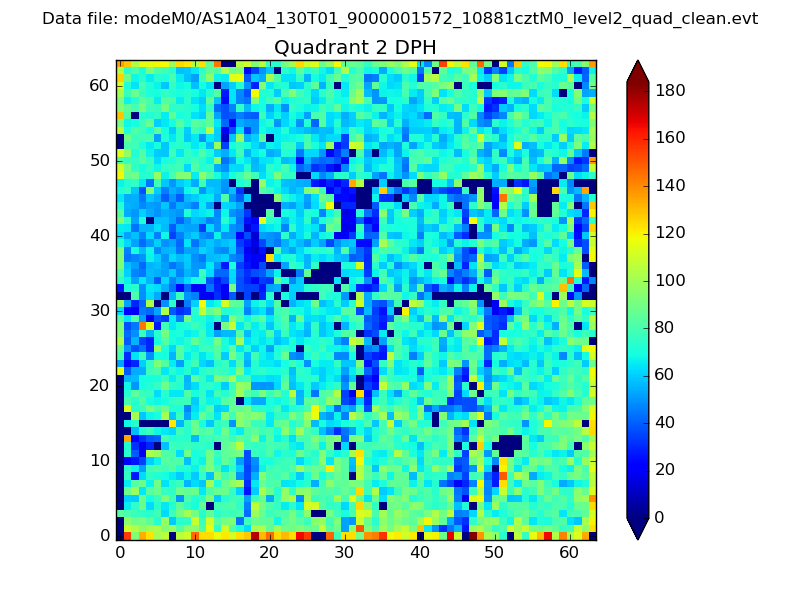 |
Quadrant C |
| Plot type | Count rate plots | Images |
|---|---|---|
| Comparison with Poisson distribution Blue bars denote a histogram of data divided into 1 sec bins. Red curve is a Poisson curve with rate = median count rate of data. |
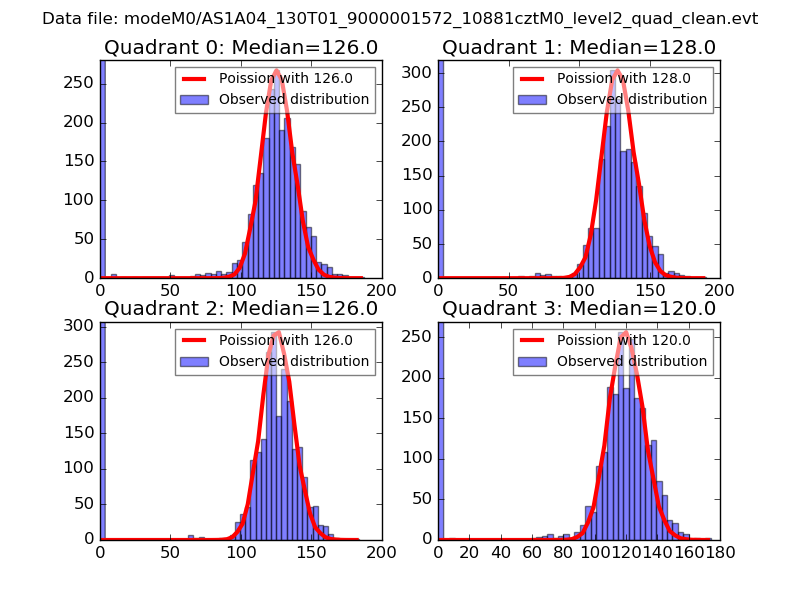 |
 |
| Quadrant-wise count rates Data is divided into 100 sec bins |
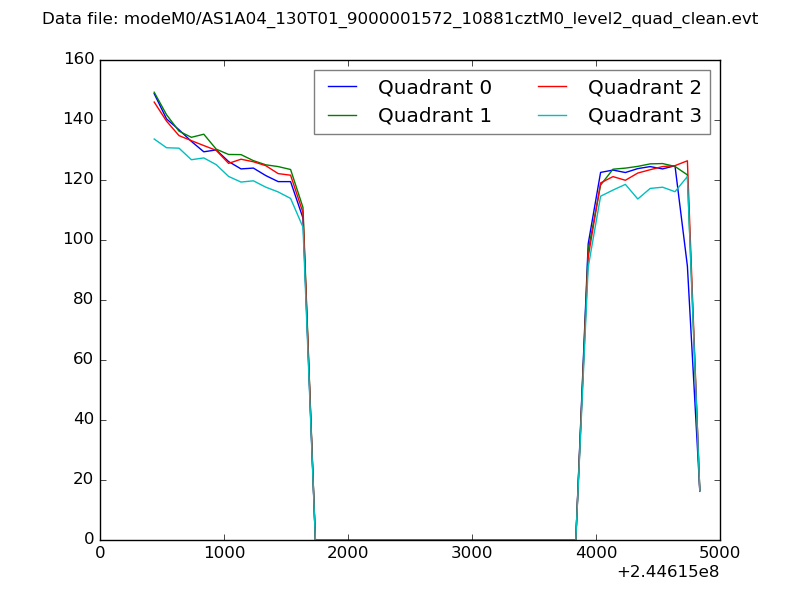 |
|
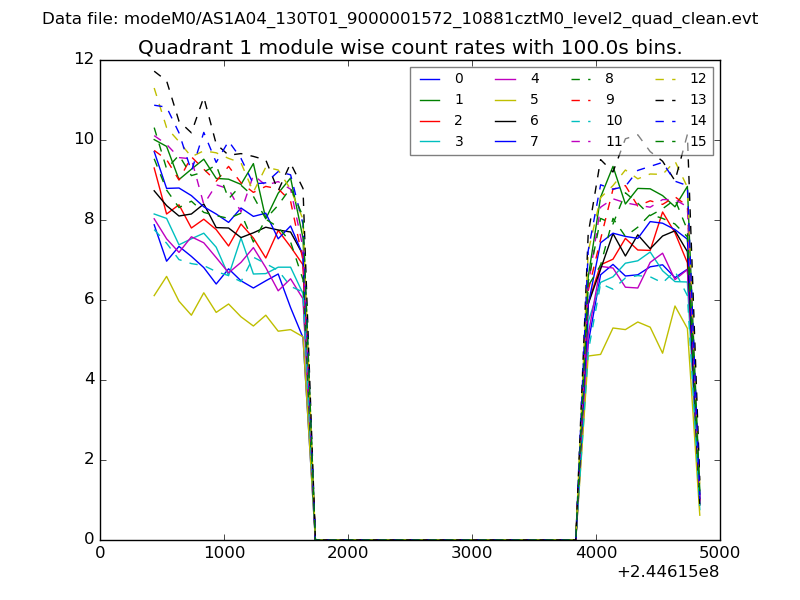
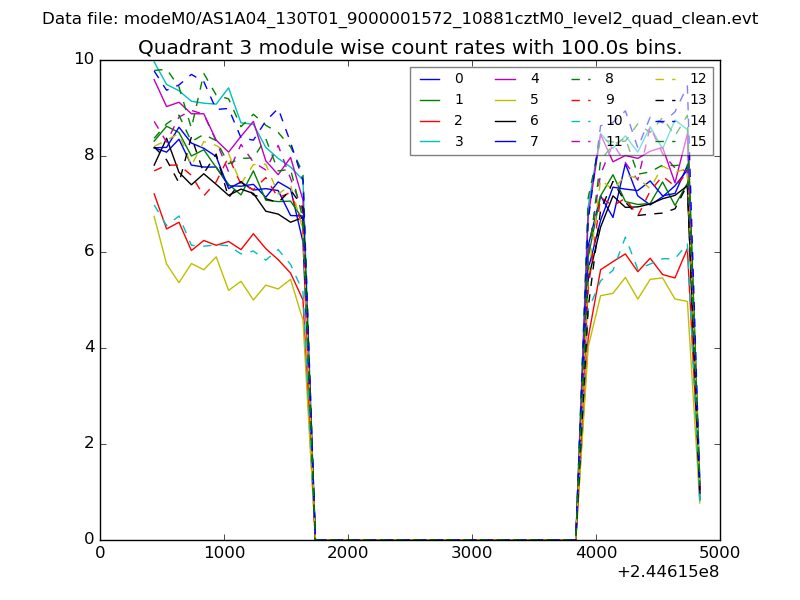
| Module-wise count rates for Quadrant A Data is divided into 100 sec bins |
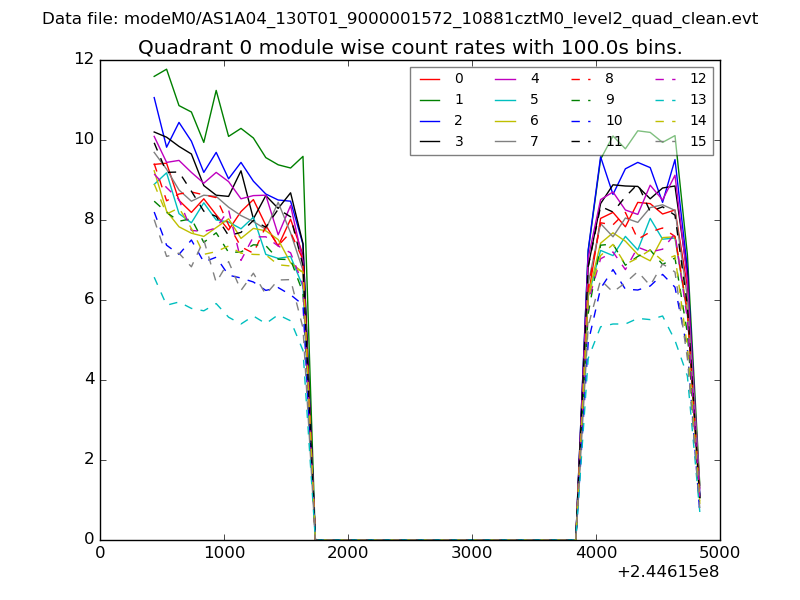 |
 |
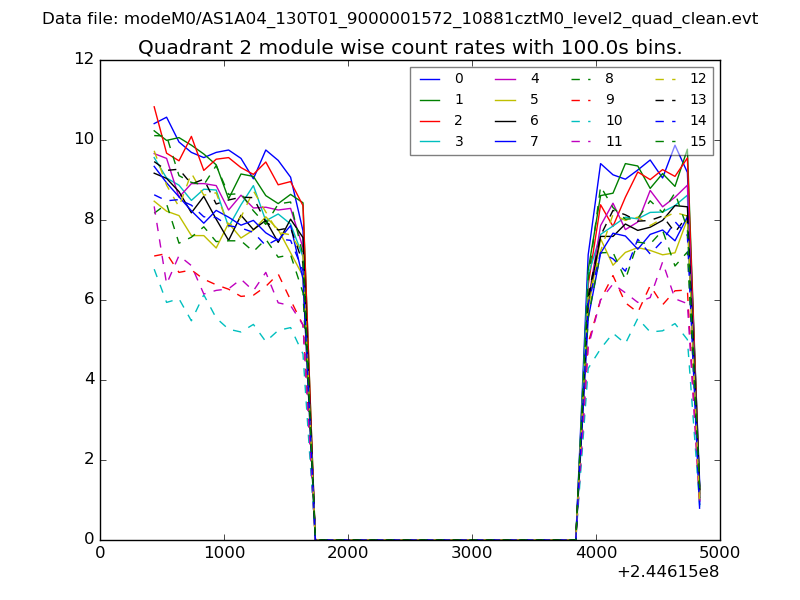
| Module-wise count rates for Quadrant B Data is divided into 100 sec bins |
 |
 |
| Module-wise count rates for Quadrant C Data is divided into 100 sec bins |
 |
 |
| Module-wise count rates for Quadrant D Data is divided into 100 sec bins |
 |
 |
| Parameter | Plot |
|---|---|
| CZT HV Monitor | 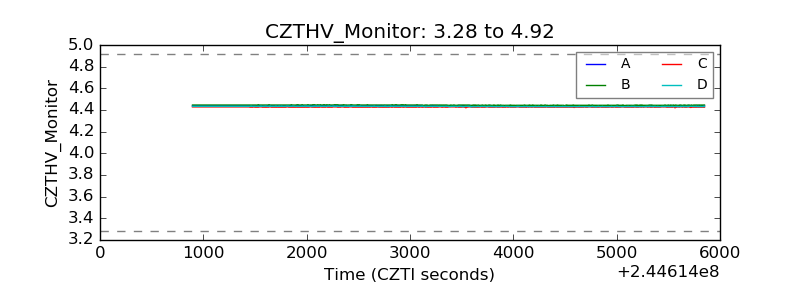 |
| D_VDD | 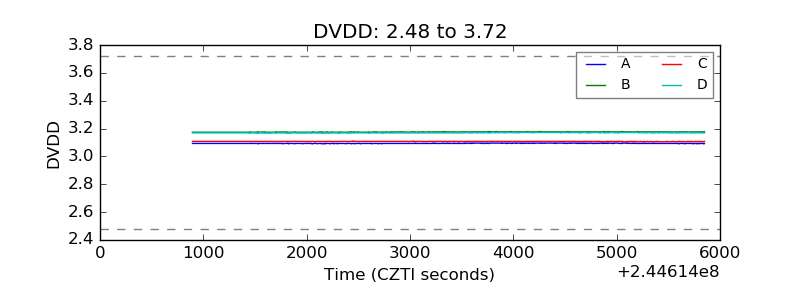 |
| Temperature 1 | 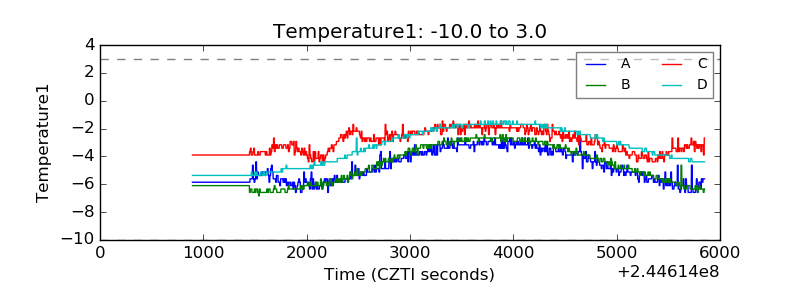 |
| Veto HV Monitor | 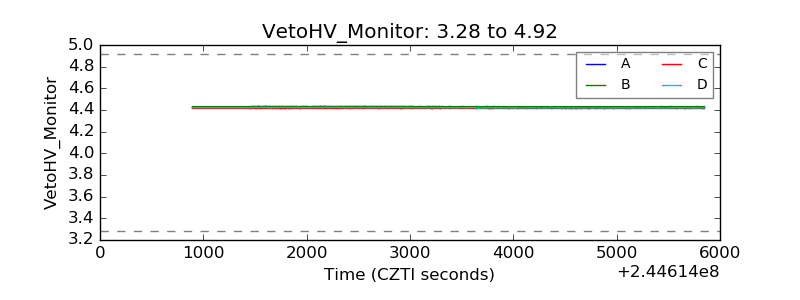 |
| Veto LLD | 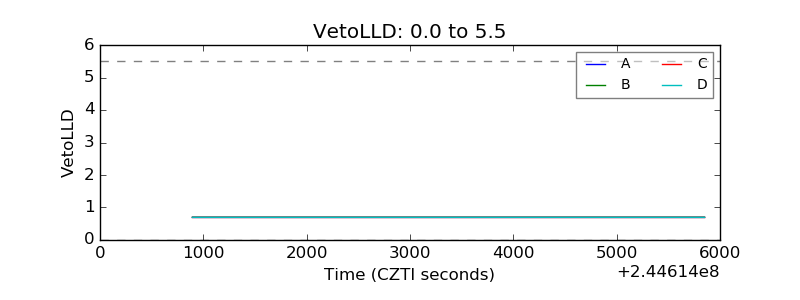 |
| Alpha Counter | 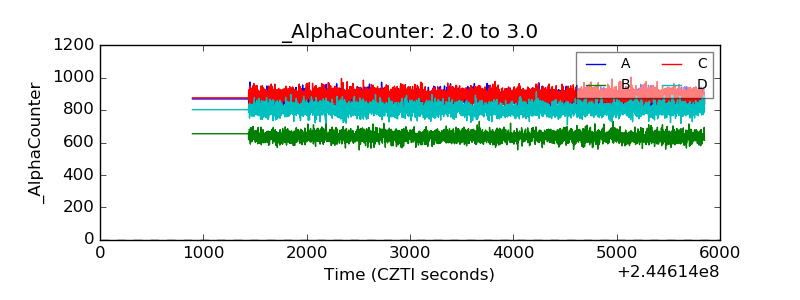 |
| _CPM_Rate | 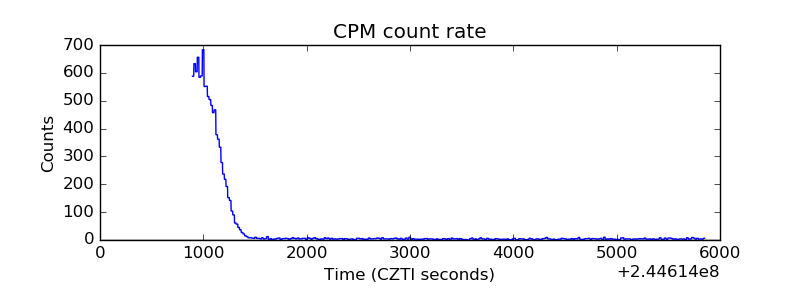 |
| CZT Counter | 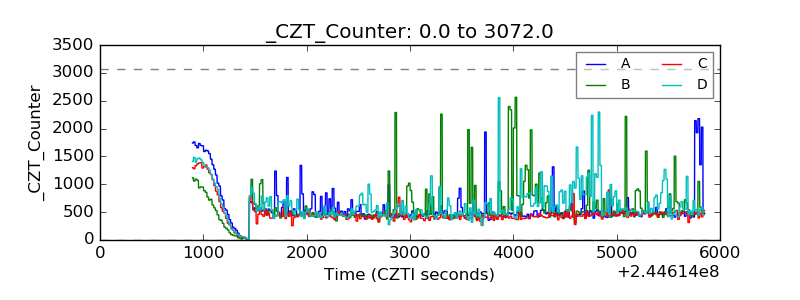 |
| +2.5 Volts monitor |  |
| +5 Volts monitor |  |
| _ROLL_ROT | 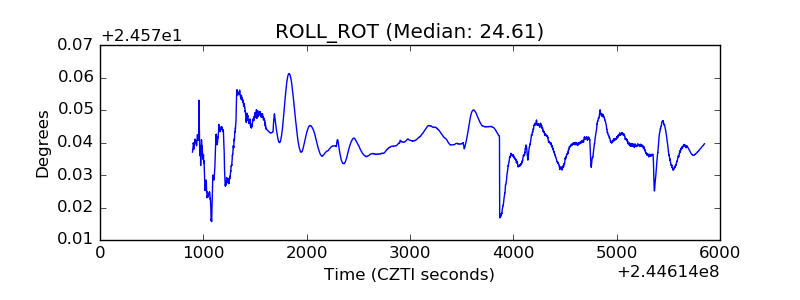 |
| _Roll_DEC | 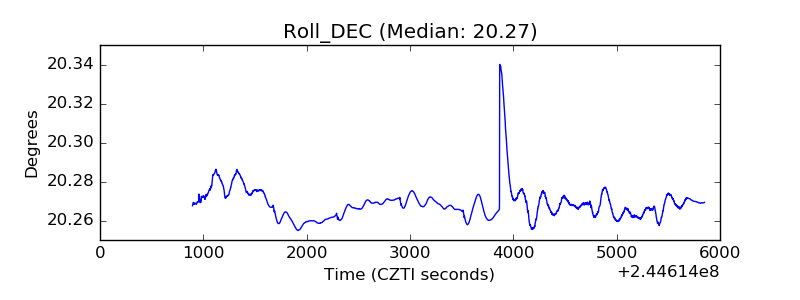 |
| _Roll_RA | 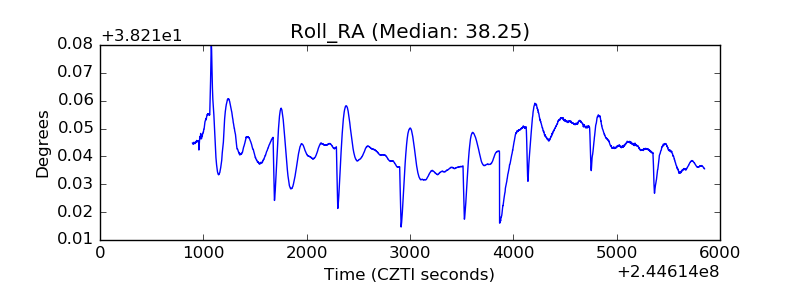 |
| Veto Counter |  |