| Param | Original file | Final file |
|---|---|---|
| Filename | modeM0/AS1A04_055T01_9000001574cztM0_level2.fits | modeM0/AS1A04_055T01_9000001574cztM0_level2_quad_clean.evt |
| Size (bytes) | 771,275,520 | 848,096,640 |
| Size | 735.5 MB | 808.8 MB |
| Events in quadrant A | 4,553,610 | 4,989,789 |
| Events in quadrant B | 4,422,382 | 5,062,950 |
| Events in quadrant C | 4,657,332 | 5,238,189 |
| Events in quadrant D | 3,998,950 | 4,674,075 |
| Mode M0 | |||
|---|---|---|---|
| Quadrant | BADHDUFLAG | Total packets | Discarded packets |
| A | 0 | 233234 | 0 |
| B | 0 | 223787 | 0 |
| C | 0 | 173560 | 0 |
| D | 0 | 207827 | 0 |
| Mode M9 | |||
|---|---|---|---|
| Quadrant | BADHDUFLAG | Total packets | Discarded packets |
| A | 0 | 133 | 0 |
| B | 0 | 133 | 0 |
| C | 0 | 133 | 0 |
| D | 0 | 133 | 0 |
| Mode SS | |||
|---|---|---|---|
| Quadrant | BADHDUFLAG | Total packets | Discarded packets |
| A | 0 | 1702 | 0 |
| B | 0 | 1702 | 0 |
| C | 0 | 1702 | 0 |
| D | 0 | 1702 | 0 |
| Quadrant | Total seconds | Saturated seconds | Saturation percentage |
|---|---|---|---|
| A | 83427 | 5977 | 7.164347% |
| B | 83427 | 5588 | 6.698071% |
| C | 83427 | 754 | 0.903784% |
| D | 83427 | 2844 | 3.408968% |
Noise dominated data is calculated using 1-second bins in cleaned event files. If a bin has >2000 counts, and if more than 50% of those come from <1% of pixels, then it is considered to be noise-dominated and hence unusable.
| Quadrant | # 1 sec bins | Bins with >0 counts | Bins with >2000 counts | High rate bins dominated by noise | Noise dominated (total time) | Noise dominated (detector-on time) | Marked lightcurve |
|---|---|---|---|---|---|---|---|
| A | 96586 | 83195 | 0 | 0 | 0.00% | 0.00% | 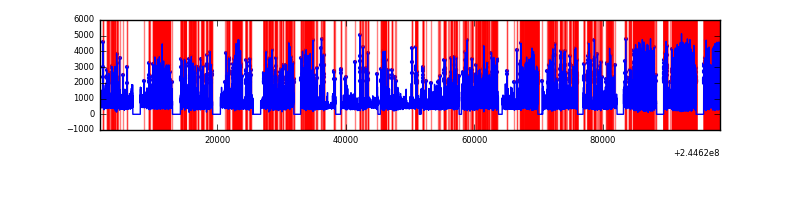 |
| B | 96587 | 83411 | 0 | 0 | 0.00% | 0.00% | 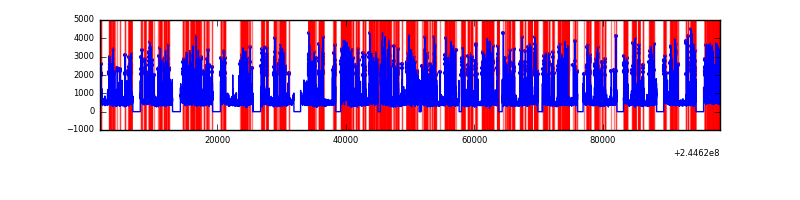 |
| C | 96587 | 83422 | 0 | 0 | 0.00% | 0.00% |  |
| D | 96587 | 83157 | 0 | 0 | 0.00% | 0.00% |  |
Top three noisy pixels from each quadrant. If the there are fewer than three noisy pixels in the level2.evt file, extra rows are filled as -1
| Pixel properties | Quadrant properties | ||||||
|---|---|---|---|---|---|---|---|
| Quadrant | DetID | PixID | Counts | Sigma | Mean | Median | Sigma |
| A | 0 | 29 | 4393 | 11.08 | 1187 | 1112 | 296.1 |
| A | 7 | 110 | 3683 | 8.68 | 1187 | 1112 | 296.1 |
| A | 0 | 30 | 3440 | 7.86 | 1187 | 1112 | 296.1 |
| B | 2 | 9 | 3836 | 11.9 | 1167 | 1116 | 228.6 |
| B | 12 | 226 | 3079 | 8.59 | 1167 | 1116 | 228.6 |
| B | 14 | 254 | 3019 | 8.33 | 1167 | 1116 | 228.6 |
| C | 12 | 241 | 3367 | 7.04 | 1229 | 1148 | 315.2 |
| C | 2 | 191 | 3154 | 6.36 | 1229 | 1148 | 315.2 |
| C | 9 | 188 | 3066 | 6.08 | 1229 | 1148 | 315.2 |
| D | 6 | 231 | 2972 | 6.31 | 1142 | 1041 | 305.8 |
| D | 3 | 14 | 2952 | 6.25 | 1142 | 1041 | 305.8 |
| D | 1 | 19 | 2824 | 5.83 | 1142 | 1041 | 305.8 |
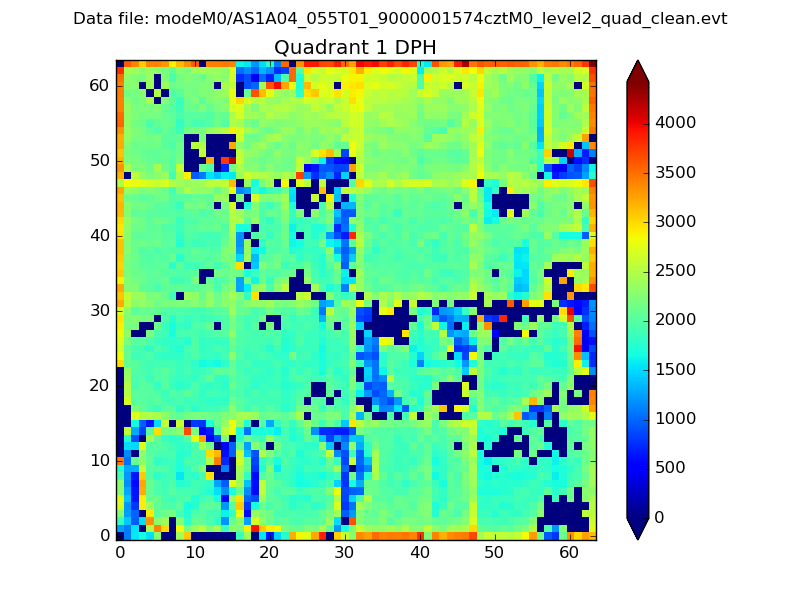
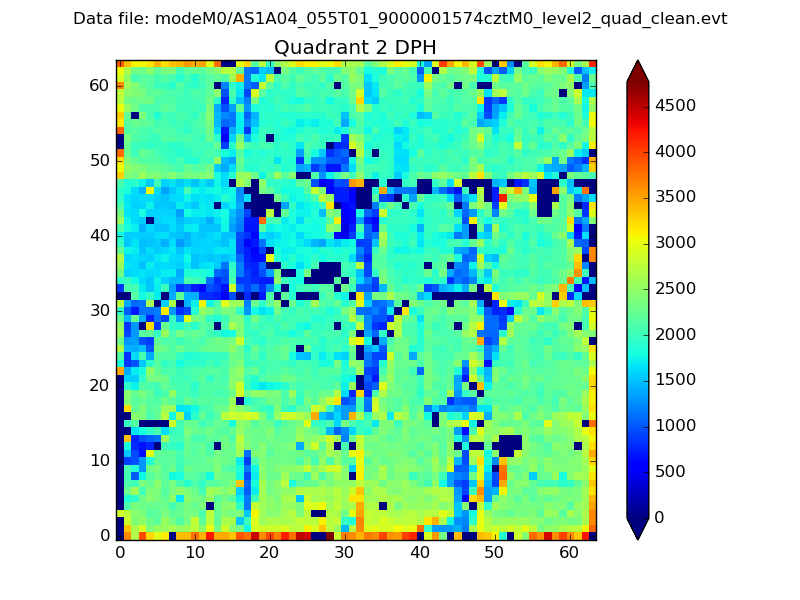
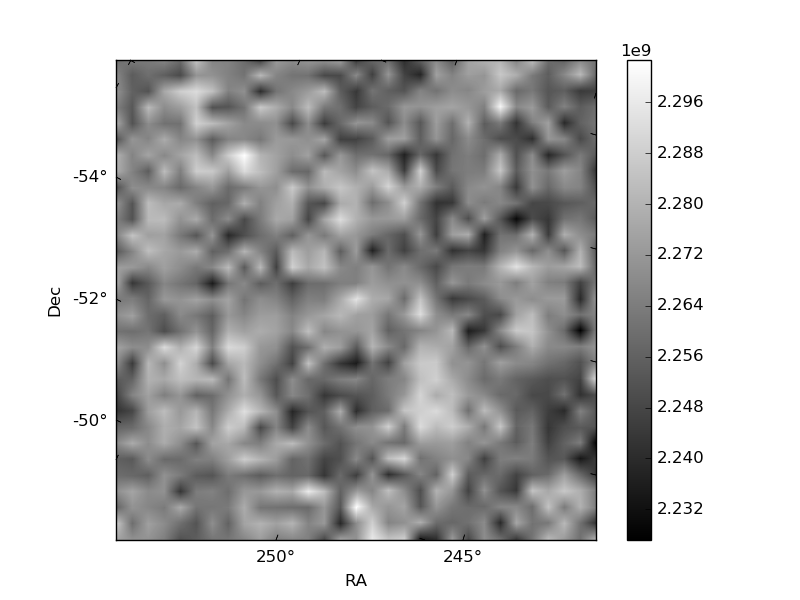
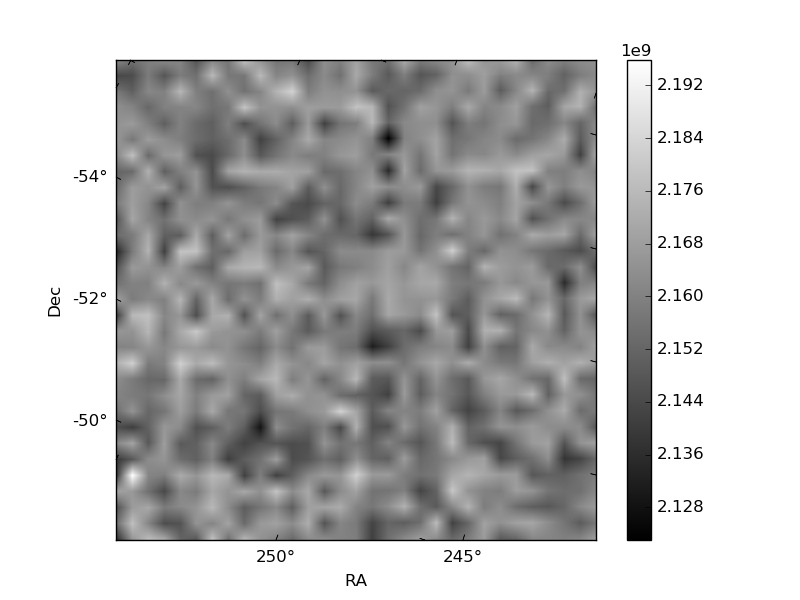
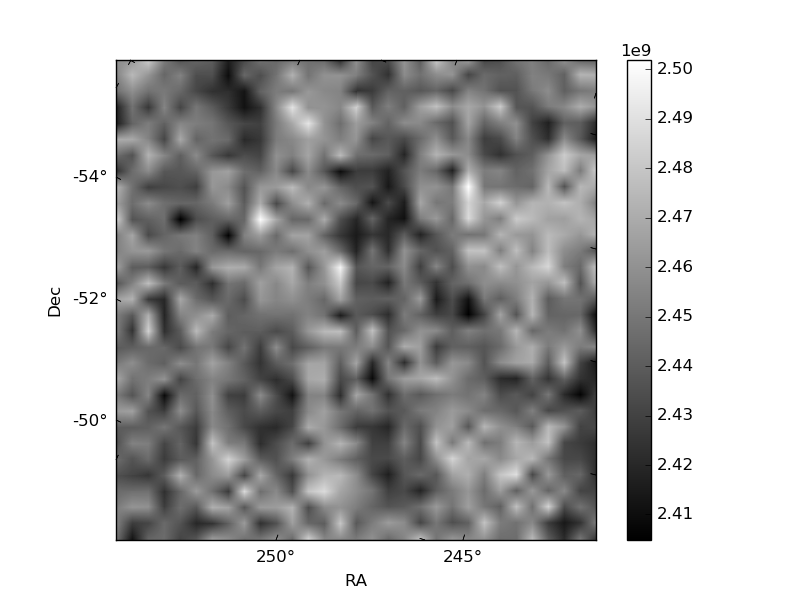
Histogram calculated using DETX and DETY for each event in the final _common_clean file
| Quadrant A | 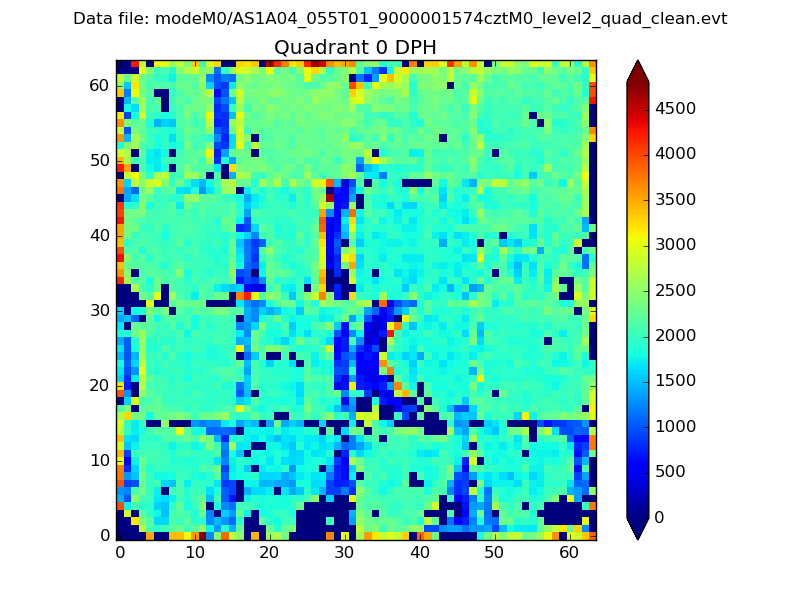 |
 |
Quadrant B |
|---|---|---|---|
| Quadrant D | 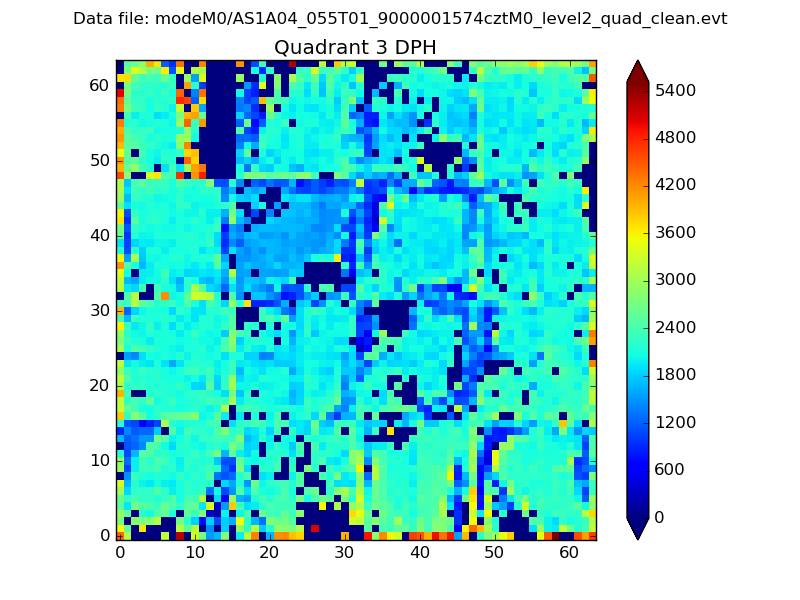 |
 |
Quadrant C |
| Plot type | Count rate plots | Images |
|---|---|---|
| Comparison with Poisson distribution Blue bars denote a histogram of data divided into 1 sec bins. Red curve is a Poisson curve with rate = median count rate of data. |
 |
 |
| Quadrant-wise count rates Data is divided into 100 sec bins |
 |
|
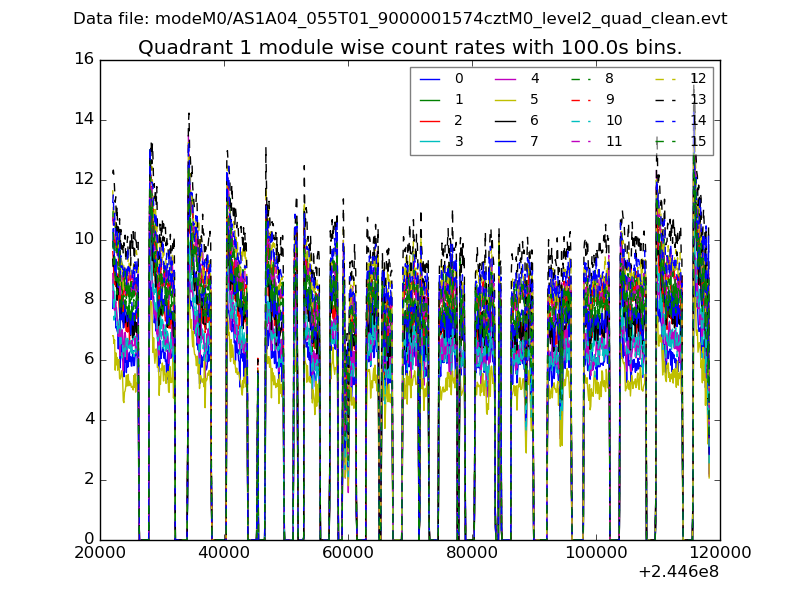
| Module-wise count rates for Quadrant A Data is divided into 100 sec bins |
 |
 |
| Module-wise count rates for Quadrant B Data is divided into 100 sec bins |
 |
 |
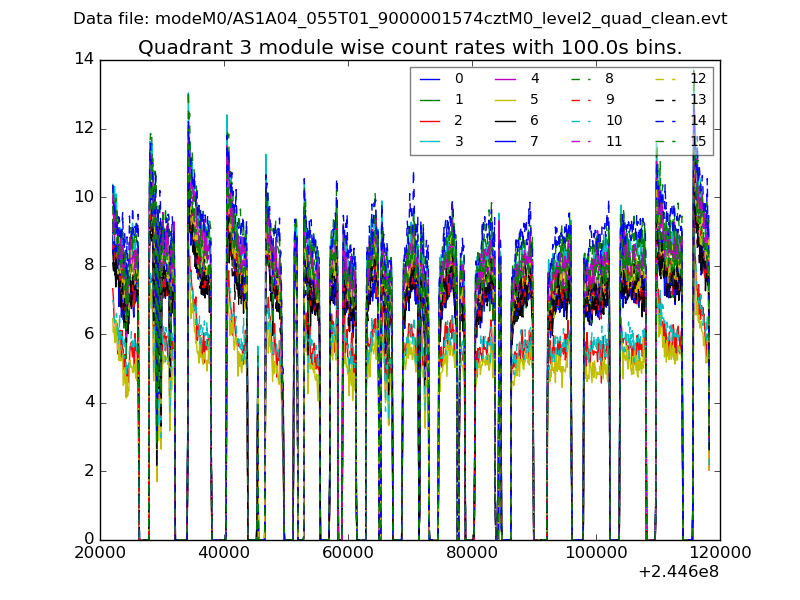
| Module-wise count rates for Quadrant C Data is divided into 100 sec bins |
 |
 |
| Module-wise count rates for Quadrant D Data is divided into 100 sec bins |
 |
 |
| Parameter | Plot |
|---|---|
| CZT HV Monitor | 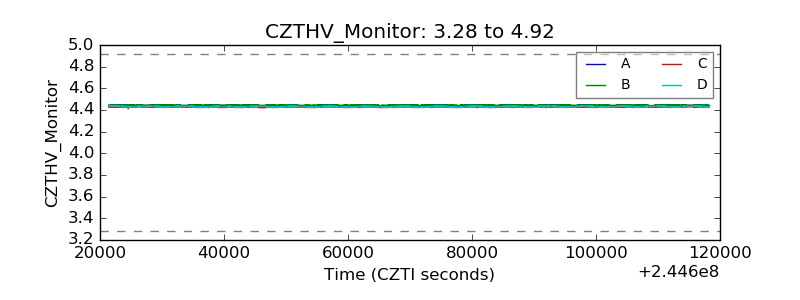 |
| D_VDD | 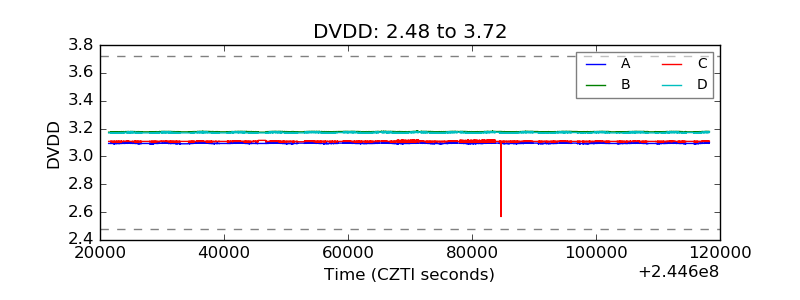 |
| Temperature 1 | 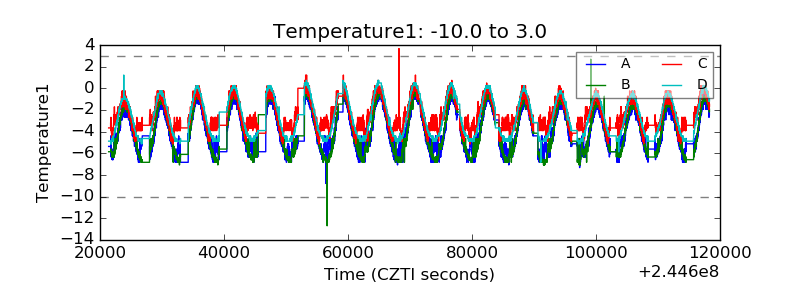 |
| Veto HV Monitor | 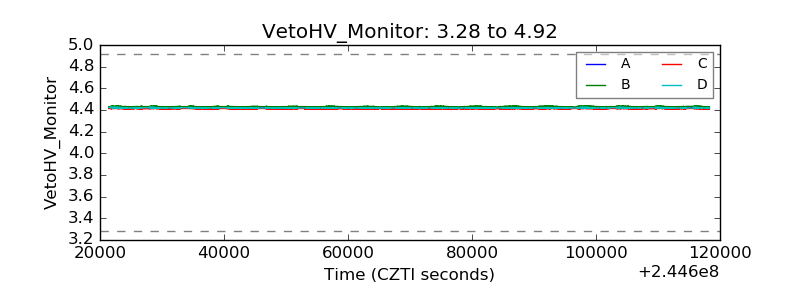 |
| Veto LLD | 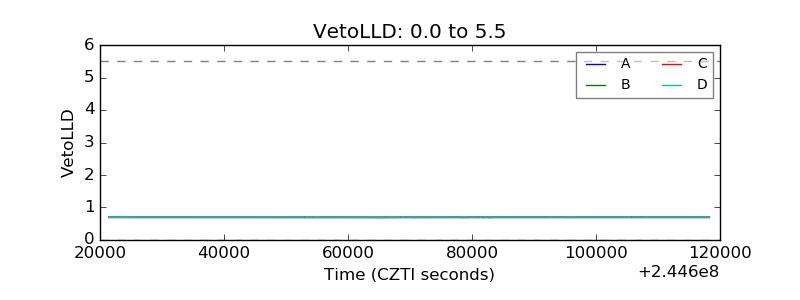 |
| Alpha Counter | 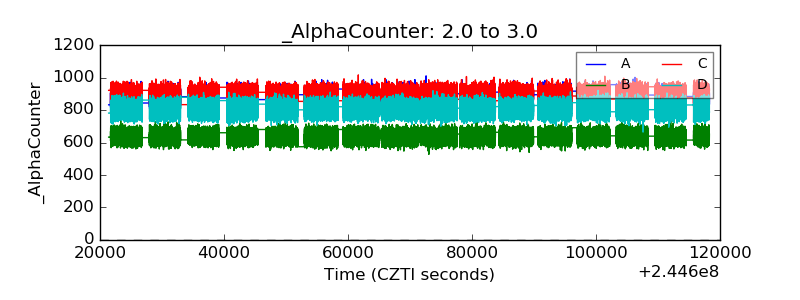 |
| _CPM_Rate | 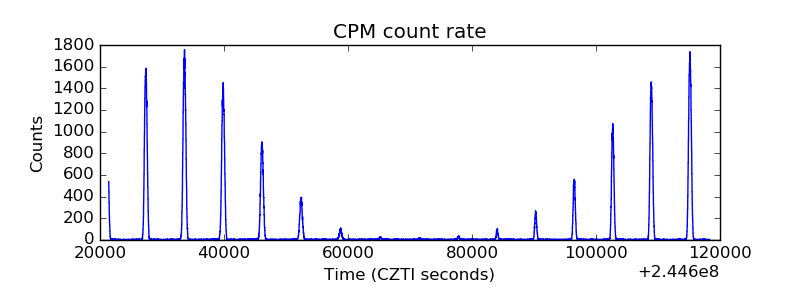 |
| CZT Counter |  |
| +2.5 Volts monitor |  |
| +5 Volts monitor |  |
| _ROLL_ROT | 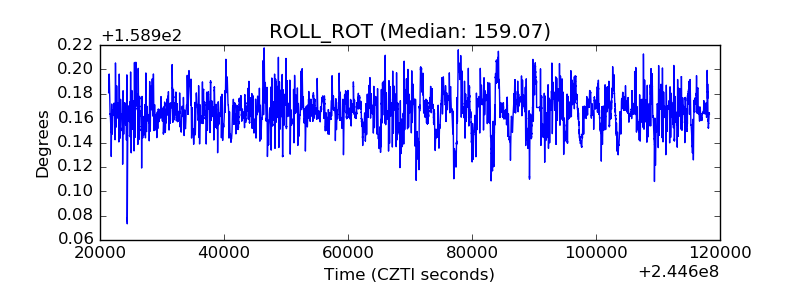 |
| _Roll_DEC | 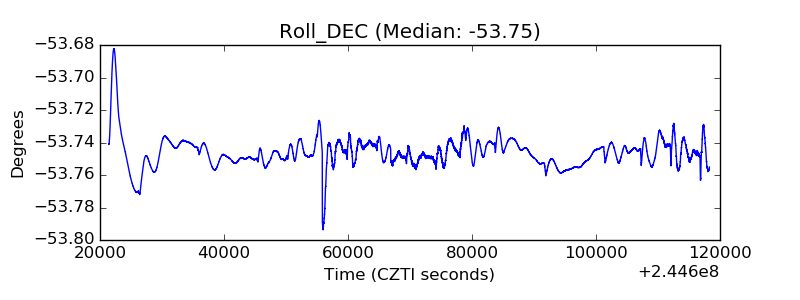 |
| _Roll_RA | 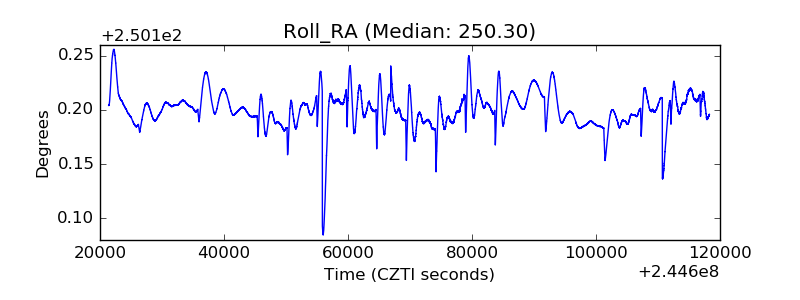 |
| Veto Counter |  |