| Param | Original file | Final file |
|---|---|---|
| Filename | modeM0/AS1A04_055T01_9000001574_10881cztM0_level2.evt | modeM0/AS1A04_055T01_9000001574_10881cztM0_level2_quad_clean.evt |
| Size (bytes) | 111,352,320 | 21,412,800 |
| Size | 106.2 MB | 20.4 MB |
| Events in quadrant A | 897,394 | 136,823 |
| Events in quadrant B | 788,831 | 142,904 |
| Events in quadrant C | 711,452 | 138,365 |
| Events in quadrant D | 881,890 | 130,579 |
| Mode M0 | |||
|---|---|---|---|
| Quadrant | BADHDUFLAG | Total packets | Discarded packets |
| A | 0 | 3543 | 2 |
| B | 0 | 3119 | 1 |
| C | 0 | 2863 | 1 |
| D | 0 | 3520 | 1 |
| Mode M9 | |||
|---|---|---|---|
| Quadrant | BADHDUFLAG | Total packets | Discarded packets |
| A | 0 | 4 | 0 |
| B | 0 | 4 | 0 |
| C | 0 | 4 | 0 |
| D | 0 | 4 | 0 |
| Mode SS | |||
|---|---|---|---|
| Quadrant | BADHDUFLAG | Total packets | Discarded packets |
| A | 0 | 26 | 0 |
| B | 0 | 26 | 0 |
| C | 0 | 26 | 0 |
| D | 0 | 26 | 0 |
| Quadrant | Total seconds | Saturated seconds | Saturation percentage |
|---|---|---|---|
| A | 1327 | 38 | 2.863602% |
| B | 1327 | 36 | 2.712886% |
| C | 1327 | 5 | 0.376790% |
| D | 1327 | 28 | 2.110023% |
Noise dominated data is calculated using 1-second bins in cleaned event files. If a bin has >2000 counts, and if more than 50% of those come from <1% of pixels, then it is considered to be noise-dominated and hence unusable.
| Quadrant | # 1 sec bins | Bins with >0 counts | Bins with >2000 counts | High rate bins dominated by noise | Noise dominated (total time) | Noise dominated (detector-on time) | Marked lightcurve |
|---|---|---|---|---|---|---|---|
| A | 1327 | 1327 | 10 | 10 | 0.75% | 0.75% | 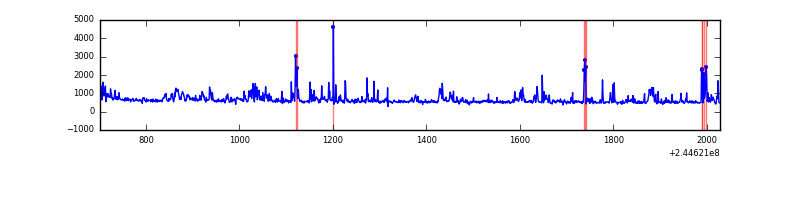 |
| B | 1327 | 1327 | 5 | 5 | 0.38% | 0.38% | 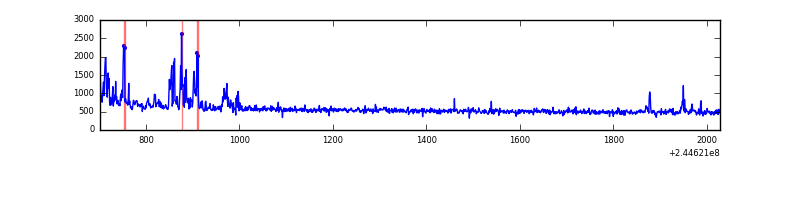 |
| C | 1327 | 1327 | 0 | 0 | 0.00% | 0.00% | 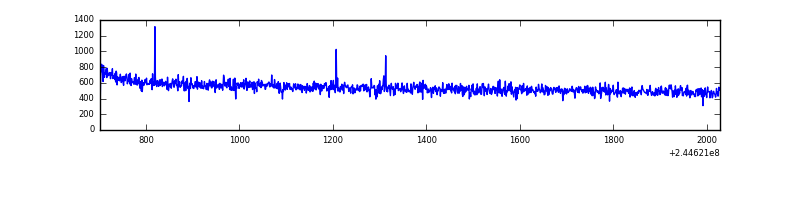 |
| D | 1327 | 1327 | 10 | 10 | 0.75% | 0.75% | 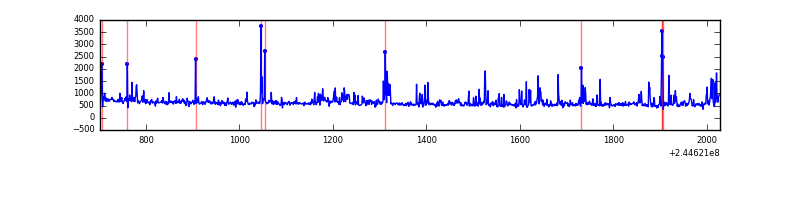 |
Top three noisy pixels from each quadrant. If the there are fewer than three noisy pixels in the level2.evt file, extra rows are filled as -1
| Pixel properties | Quadrant properties | ||||||
|---|---|---|---|---|---|---|---|
| Quadrant | DetID | PixID | Counts | Sigma | Mean | Median | Sigma |
| A | 8 | 5 | 157791 | 4136.42 | 182 | 178 | 38.1 |
| A | 15 | 223 | 25437 | 662.9 | 182 | 178 | 38.1 |
| A | 15 | 239 | 11538 | 298.13 | 182 | 178 | 38.1 |
| B | 4 | 239 | 82728 | 2316.24 | 181 | 176 | 35.6 |
| B | 12 | 111 | 3790 | 101.4 | 181 | 176 | 35.6 |
| B | 11 | 111 | 3222 | 85.46 | 181 | 176 | 35.6 |
| C | 14 | 234 | 2346 | 50.33 | 181 | 182 | 43.0 |
| C | 13 | 61 | 1314 | 26.33 | 181 | 182 | 43.0 |
| C | 12 | 4 | 840 | 15.3 | 181 | 182 | 43.0 |
| D | 1 | 52 | 128546 | 2941.03 | 178 | 173 | 43.6 |
| D | 8 | 195 | 39828 | 908.5 | 178 | 173 | 43.6 |
| D | 5 | 222 | 23869 | 542.88 | 178 | 173 | 43.6 |
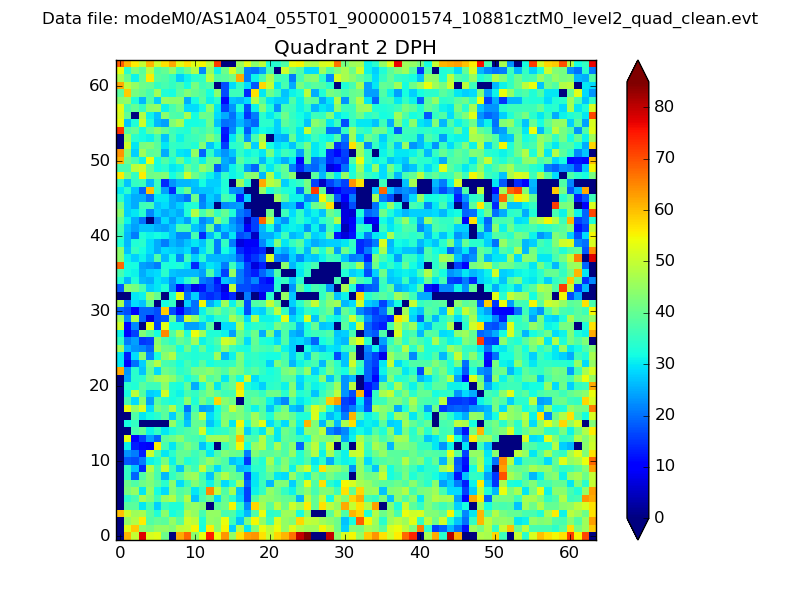
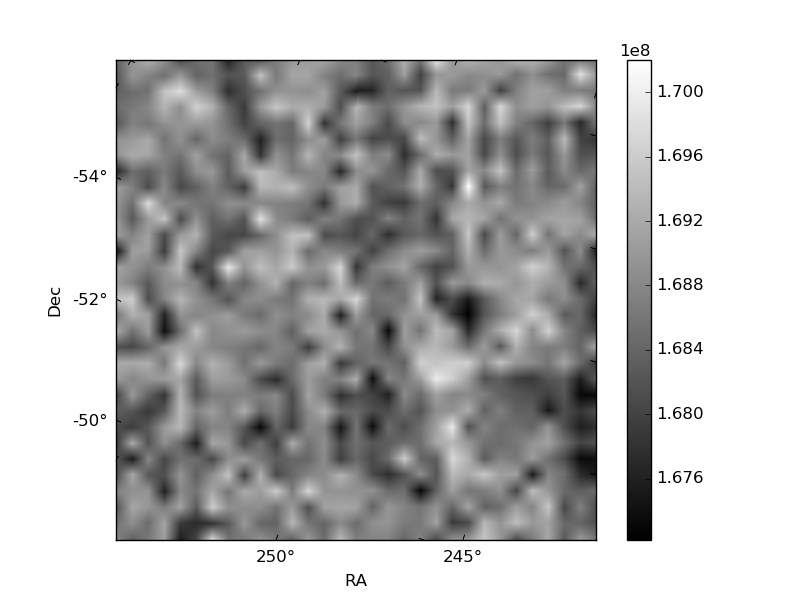
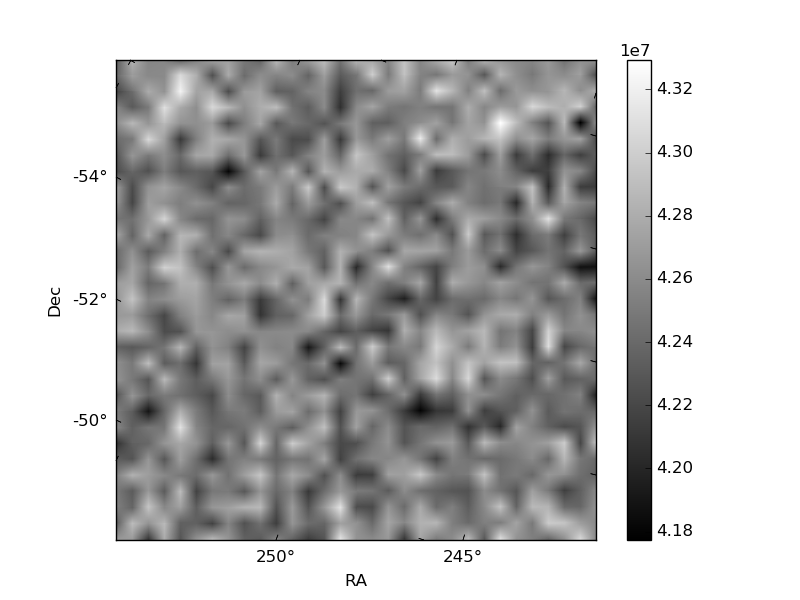
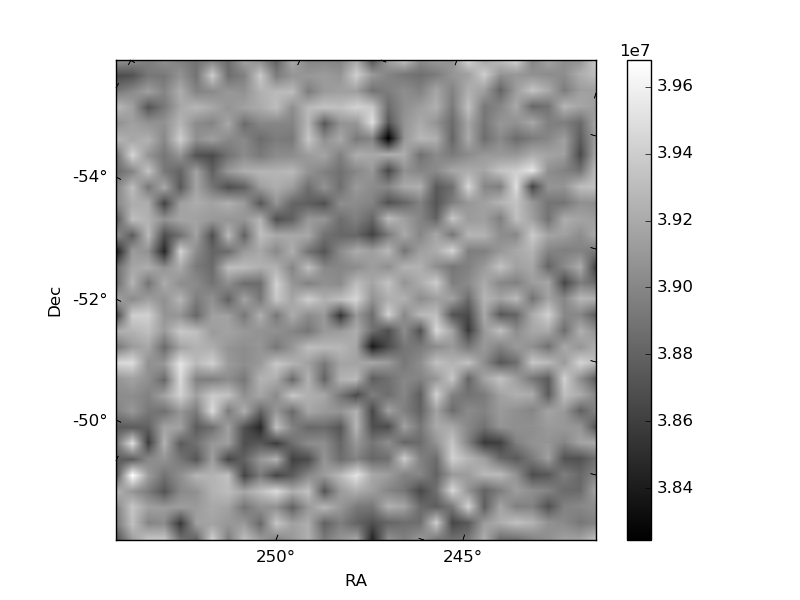
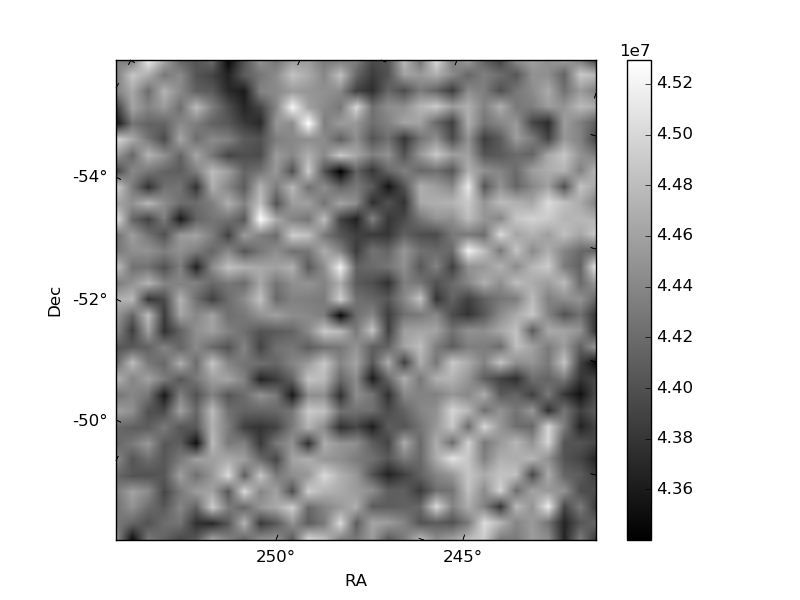
Histogram calculated using DETX and DETY for each event in the final _common_clean file
| Quadrant A | 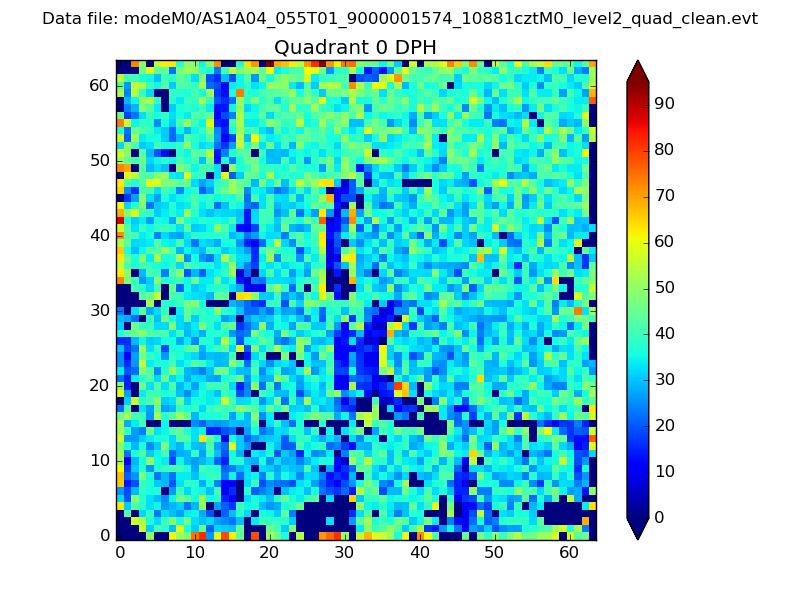 |
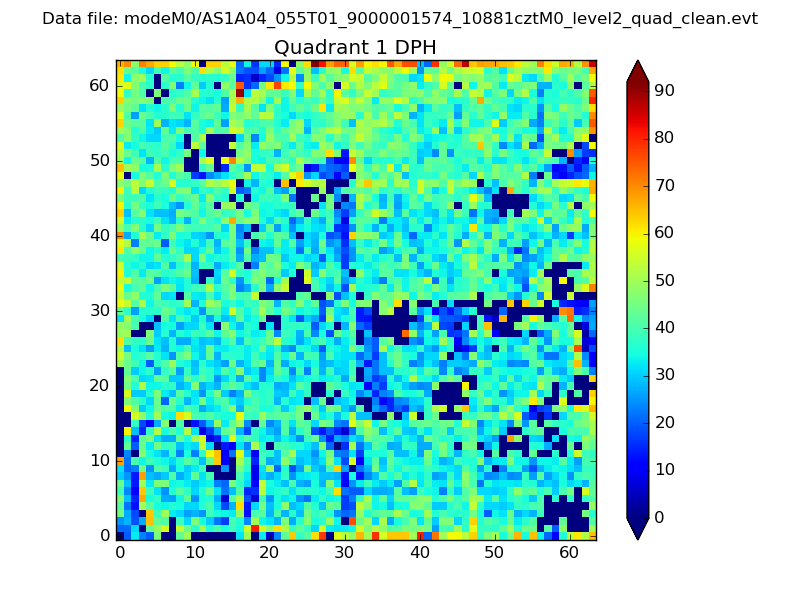 |
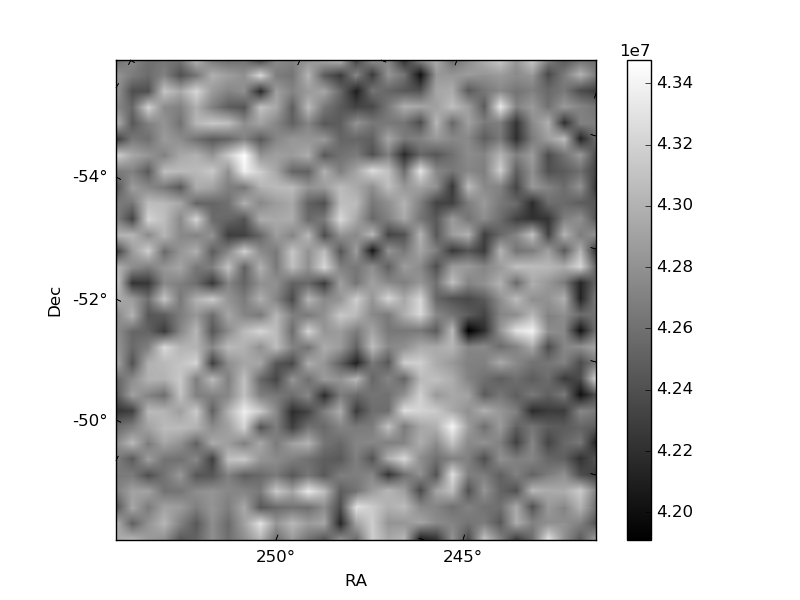
Quadrant B |
|---|---|---|---|
| Quadrant D | 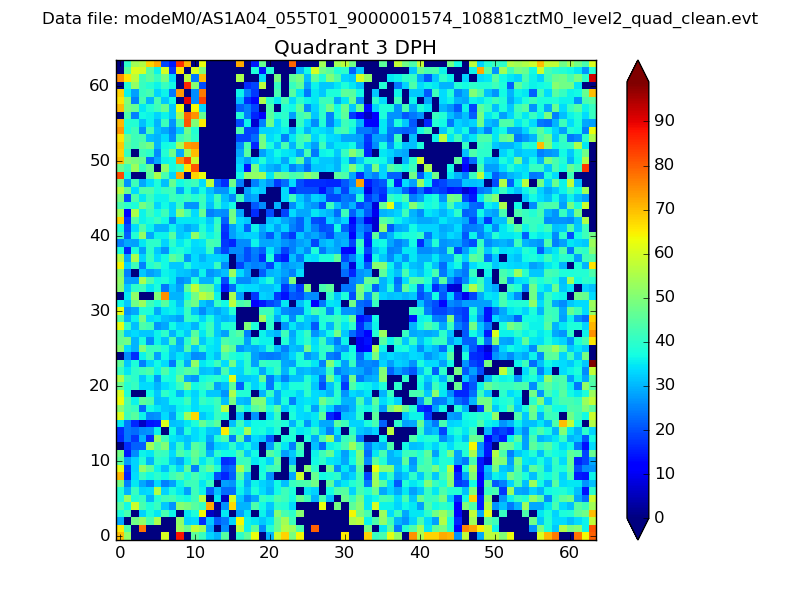 |
 |
Quadrant C |
| Plot type | Count rate plots | Images |
|---|---|---|
| Comparison with Poisson distribution Blue bars denote a histogram of data divided into 1 sec bins. Red curve is a Poisson curve with rate = median count rate of data. |
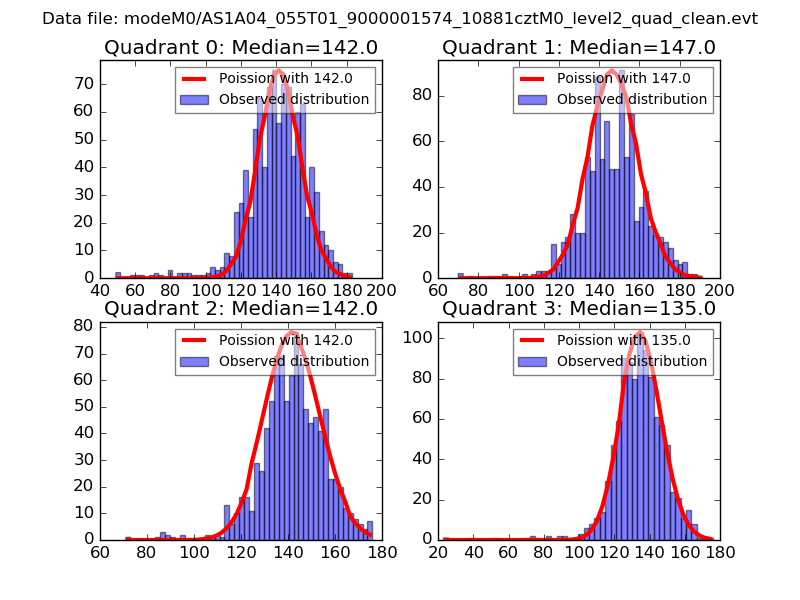 |
 |
| Quadrant-wise count rates Data is divided into 100 sec bins |
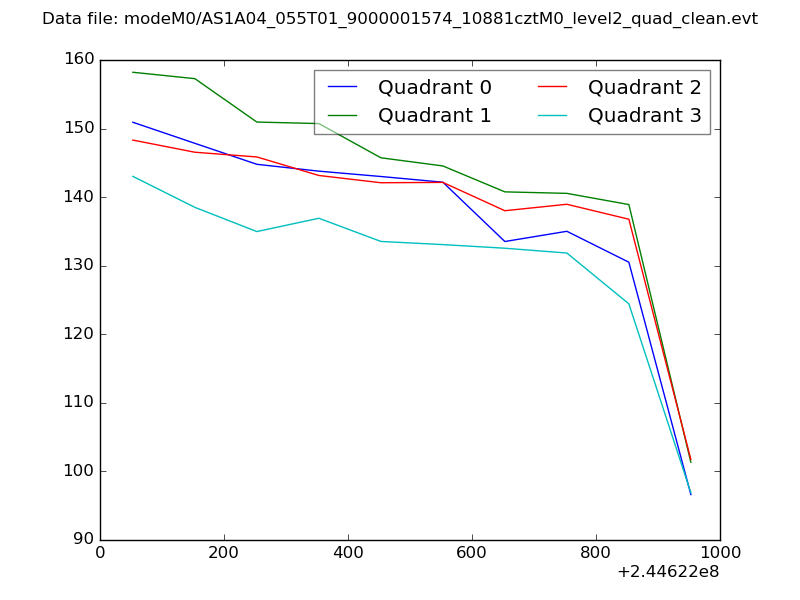 |
|
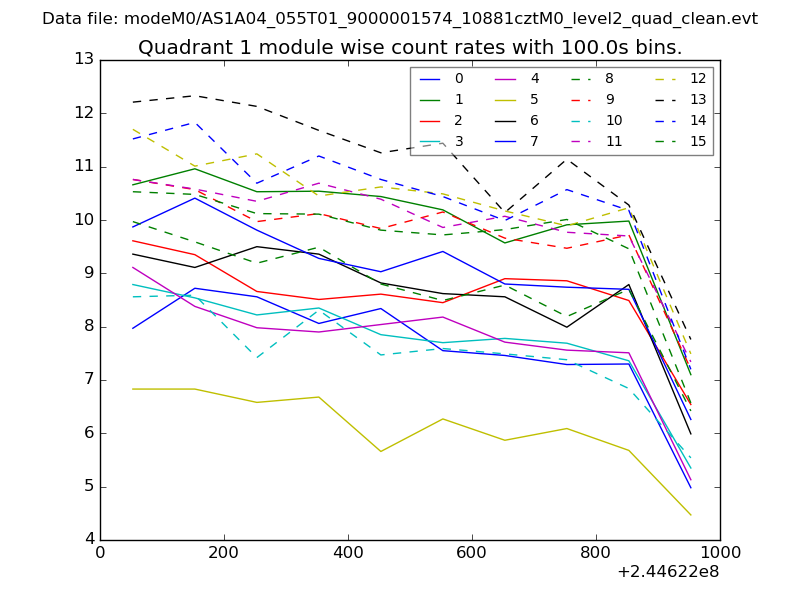
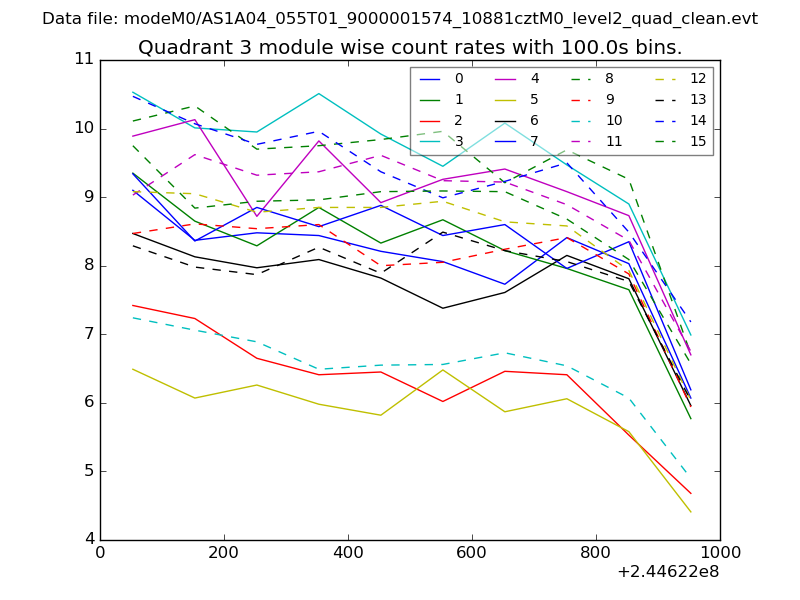
| Module-wise count rates for Quadrant A Data is divided into 100 sec bins |
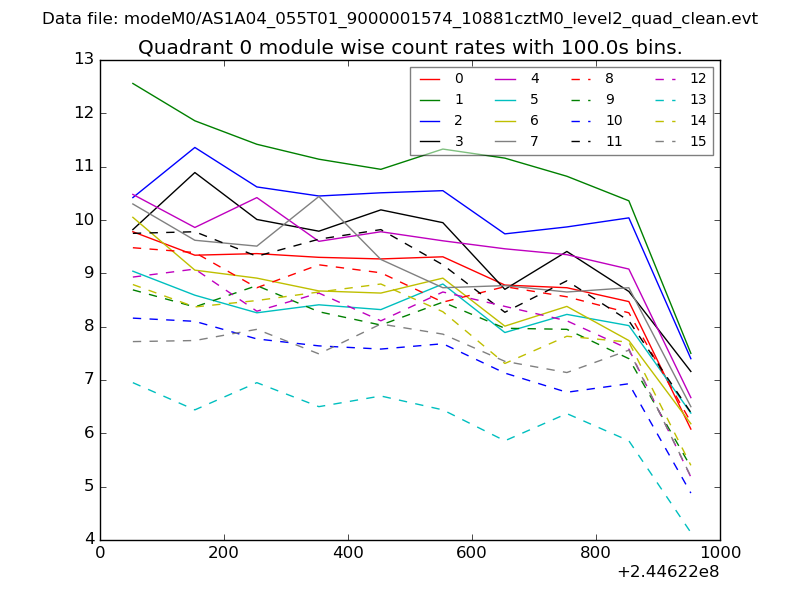 |
 |
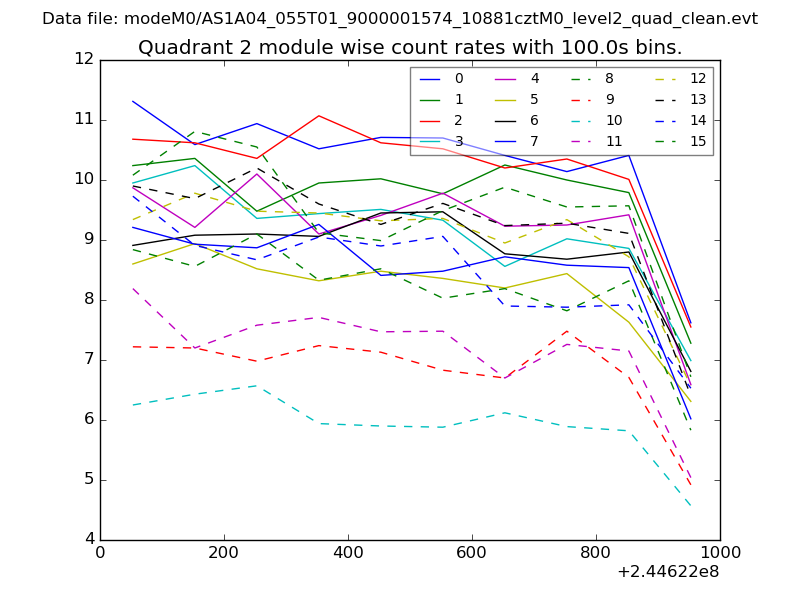
| Module-wise count rates for Quadrant B Data is divided into 100 sec bins |
 |
 |
| Module-wise count rates for Quadrant C Data is divided into 100 sec bins |
 |
 |
| Module-wise count rates for Quadrant D Data is divided into 100 sec bins |
 |
 |
| Parameter | Plot |
|---|---|
| CZT HV Monitor | 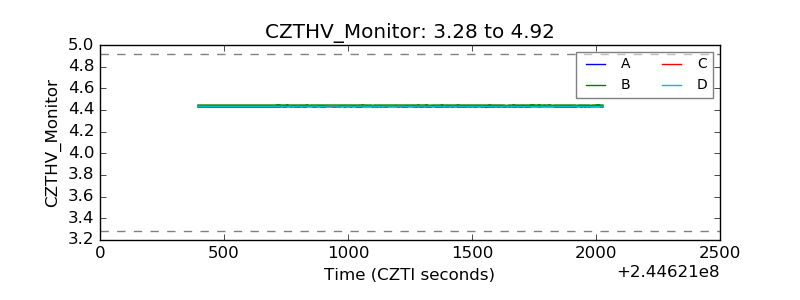 |
| D_VDD | 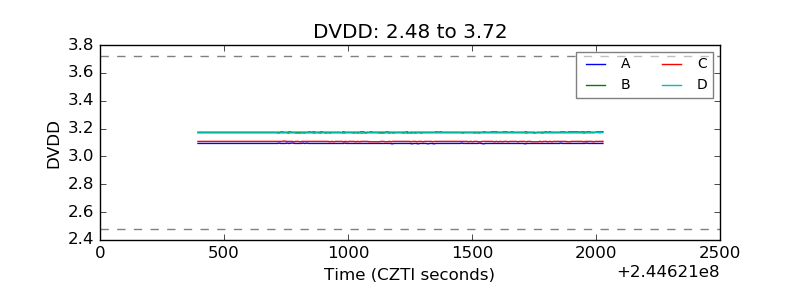 |
| Temperature 1 |  |
| Veto HV Monitor | 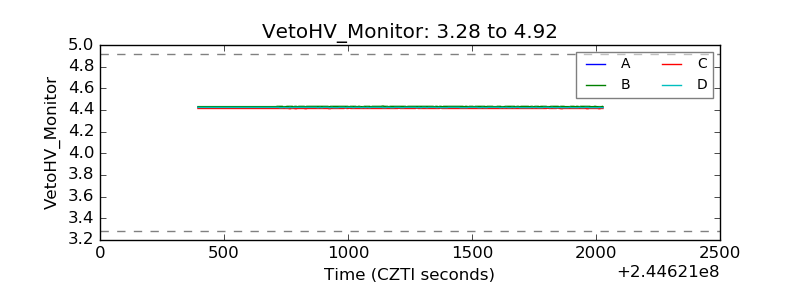 |
| Veto LLD | 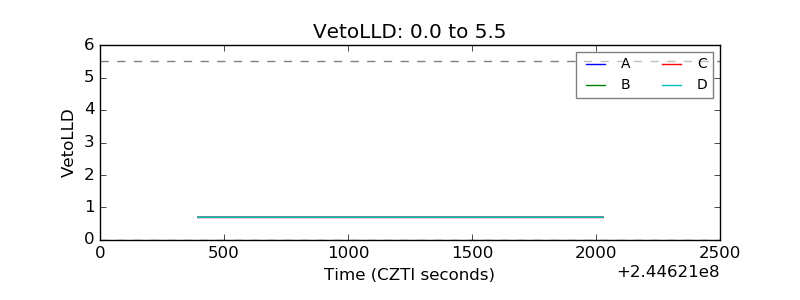 |
| Alpha Counter | 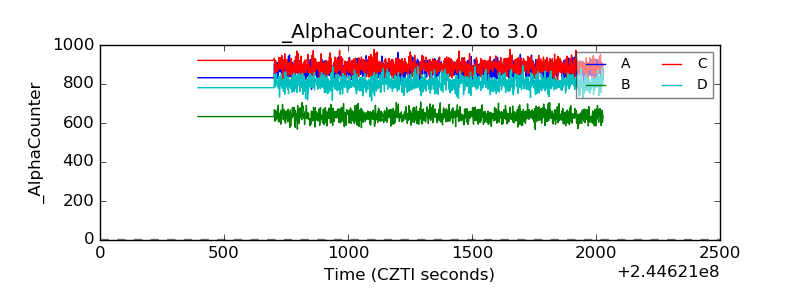 |
| _CPM_Rate | 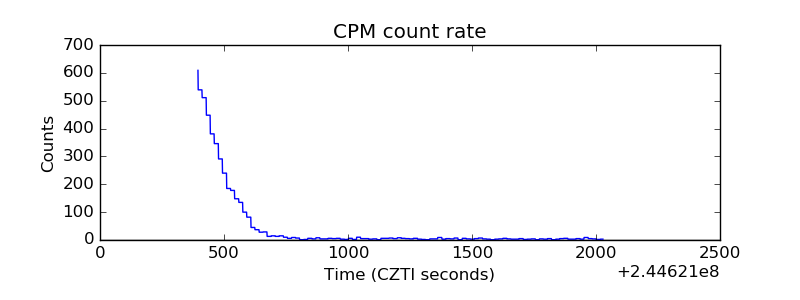 |
| CZT Counter | 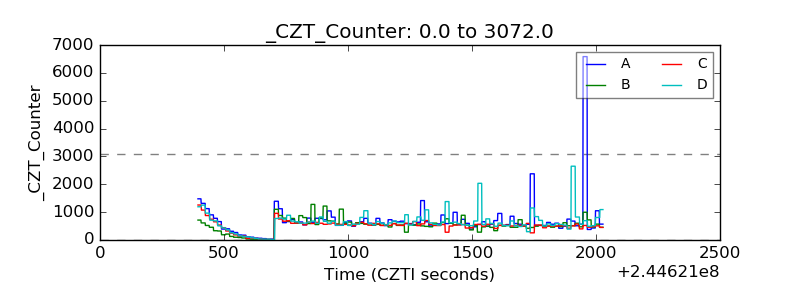 |
| +2.5 Volts monitor |  |
| +5 Volts monitor | 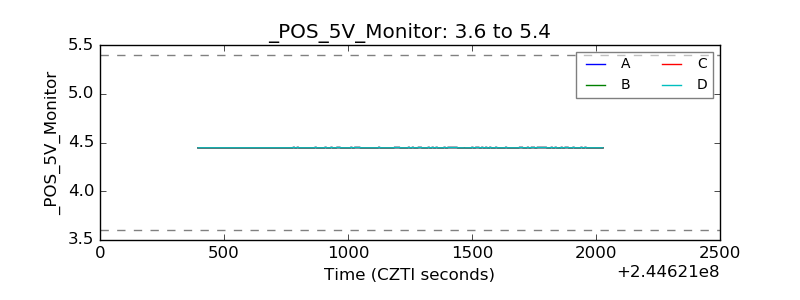 |
| _ROLL_ROT | 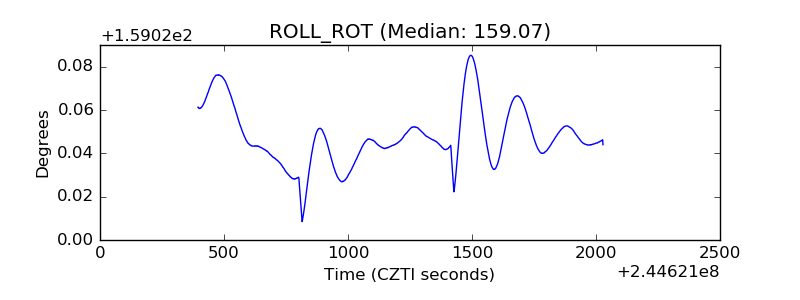 |
| _Roll_DEC | 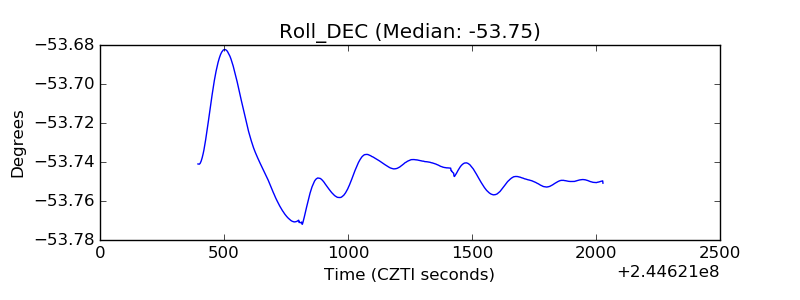 |
| _Roll_RA | 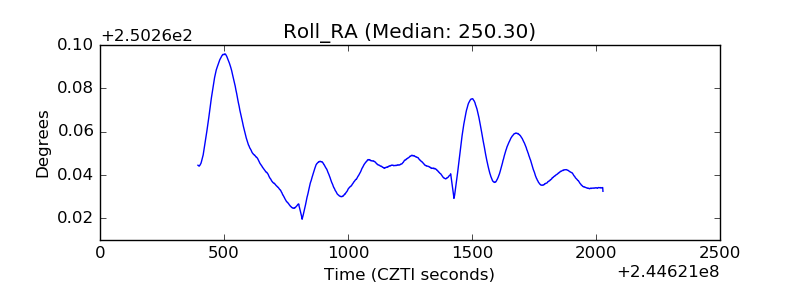 |
| Veto Counter | 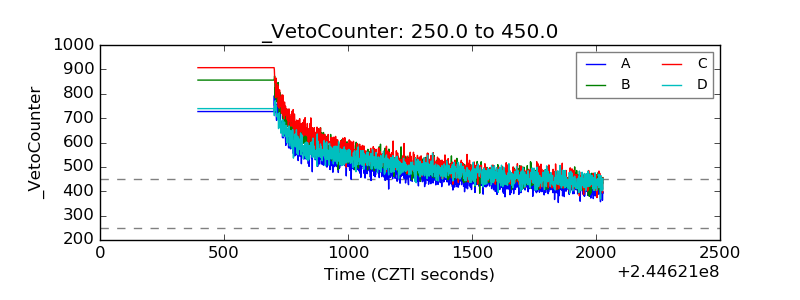 |