| Param | Original file | Final file |
|---|---|---|
| Filename | modeM0/AS1A04_055T01_9000001574_10882cztM0_level2.evt | modeM0/AS1A04_055T01_9000001574_10882cztM0_level2_quad_clean.evt |
| Size (bytes) | 546,894,720 | 111,867,840 |
| Size | 521.6 MB | 106.7 MB |
| Events in quadrant A | 4,104,302 | 744,493 |
| Events in quadrant B | 4,102,220 | 753,379 |
| Events in quadrant C | 3,057,475 | 755,655 |
| Events in quadrant D | 4,862,722 | 685,740 |
| Mode M0 | |||
|---|---|---|---|
| Quadrant | BADHDUFLAG | Total packets | Discarded packets |
| A | 0 | 16482 | 3 |
| B | 0 | 16381 | 2 |
| C | 0 | 13456 | 2 |
| D | 0 | 18723 | 2 |
| Mode M9 | |||
|---|---|---|---|
| Quadrant | BADHDUFLAG | Total packets | Discarded packets |
| A | 0 | 12 | 0 |
| B | 0 | 12 | 0 |
| C | 0 | 12 | 0 |
| D | 0 | 13 | 0 |
| Mode SS | |||
|---|---|---|---|
| Quadrant | BADHDUFLAG | Total packets | Discarded packets |
| A | 0 | 132 | 0 |
| B | 0 | 132 | 0 |
| C | 0 | 132 | 0 |
| D | 0 | 132 | 0 |
| Quadrant | Total seconds | Saturated seconds | Saturation percentage |
|---|---|---|---|
| A | 6427 | 165 | 2.567294% |
| B | 6427 | 265 | 4.123230% |
| C | 6427 | 44 | 0.684612% |
| D | 6427 | 487 | 7.577408% |
Noise dominated data is calculated using 1-second bins in cleaned event files. If a bin has >2000 counts, and if more than 50% of those come from <1% of pixels, then it is considered to be noise-dominated and hence unusable.
| Quadrant | # 1 sec bins | Bins with >0 counts | Bins with >2000 counts | High rate bins dominated by noise | Noise dominated (total time) | Noise dominated (detector-on time) | Marked lightcurve |
|---|---|---|---|---|---|---|---|
| A | 7597 | 6428 | 59 | 59 | 0.78% | 0.92% | 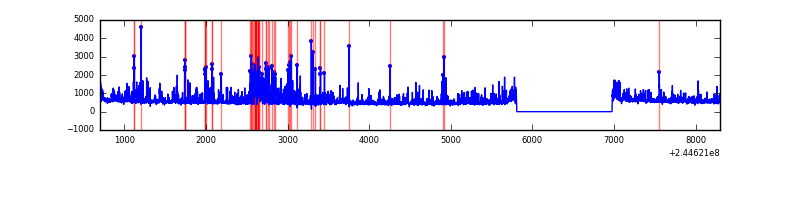 |
| B | 7597 | 6428 | 114 | 114 | 1.50% | 1.77% | 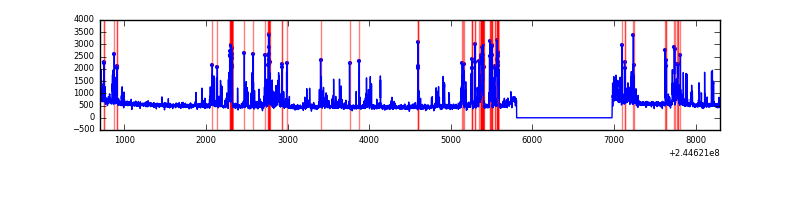 |
| C | 7597 | 6428 | 0 | 0 | 0.00% | 0.00% | 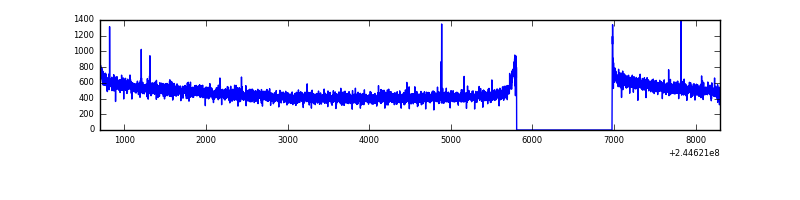 |
| D | 7597 | 6428 | 337 | 337 | 4.44% | 5.24% | 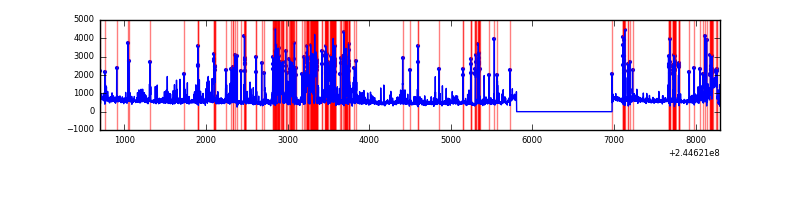 |
Top three noisy pixels from each quadrant. If the there are fewer than three noisy pixels in the level2.evt file, extra rows are filled as -1
| Pixel properties | Quadrant properties | ||||||
|---|---|---|---|---|---|---|---|
| Quadrant | DetID | PixID | Counts | Sigma | Mean | Median | Sigma |
| A | 8 | 5 | 940918 | 5833.02 | 799 | 784 | 161.2 |
| A | 15 | 223 | 43807 | 266.93 | 799 | 784 | 161.2 |
| A | 15 | 239 | 19225 | 114.42 | 799 | 784 | 161.2 |
| B | 4 | 239 | 984534 | 6588.98 | 790 | 769 | 149.3 |
| B | 0 | 214 | 18434 | 118.32 | 790 | 769 | 149.3 |
| B | 12 | 111 | 15735 | 100.24 | 790 | 769 | 149.3 |
| C | 14 | 234 | 6572 | 32.29 | 781 | 786 | 179.2 |
| C | 13 | 61 | 5813 | 28.06 | 781 | 786 | 179.2 |
| C | 5 | 207 | 4093 | 18.46 | 781 | 786 | 179.2 |
| D | 1 | 52 | 1499151 | 8314.84 | 756 | 735 | 180.2 |
| D | 8 | 195 | 235476 | 1302.6 | 756 | 735 | 180.2 |
| D | 2 | 14 | 89892 | 494.74 | 756 | 735 | 180.2 |
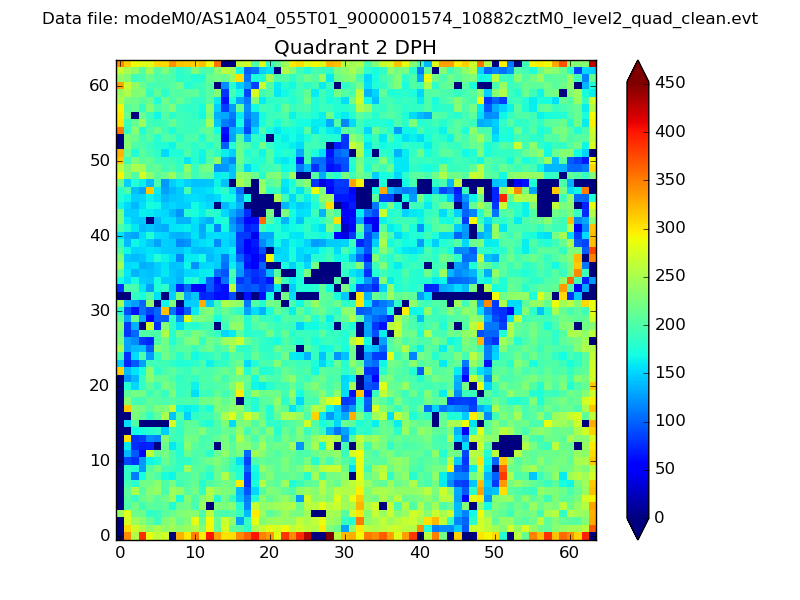
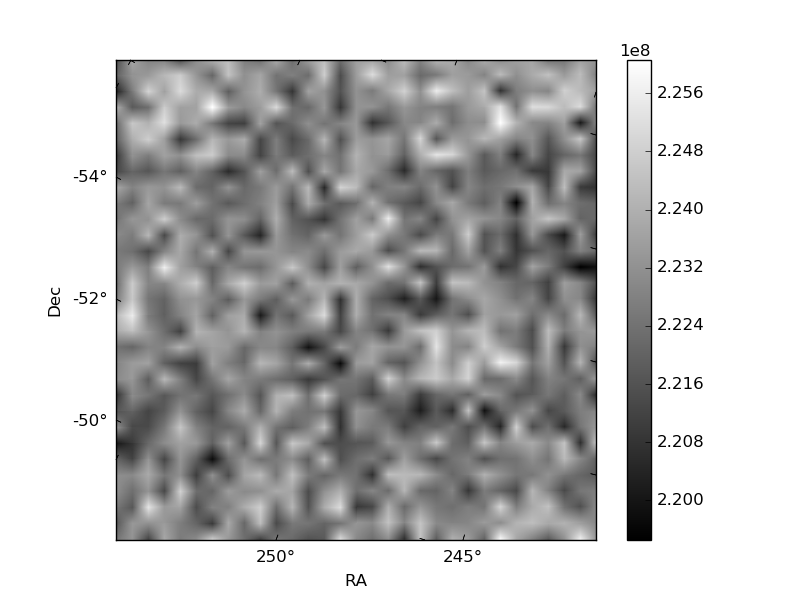
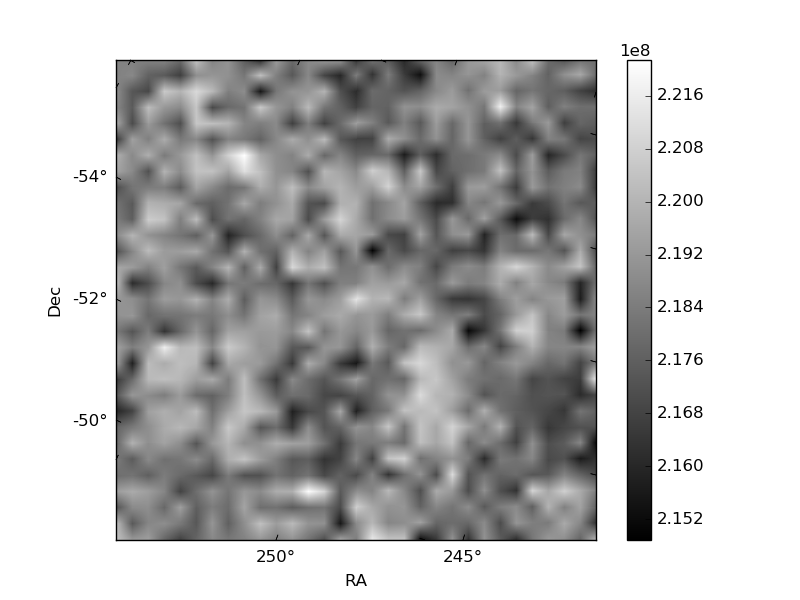
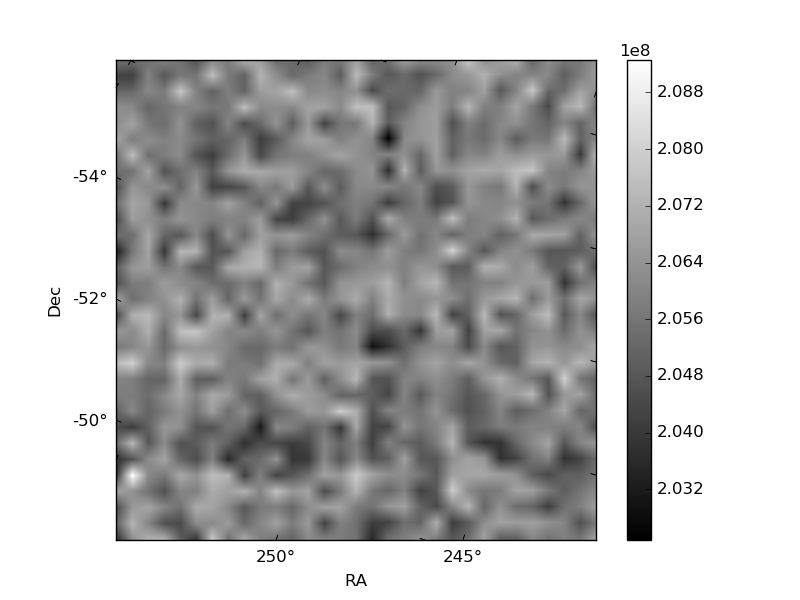
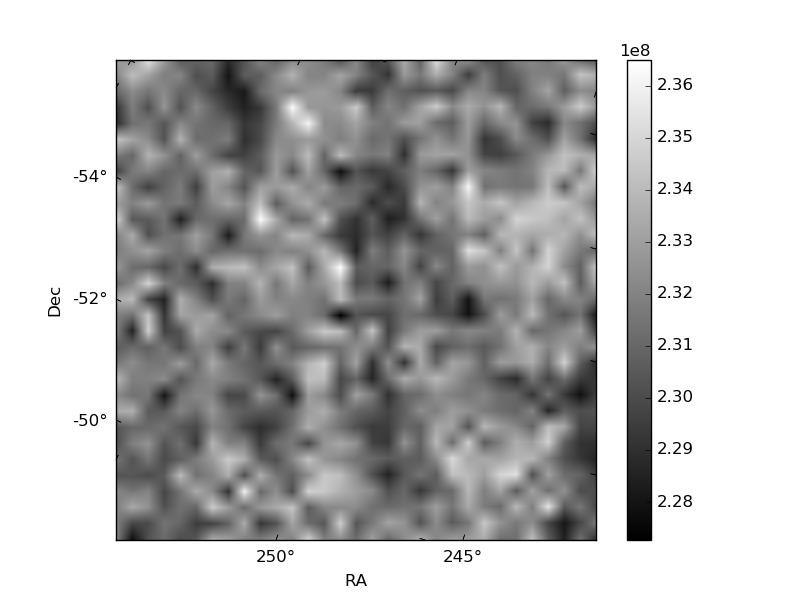
Histogram calculated using DETX and DETY for each event in the final _common_clean file
| Quadrant A | 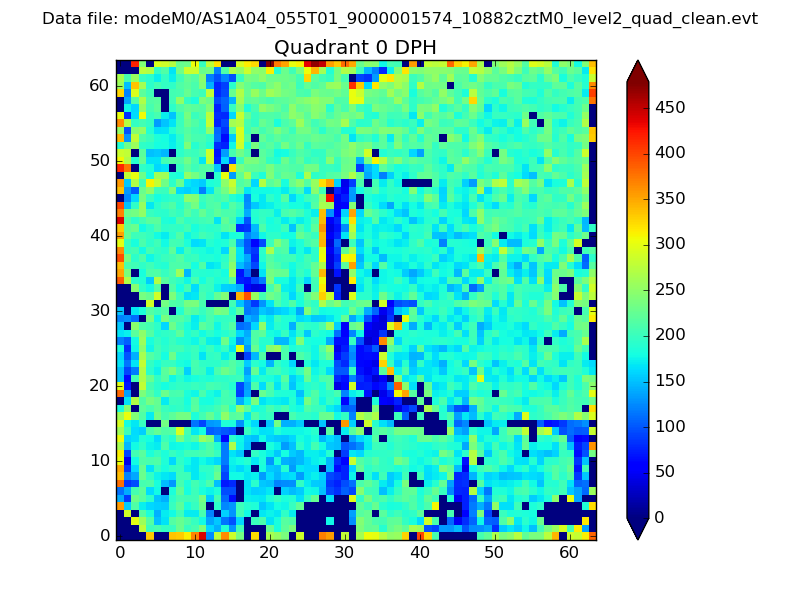 |
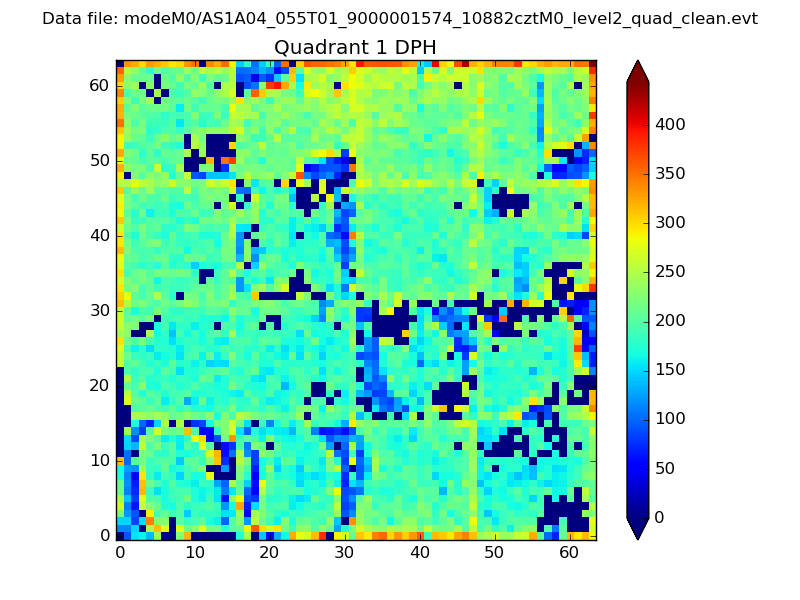 |
Quadrant B |
|---|---|---|---|
| Quadrant D | 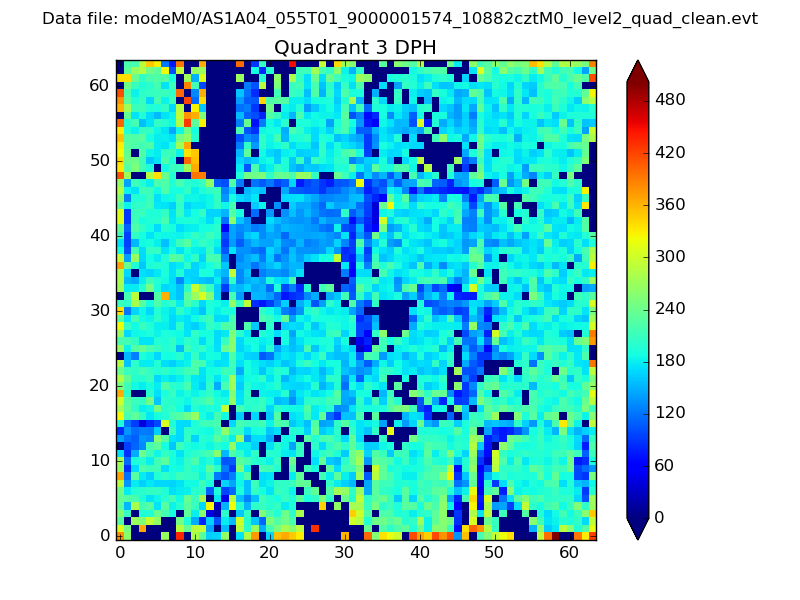 |
 |
Quadrant C |
| Plot type | Count rate plots | Images |
|---|---|---|
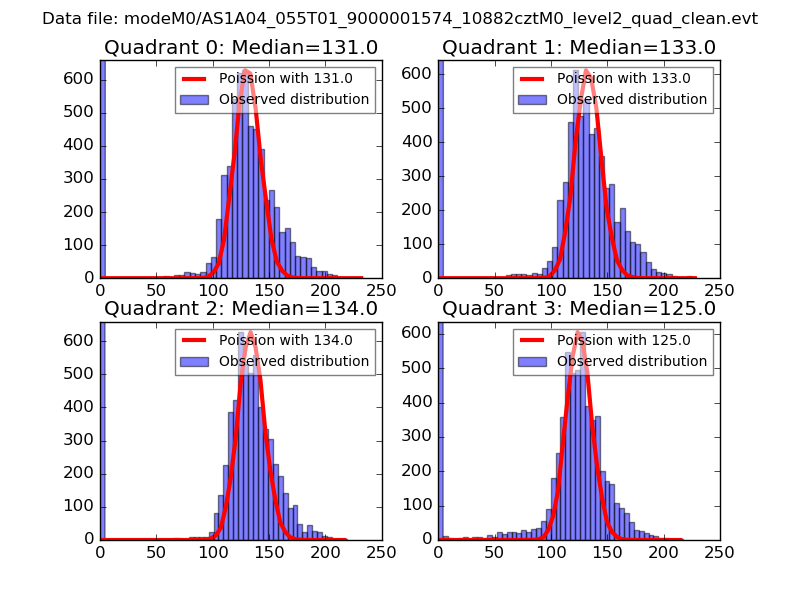
| Comparison with Poisson distribution Blue bars denote a histogram of data divided into 1 sec bins. Red curve is a Poisson curve with rate = median count rate of data. |
 |
 |
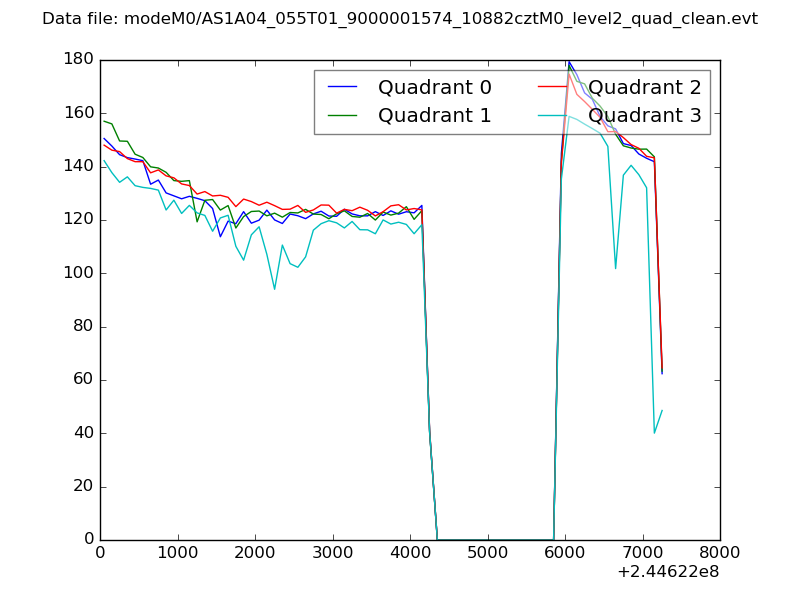
| Quadrant-wise count rates Data is divided into 100 sec bins |
 |
|
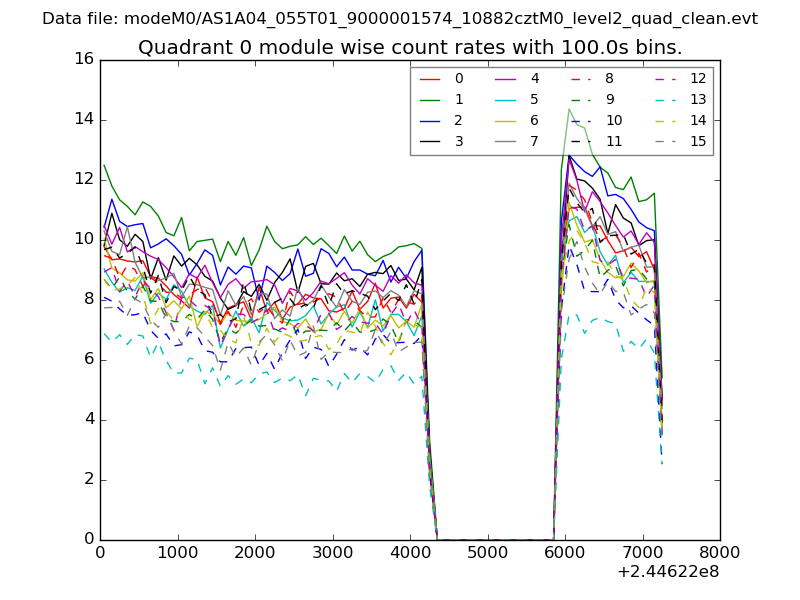
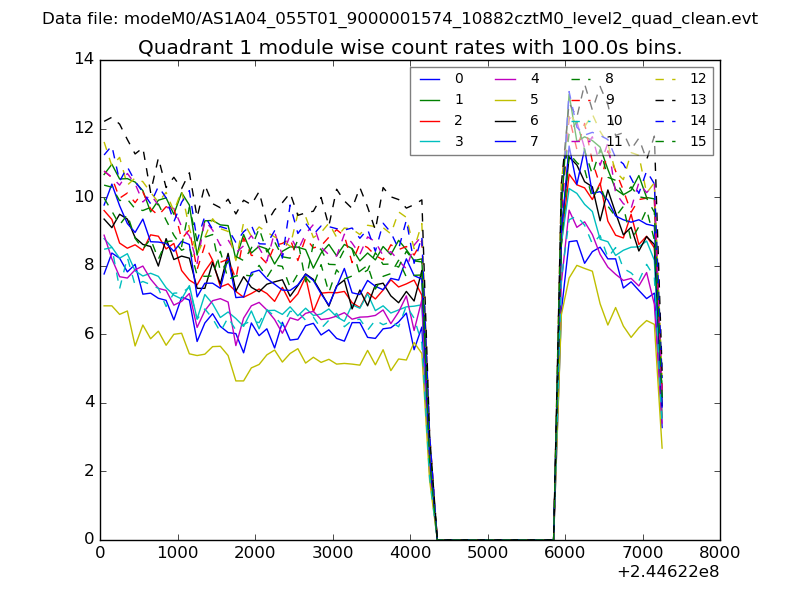
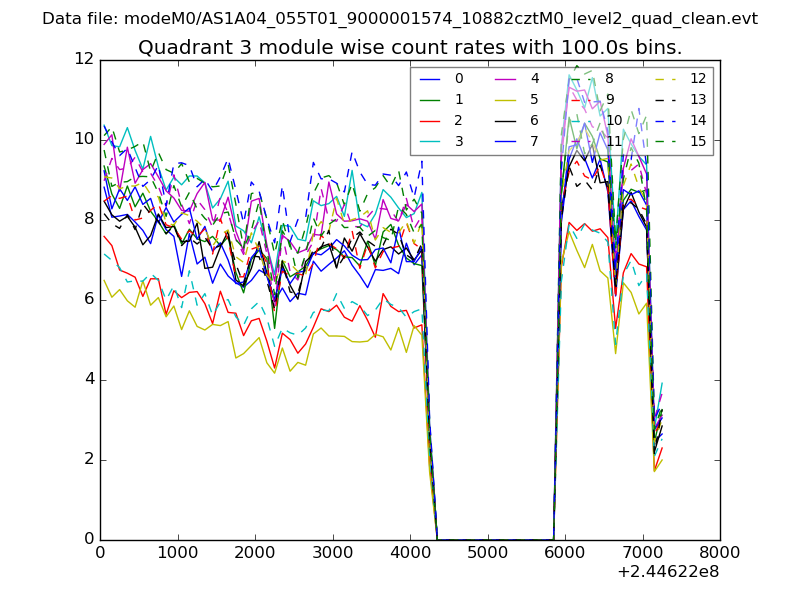
| Module-wise count rates for Quadrant A Data is divided into 100 sec bins |
 |
 |
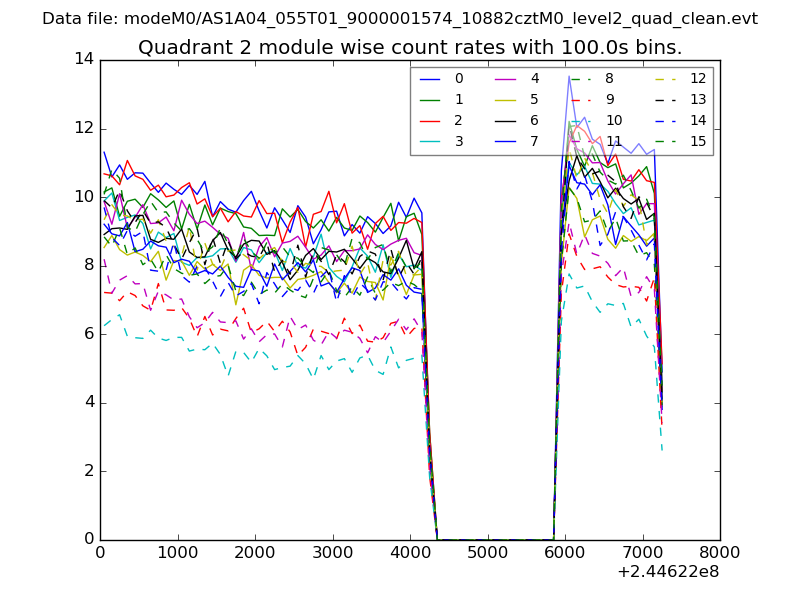
| Module-wise count rates for Quadrant B Data is divided into 100 sec bins |
 |
 |
| Module-wise count rates for Quadrant C Data is divided into 100 sec bins |
 |
 |
| Module-wise count rates for Quadrant D Data is divided into 100 sec bins |
 |
 |
| Parameter | Plot |
|---|---|
| CZT HV Monitor | 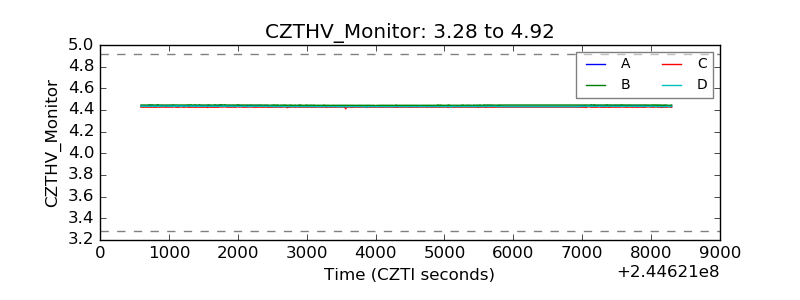 |
| D_VDD | 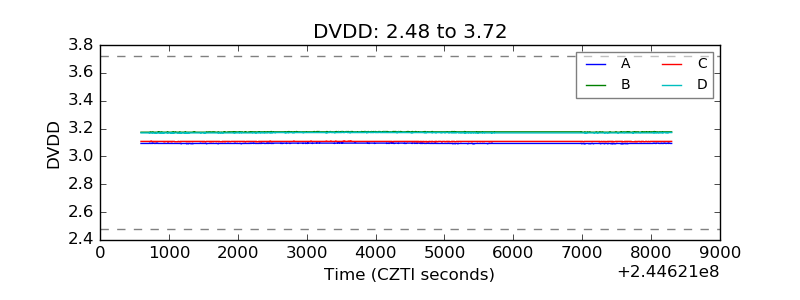 |
| Temperature 1 | 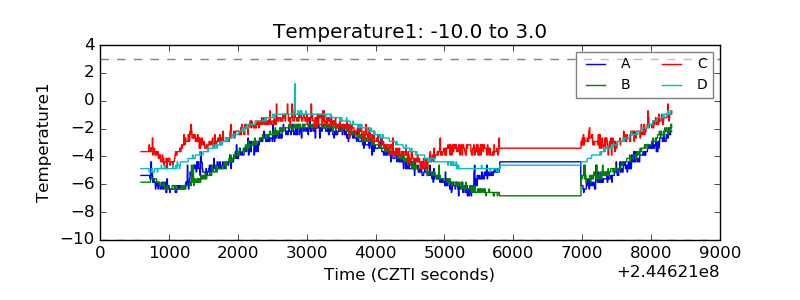 |
| Veto HV Monitor | 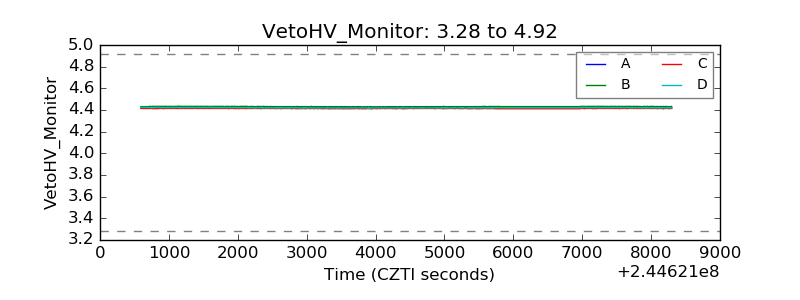 |
| Veto LLD | 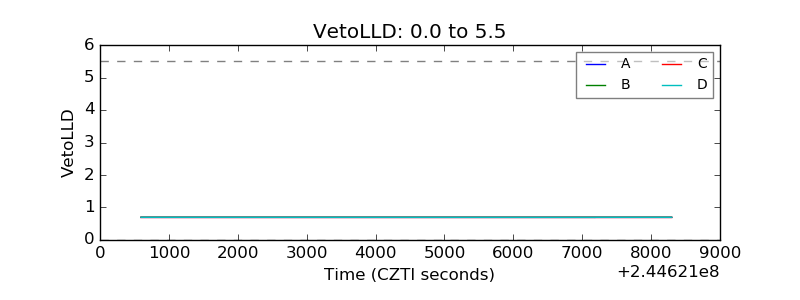 |
| Alpha Counter | 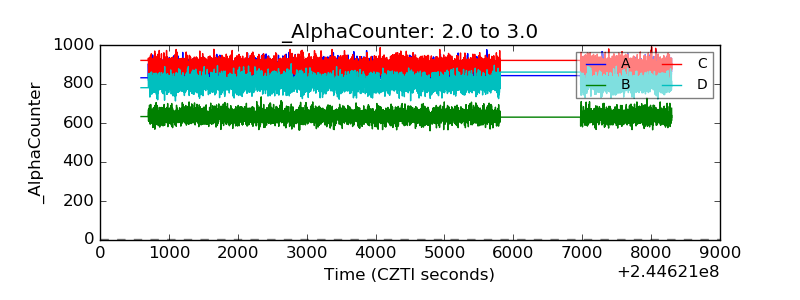 |
| _CPM_Rate | 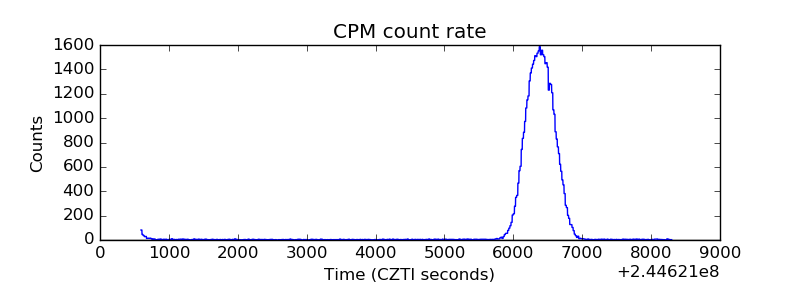 |
| CZT Counter |  |
| +2.5 Volts monitor |  |
| +5 Volts monitor |  |
| _ROLL_ROT | 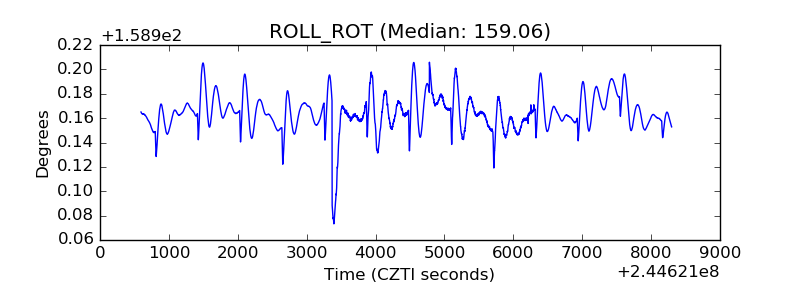 |
| _Roll_DEC | 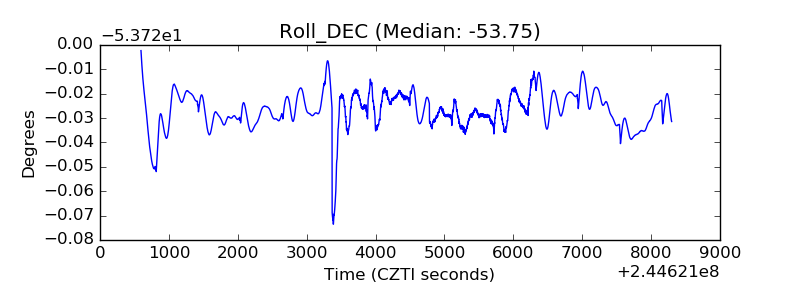 |
| _Roll_RA | 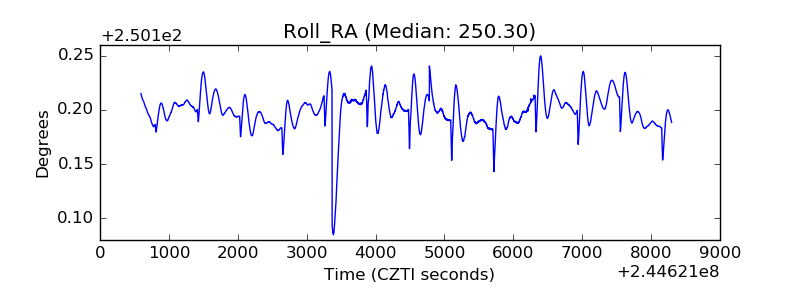 |
| Veto Counter | 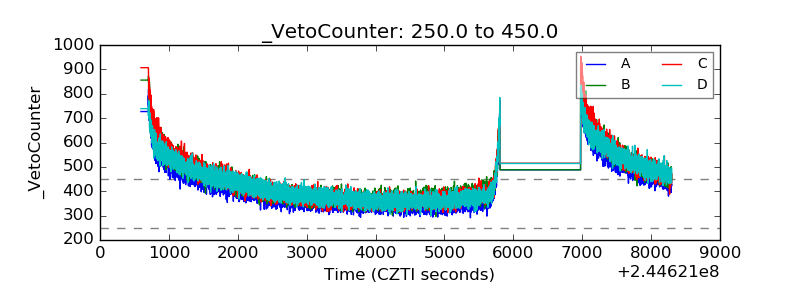 |