| Param | Original file | Final file |
|---|---|---|
| Filename | modeM0/AS1A04_055T01_9000001574_10883cztM0_level2.evt | modeM0/AS1A04_055T01_9000001574_10883cztM0_level2_quad_clean.evt |
| Size (bytes) | 593,645,760 | 116,504,640 |
| Size | 566.1 MB | 111.1 MB |
| Events in quadrant A | 4,884,382 | 780,022 |
| Events in quadrant B | 4,331,695 | 788,558 |
| Events in quadrant C | 3,372,299 | 792,697 |
| Events in quadrant D | 4,951,430 | 715,181 |
| Mode M0 | |||
|---|---|---|---|
| Quadrant | BADHDUFLAG | Total packets | Discarded packets |
| A | 0 | 18860 | 2 |
| B | 0 | 17170 | 1 |
| C | 0 | 14408 | 1 |
| D | 0 | 18893 | 1 |
| Mode M9 | |||
|---|---|---|---|
| Quadrant | BADHDUFLAG | Total packets | Discarded packets |
| A | 0 | 13 | 0 |
| B | 0 | 13 | 0 |
| C | 0 | 13 | 0 |
| D | 0 | 13 | 0 |
| Mode SS | |||
|---|---|---|---|
| Quadrant | BADHDUFLAG | Total packets | Discarded packets |
| A | 0 | 130 | 0 |
| B | 0 | 130 | 0 |
| C | 0 | 130 | 0 |
| D | 0 | 130 | 0 |
| Quadrant | Total seconds | Saturated seconds | Saturation percentage |
|---|---|---|---|
| A | 6485 | 375 | 5.782575% |
| B | 6485 | 290 | 4.471858% |
| C | 6485 | 124 | 1.912105% |
| D | 6485 | 488 | 7.525058% |
Noise dominated data is calculated using 1-second bins in cleaned event files. If a bin has >2000 counts, and if more than 50% of those come from <1% of pixels, then it is considered to be noise-dominated and hence unusable.
| Quadrant | # 1 sec bins | Bins with >0 counts | Bins with >2000 counts | High rate bins dominated by noise | Noise dominated (total time) | Noise dominated (detector-on time) | Marked lightcurve |
|---|---|---|---|---|---|---|---|
| A | 7725 | 6486 | 274 | 274 | 3.55% | 4.22% |  |
| B | 7725 | 6486 | 136 | 136 | 1.76% | 2.10% |  |
| C | 7725 | 6486 | 54 | 54 | 0.70% | 0.83% |  |
| D | 7725 | 6485 | 217 | 217 | 2.81% | 3.35% | 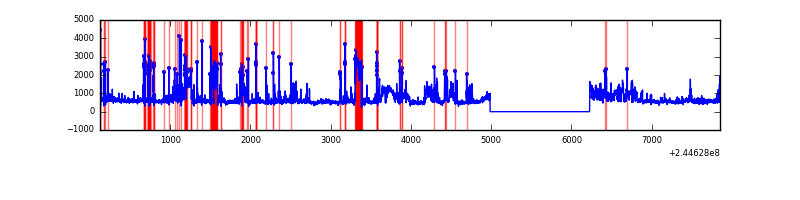 |
Top three noisy pixels from each quadrant. If the there are fewer than three noisy pixels in the level2.evt file, extra rows are filled as -1
| Pixel properties | Quadrant properties | ||||||
|---|---|---|---|---|---|---|---|
| Quadrant | DetID | PixID | Counts | Sigma | Mean | Median | Sigma |
| A | 8 | 5 | 1759258 | 10706.28 | 809 | 792 | 164.2 |
| A | 0 | 226 | 7645 | 41.72 | 809 | 792 | 164.2 |
| A | 12 | 194 | 6571 | 35.18 | 809 | 792 | 164.2 |
| B | 4 | 239 | 1100502 | 7365.68 | 803 | 786 | 149.3 |
| B | 0 | 219 | 23647 | 153.12 | 803 | 786 | 149.3 |
| B | 0 | 214 | 22936 | 148.36 | 803 | 786 | 149.3 |
| C | 4 | 254 | 298554 | 1666.56 | 784 | 788 | 178.7 |
| C | 14 | 234 | 14038 | 74.16 | 784 | 788 | 178.7 |
| C | 13 | 61 | 5792 | 28.0 | 784 | 788 | 178.7 |
| D | 1 | 52 | 1299263 | 7176.67 | 757 | 737 | 180.9 |
| D | 8 | 195 | 338972 | 1869.35 | 757 | 737 | 180.9 |
| D | 13 | 152 | 155606 | 855.93 | 757 | 737 | 180.9 |
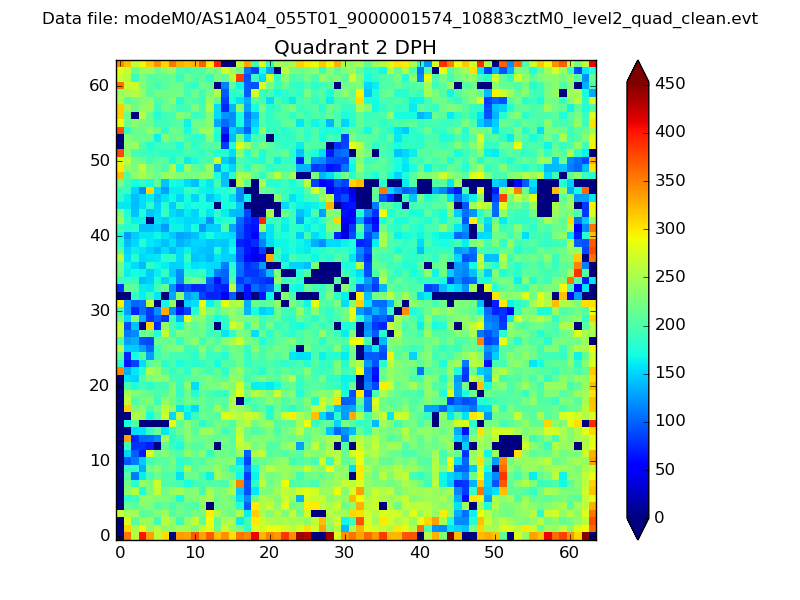
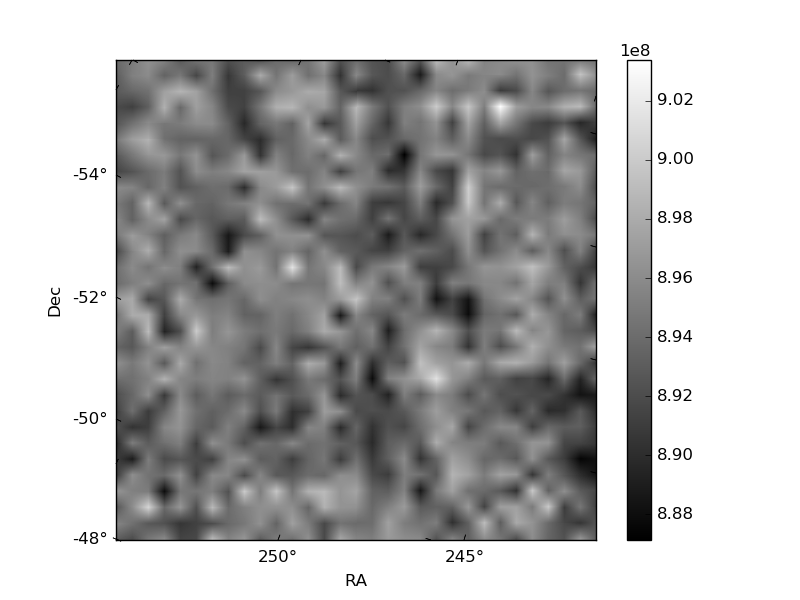
Histogram calculated using DETX and DETY for each event in the final _common_clean file
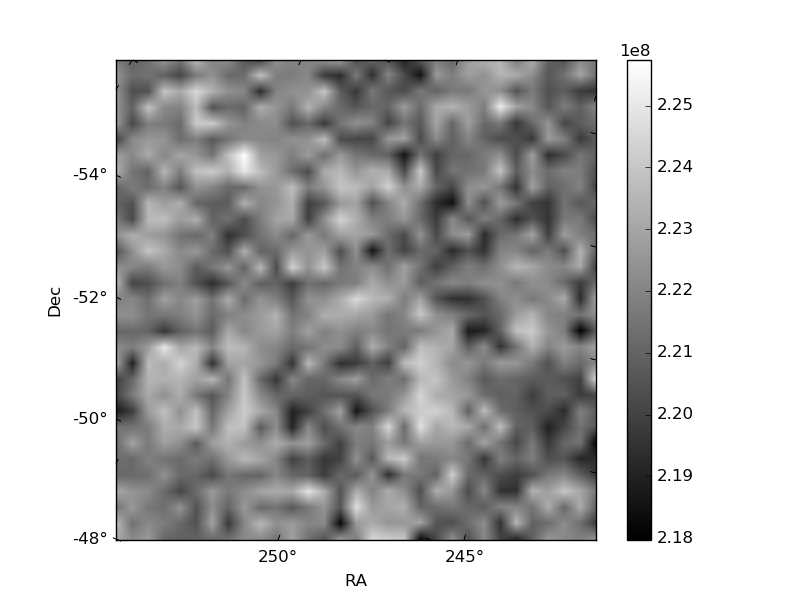
| Quadrant A |  |
 |
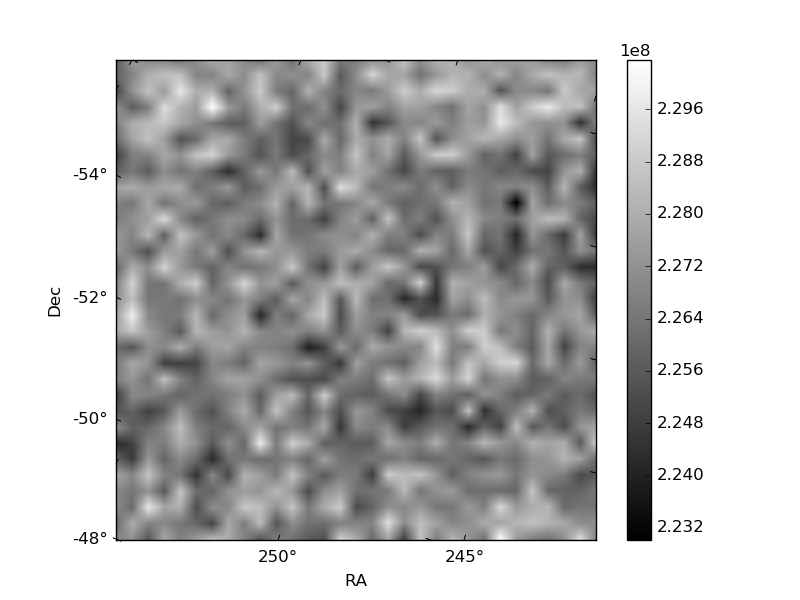
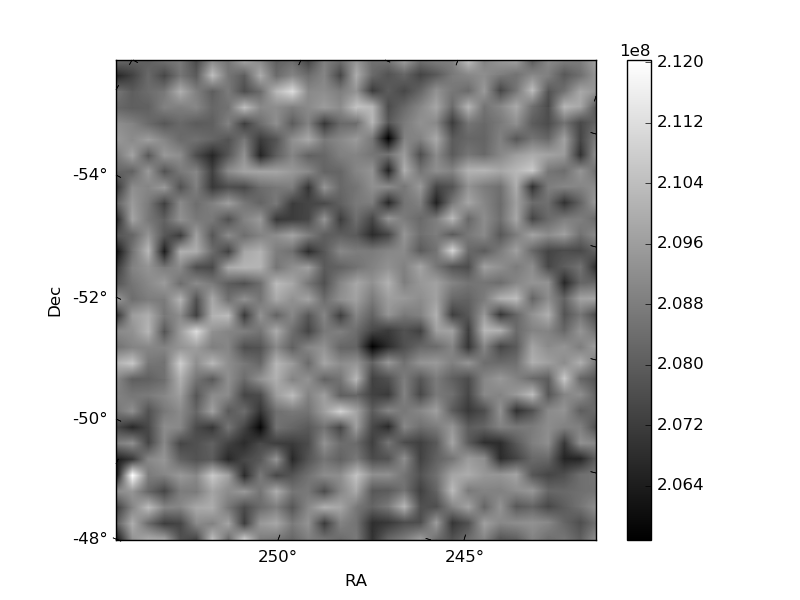
Quadrant B |
|---|---|---|---|
| Quadrant D | 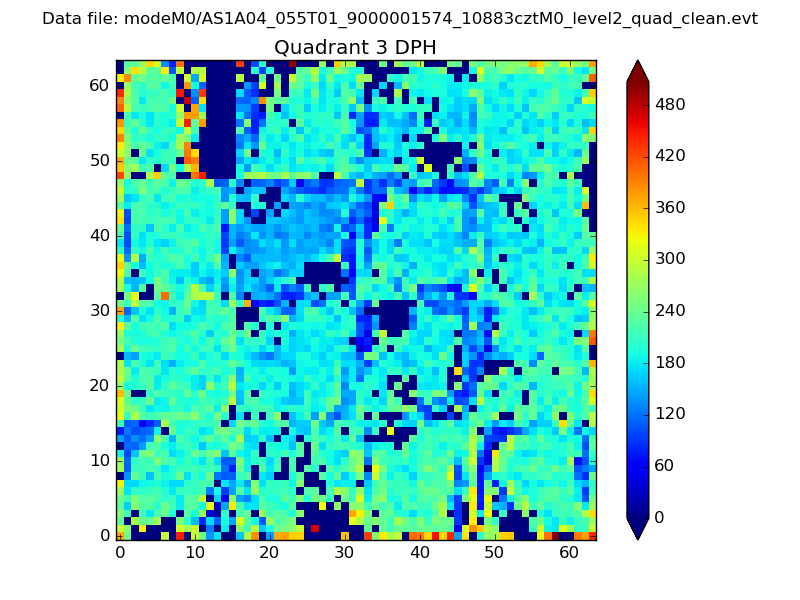 |
 |
Quadrant C |
| Plot type | Count rate plots | Images |
|---|---|---|
| Comparison with Poisson distribution Blue bars denote a histogram of data divided into 1 sec bins. Red curve is a Poisson curve with rate = median count rate of data. |
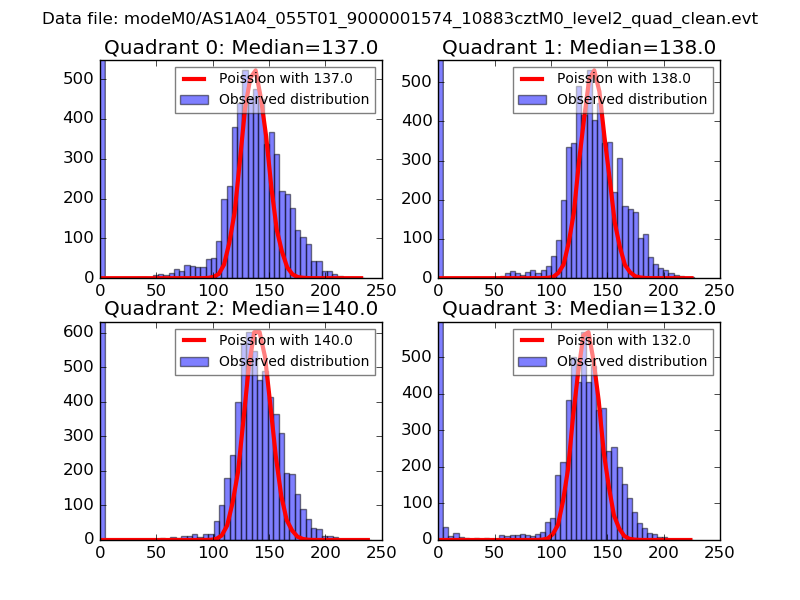 |
 |
| Quadrant-wise count rates Data is divided into 100 sec bins |
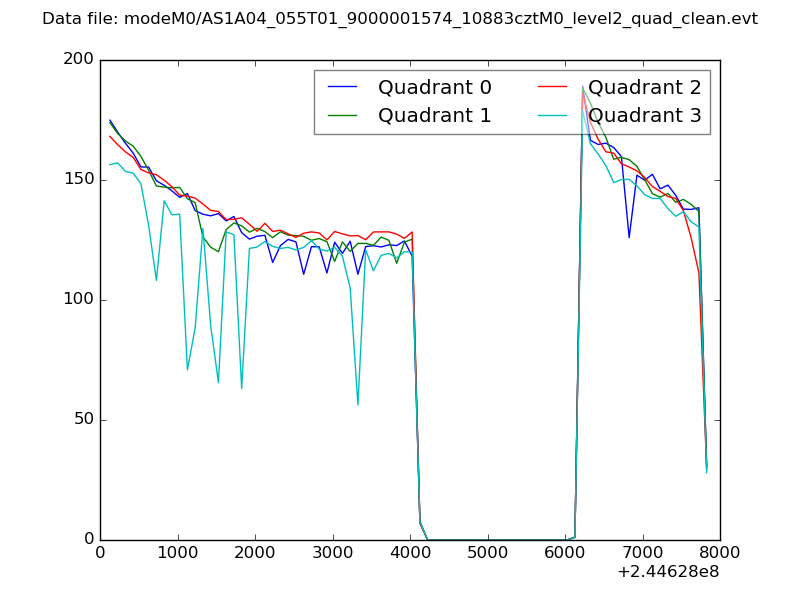 |
|
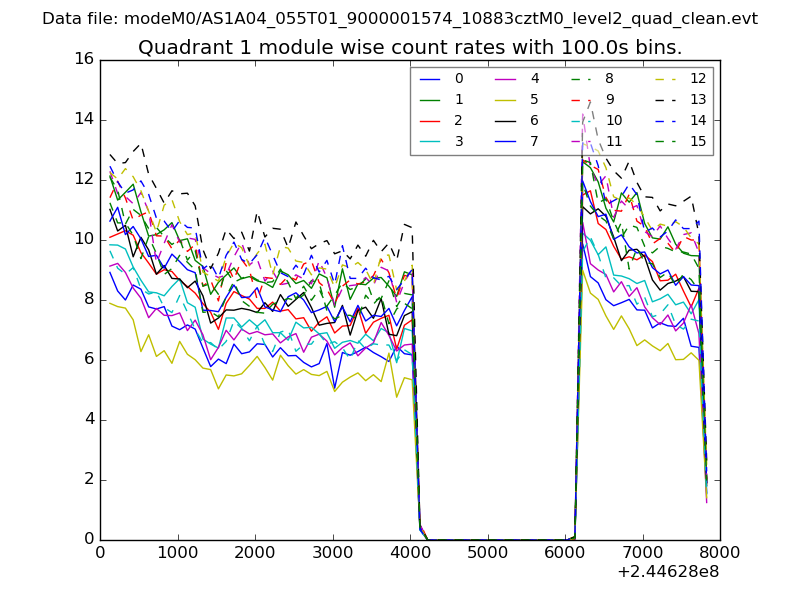
| Module-wise count rates for Quadrant A Data is divided into 100 sec bins |
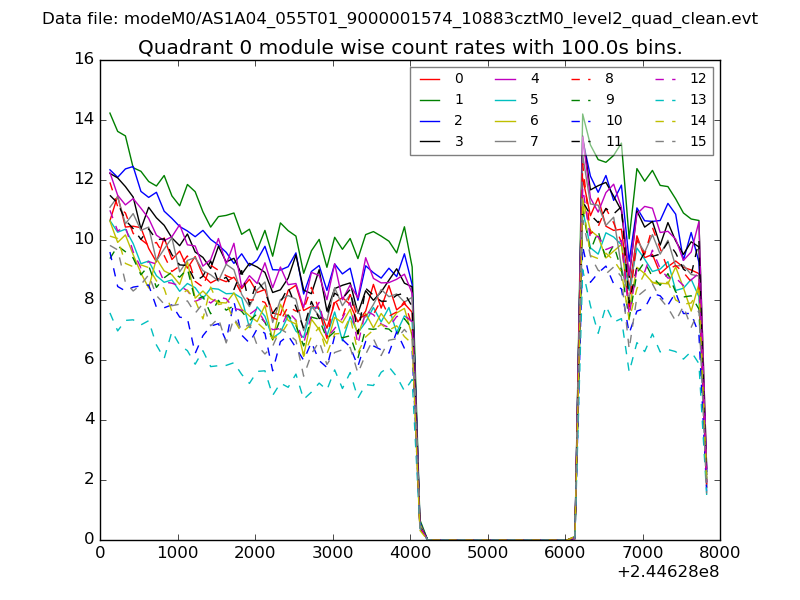 |
 |
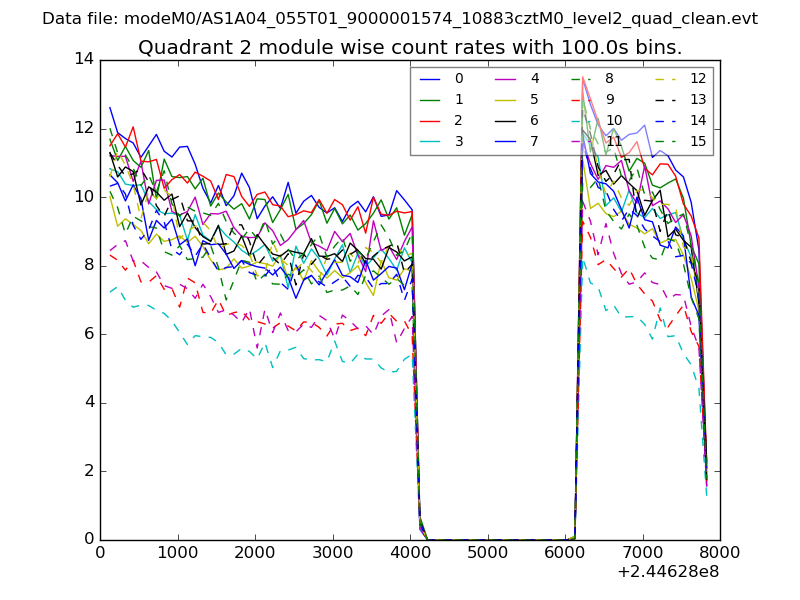
| Module-wise count rates for Quadrant B Data is divided into 100 sec bins |
 |
 |
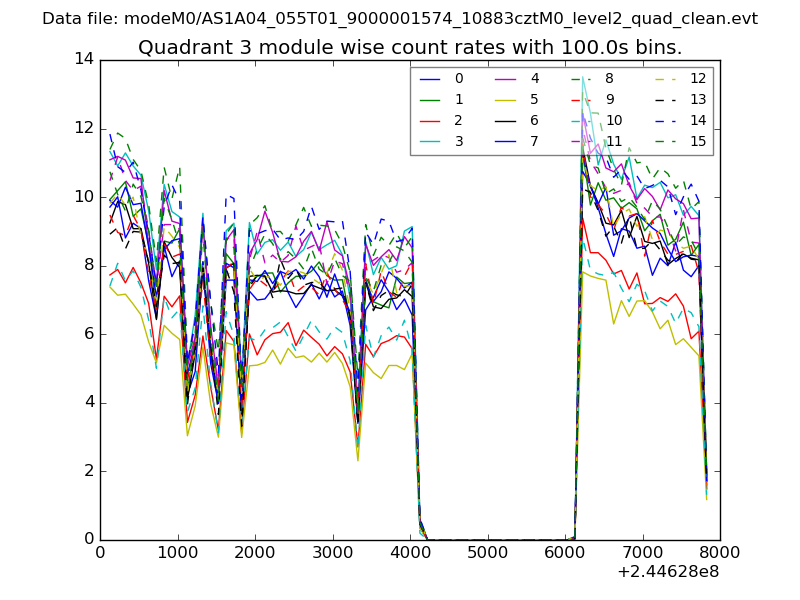
| Module-wise count rates for Quadrant C Data is divided into 100 sec bins |
 |
 |
| Module-wise count rates for Quadrant D Data is divided into 100 sec bins |
 |
 |
| Parameter | Plot |
|---|---|
| CZT HV Monitor | 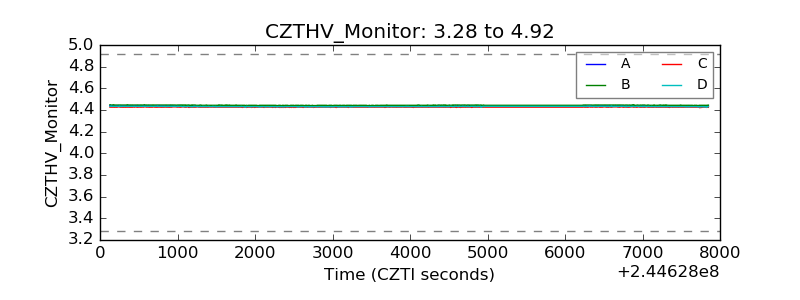 |
| D_VDD | 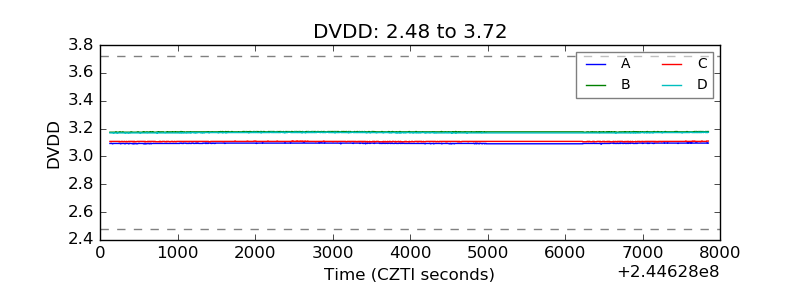 |
| Temperature 1 | 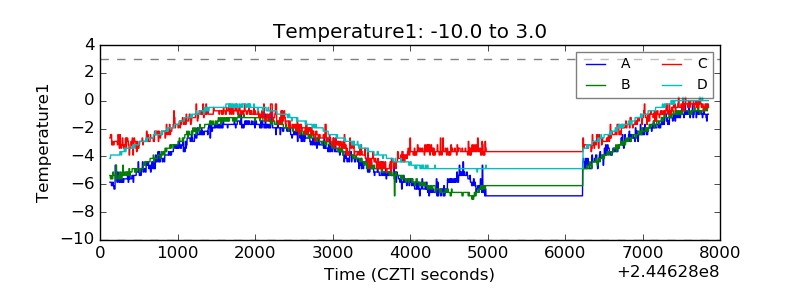 |
| Veto HV Monitor | 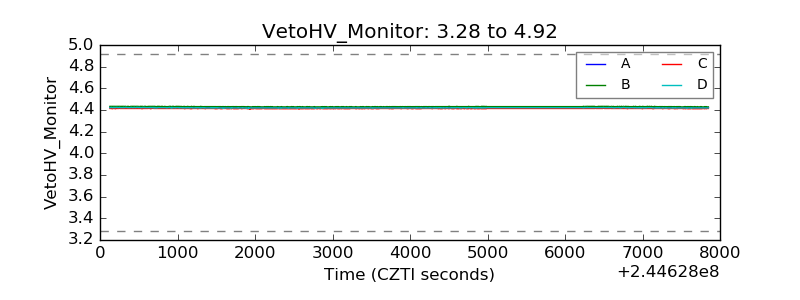 |
| Veto LLD | 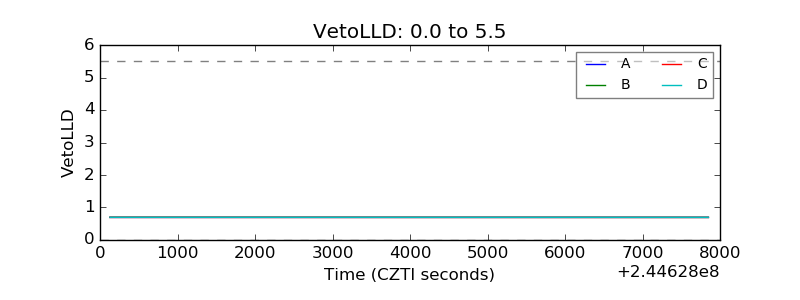 |
| Alpha Counter | 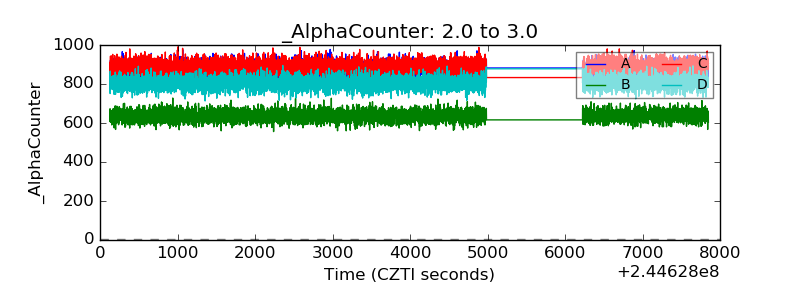 |
| _CPM_Rate | 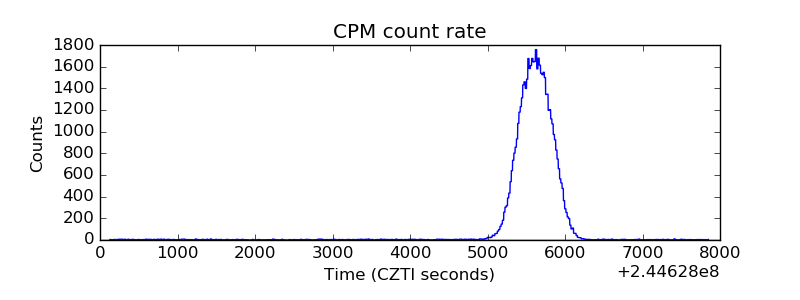 |
| CZT Counter | 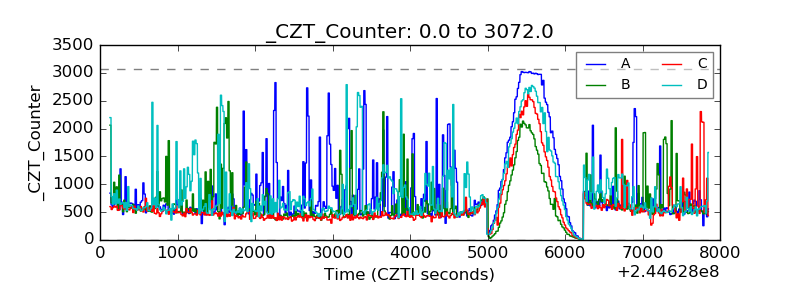 |
| +2.5 Volts monitor |  |
| +5 Volts monitor |  |
| _ROLL_ROT | 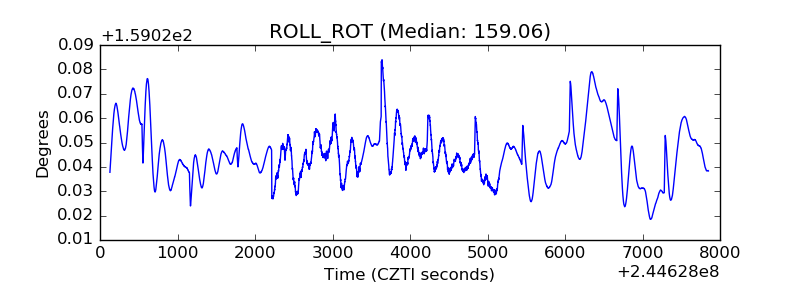 |
| _Roll_DEC | 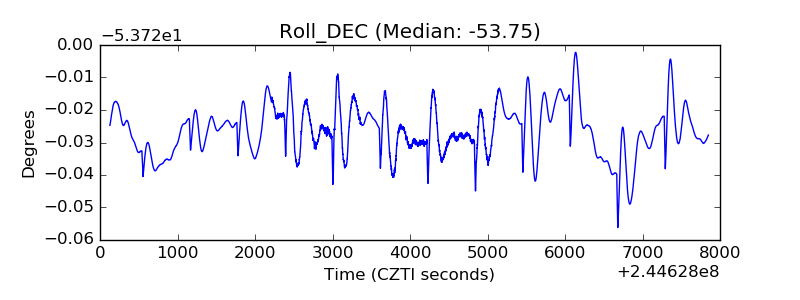 |
| _Roll_RA | 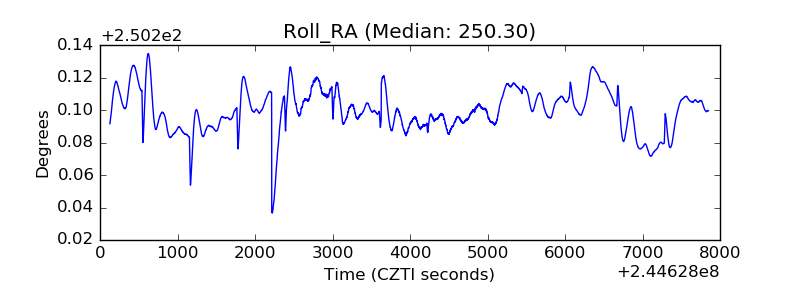 |
| Veto Counter | 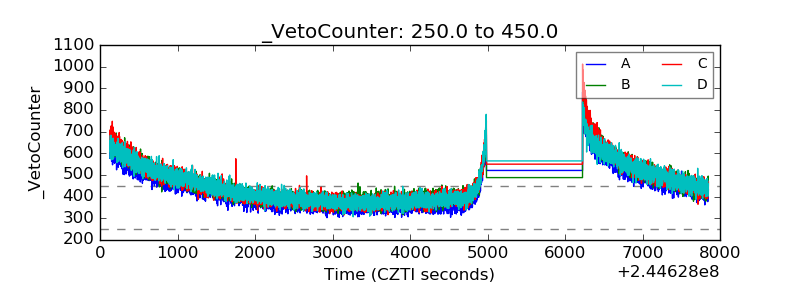 |