| Param | Original file | Final file |
|---|---|---|
| Filename | modeM0/AS1A04_055T01_9000001574_10885cztM0_level2.evt | modeM0/AS1A04_055T01_9000001574_10885cztM0_level2_quad_clean.evt |
| Size (bytes) | 499,109,760 | 88,920,000 |
| Size | 476.0 MB | 84.8 MB |
| Events in quadrant A | 4,361,474 | 564,351 |
| Events in quadrant B | 3,680,540 | 580,080 |
| Events in quadrant C | 2,745,485 | 580,932 |
| Events in quadrant D | 3,922,543 | 549,647 |
| Mode M0 | |||
|---|---|---|---|
| Quadrant | BADHDUFLAG | Total packets | Discarded packets |
| A | 0 | 16959 | 3 |
| B | 0 | 14791 | 2 |
| C | 0 | 12421 | 2 |
| D | 0 | 15506 | 2 |
| Mode M9 | |||
|---|---|---|---|
| Quadrant | BADHDUFLAG | Total packets | Discarded packets |
| A | 0 | 12 | 0 |
| B | 0 | 12 | 0 |
| C | 0 | 12 | 0 |
| D | 0 | 12 | 0 |
| Mode SS | |||
|---|---|---|---|
| Quadrant | BADHDUFLAG | Total packets | Discarded packets |
| A | 0 | 122 | 0 |
| B | 0 | 122 | 0 |
| C | 0 | 122 | 0 |
| D | 0 | 122 | 0 |
| Quadrant | Total seconds | Saturated seconds | Saturation percentage |
|---|---|---|---|
| A | 5976 | 341 | 5.706158% |
| B | 5976 | 289 | 4.836011% |
| C | 5976 | 65 | 1.087684% |
| D | 5976 | 172 | 2.878179% |
Noise dominated data is calculated using 1-second bins in cleaned event files. If a bin has >2000 counts, and if more than 50% of those come from <1% of pixels, then it is considered to be noise-dominated and hence unusable.
| Quadrant | # 1 sec bins | Bins with >0 counts | Bins with >2000 counts | High rate bins dominated by noise | Noise dominated (total time) | Noise dominated (detector-on time) | Marked lightcurve |
|---|---|---|---|---|---|---|---|
| A | 7191 | 5977 | 177 | 177 | 2.46% | 2.96% | 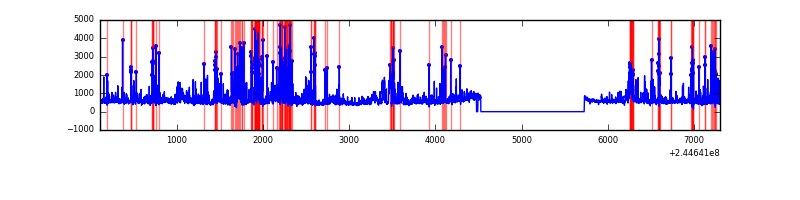 |
| B | 7191 | 5978 | 131 | 131 | 1.82% | 2.19% | 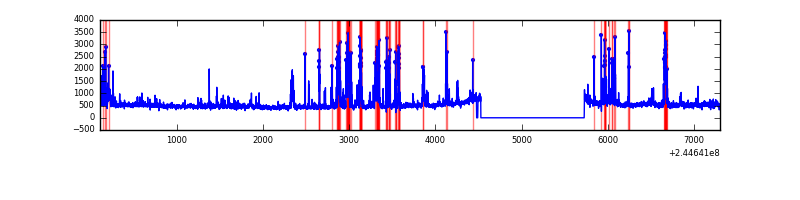 |
| C | 7191 | 5978 | 16 | 16 | 0.22% | 0.27% | 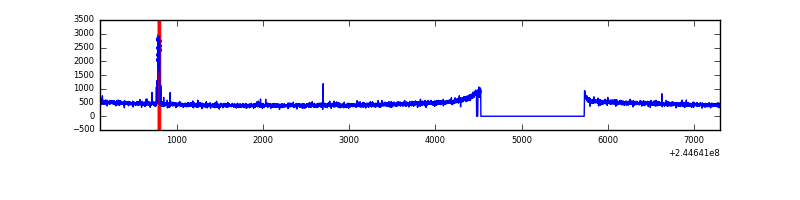 |
| D | 7191 | 5978 | 86 | 86 | 1.20% | 1.44% |  |
Top three noisy pixels from each quadrant. If the there are fewer than three noisy pixels in the level2.evt file, extra rows are filled as -1
| Pixel properties | Quadrant properties | ||||||
|---|---|---|---|---|---|---|---|
| Quadrant | DetID | PixID | Counts | Sigma | Mean | Median | Sigma |
| A | 8 | 5 | 1396997 | 9529.52 | 714 | 699 | 146.5 |
| A | 15 | 223 | 117103 | 794.44 | 714 | 699 | 146.5 |
| A | 15 | 239 | 45863 | 308.24 | 714 | 699 | 146.5 |
| B | 4 | 239 | 737530 | 5486.09 | 713 | 696 | 134.3 |
| B | 0 | 219 | 71446 | 526.77 | 713 | 696 | 134.3 |
| B | 0 | 214 | 25154 | 182.1 | 713 | 696 | 134.3 |
| C | 0 | 207 | 56528 | 352.66 | 688 | 691 | 158.3 |
| C | 13 | 61 | 5238 | 28.72 | 688 | 691 | 158.3 |
| C | 14 | 234 | 3618 | 18.49 | 688 | 691 | 158.3 |
| D | 8 | 195 | 420883 | 2540.9 | 691 | 672 | 165.4 |
| D | 1 | 52 | 389628 | 2351.91 | 691 | 672 | 165.4 |
| D | 5 | 97 | 148877 | 896.16 | 691 | 672 | 165.4 |
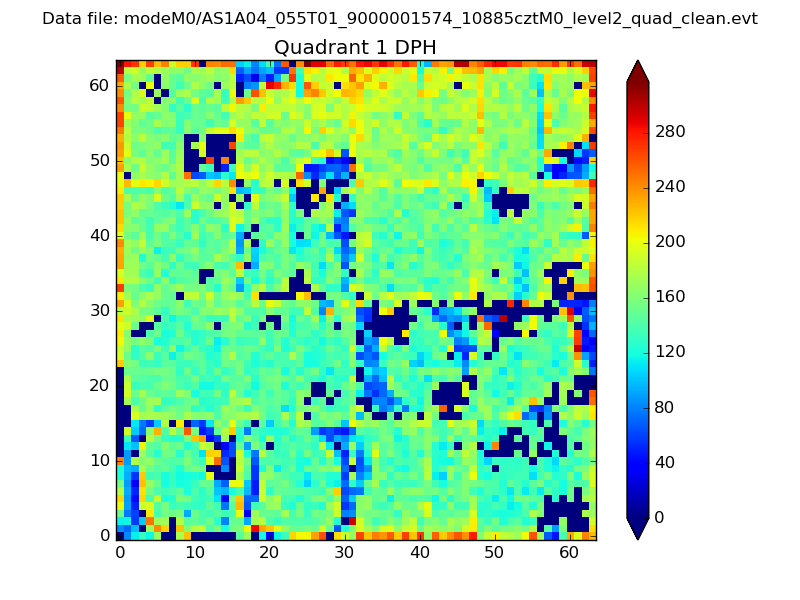
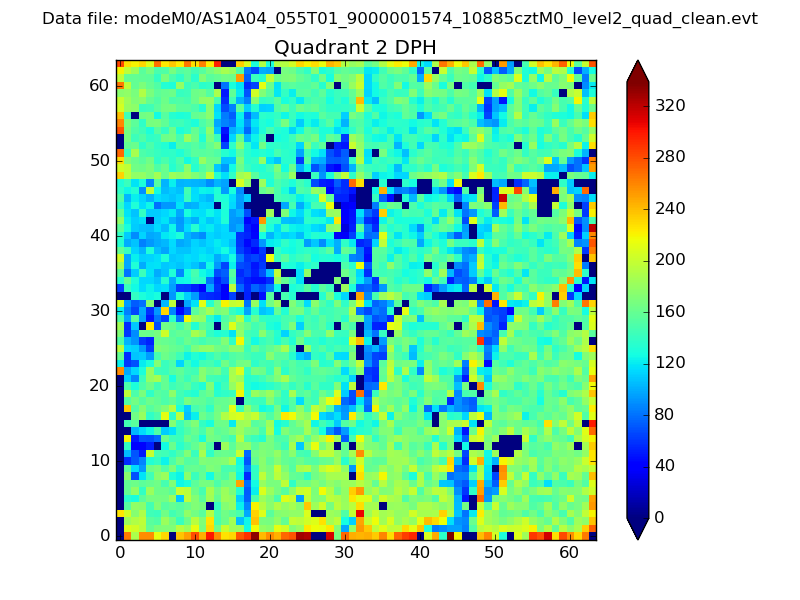
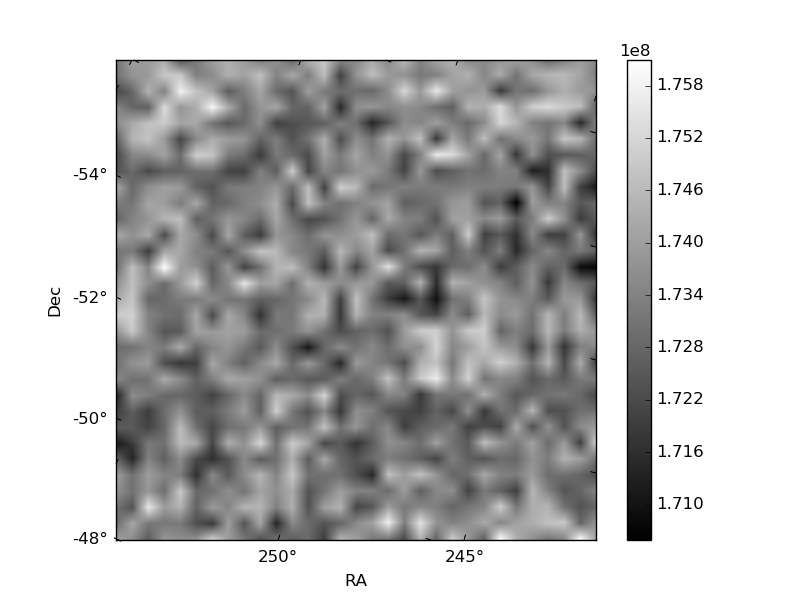
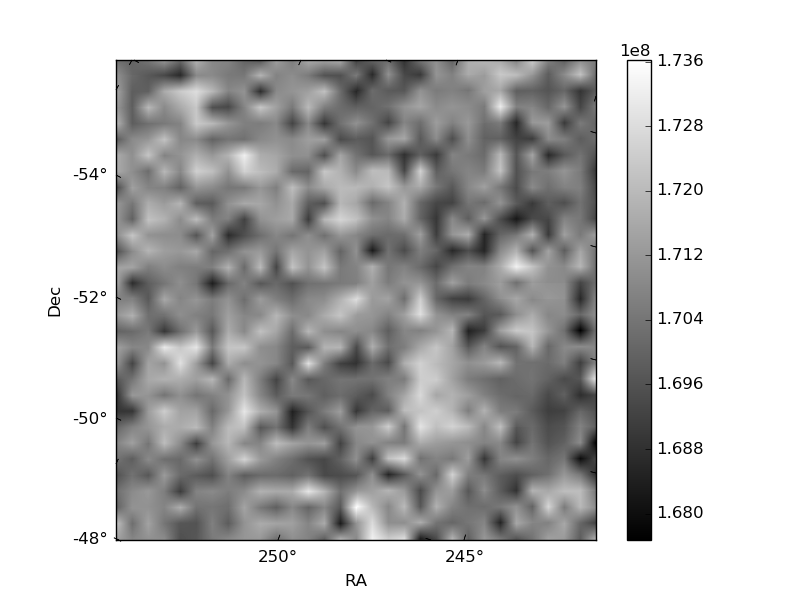
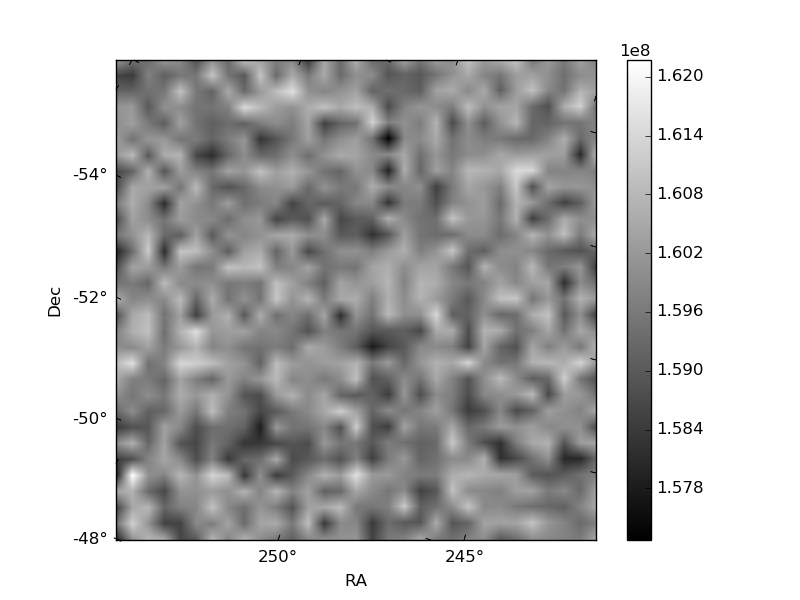
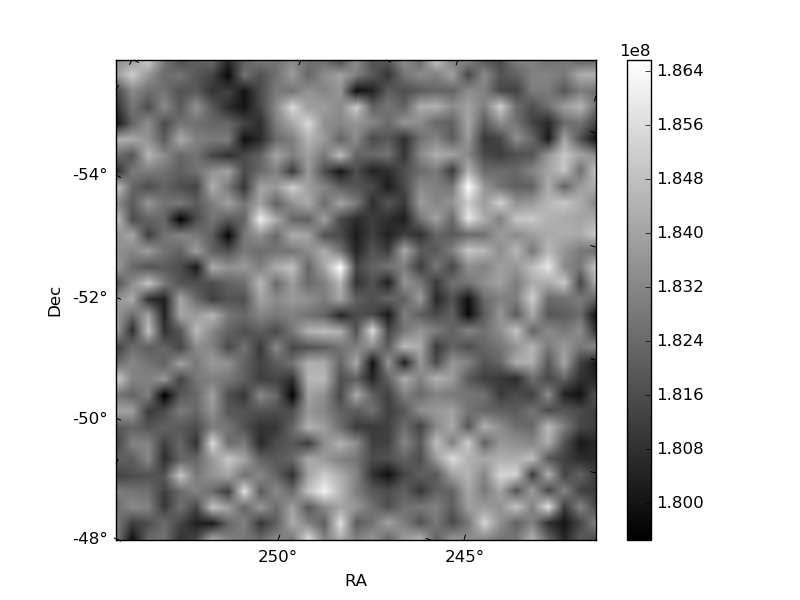
Histogram calculated using DETX and DETY for each event in the final _common_clean file
| Quadrant A | 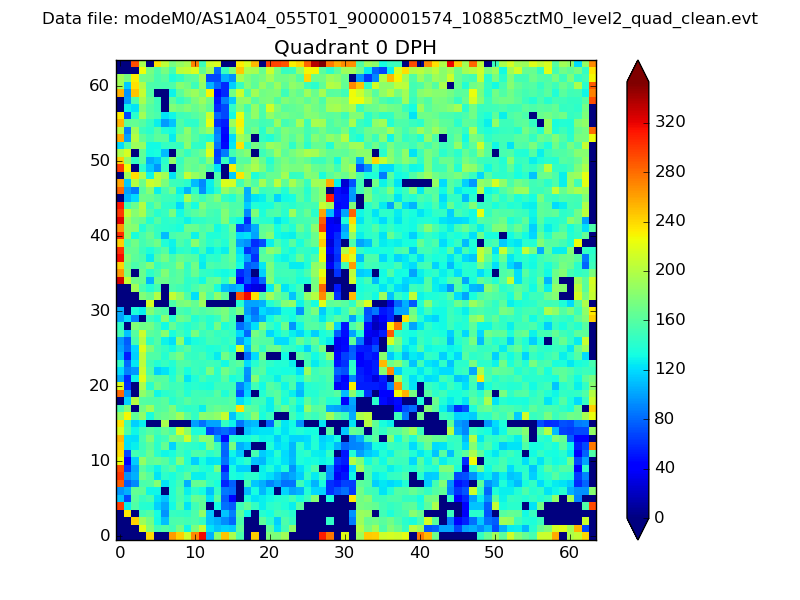 |
 |
Quadrant B |
|---|---|---|---|
| Quadrant D |  |
 |
Quadrant C |
| Plot type | Count rate plots | Images |
|---|---|---|
| Comparison with Poisson distribution Blue bars denote a histogram of data divided into 1 sec bins. Red curve is a Poisson curve with rate = median count rate of data. |
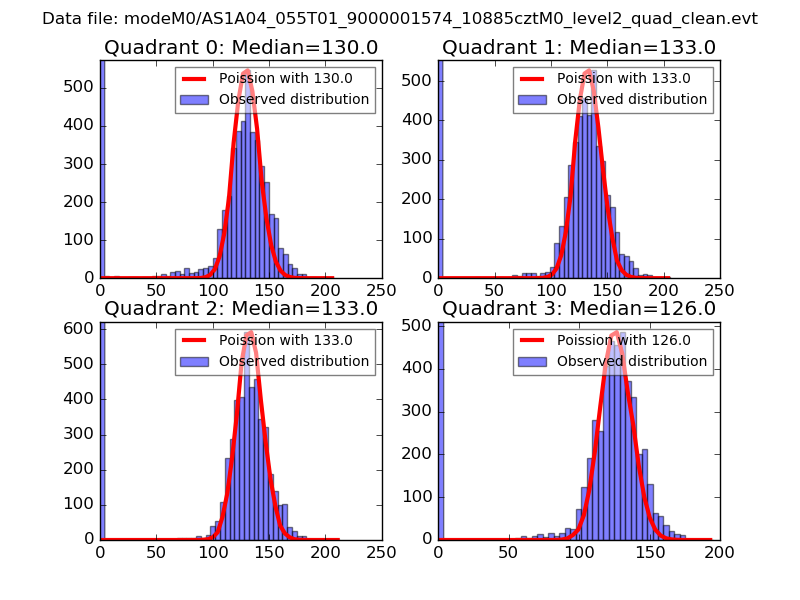 |
 |
| Quadrant-wise count rates Data is divided into 100 sec bins |
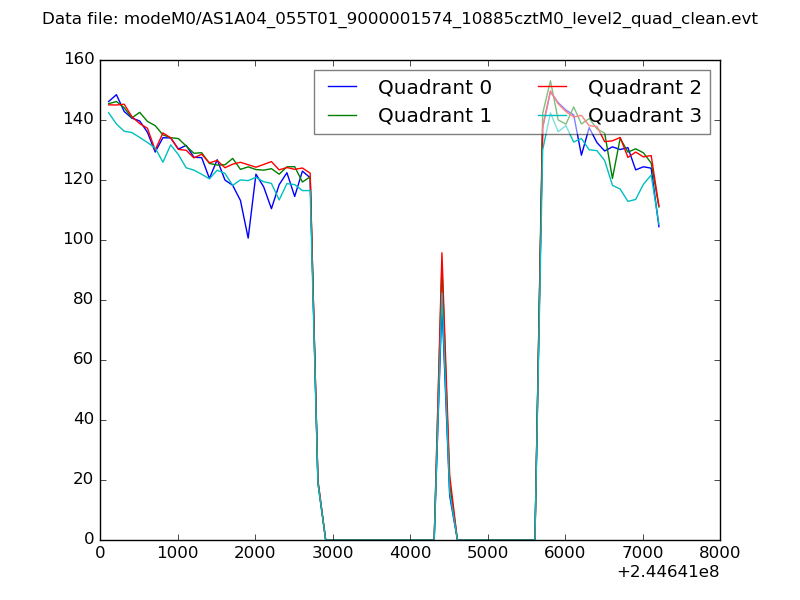 |
|
| Module-wise count rates for Quadrant A Data is divided into 100 sec bins |
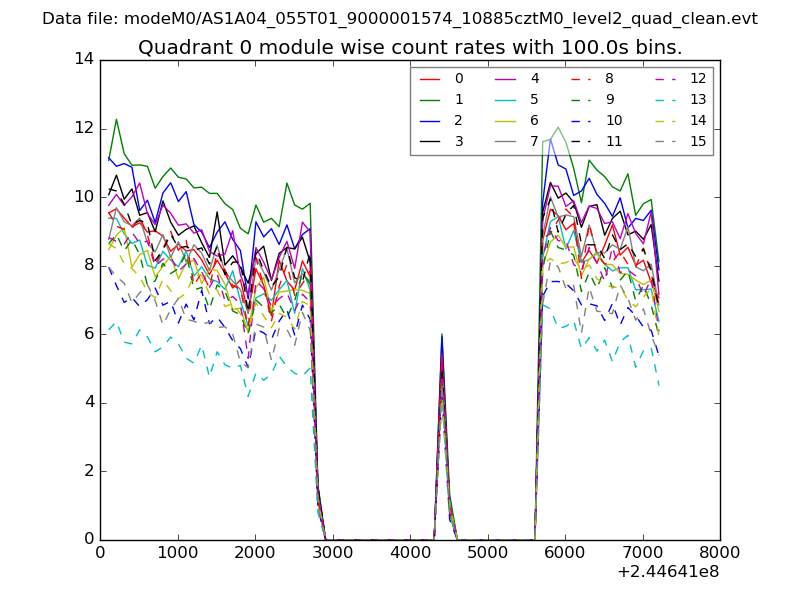 |
 |
| Module-wise count rates for Quadrant B Data is divided into 100 sec bins |
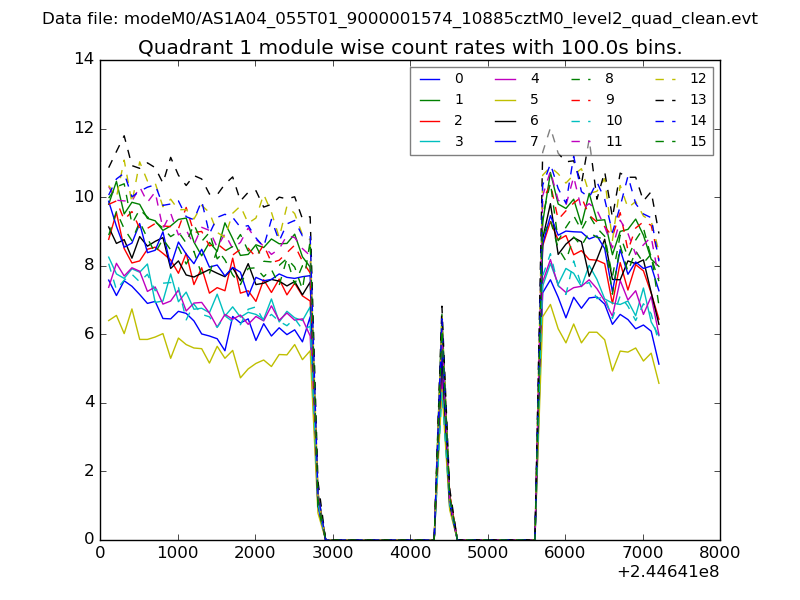 |
 |
| Module-wise count rates for Quadrant C Data is divided into 100 sec bins |
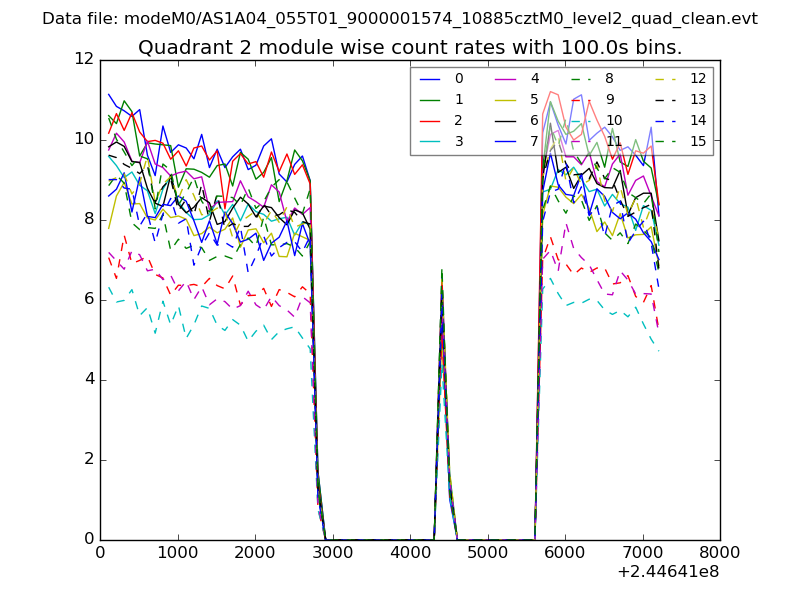 |
 |
| Module-wise count rates for Quadrant D Data is divided into 100 sec bins |
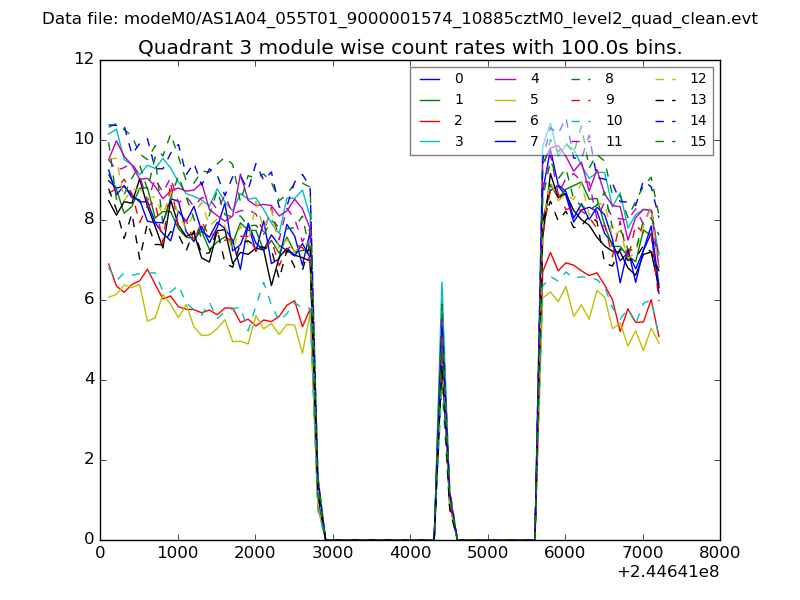 |
 |
| Parameter | Plot |
|---|---|
| CZT HV Monitor | 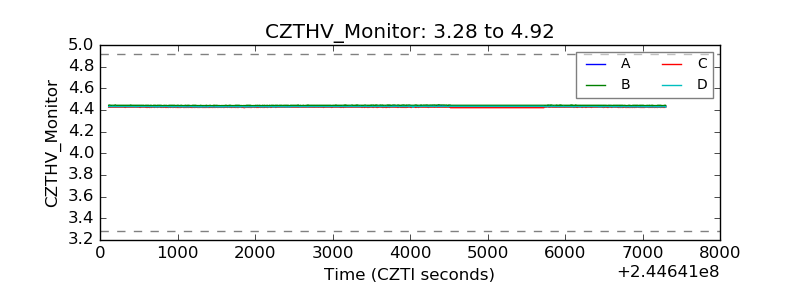 |
| D_VDD | 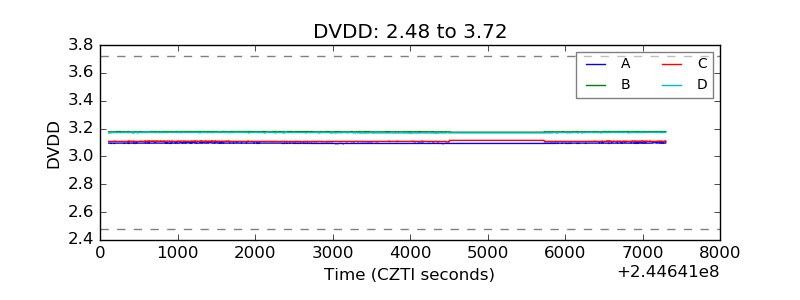 |
| Temperature 1 | 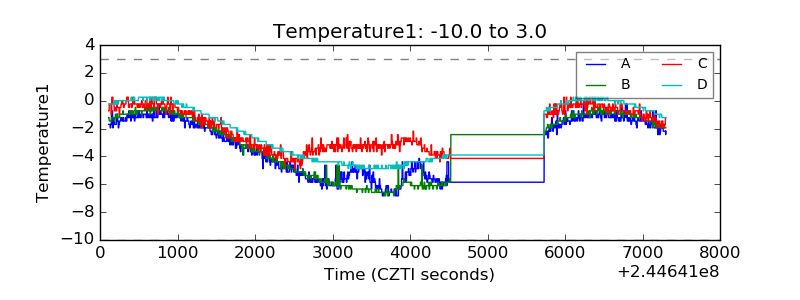 |
| Veto HV Monitor | 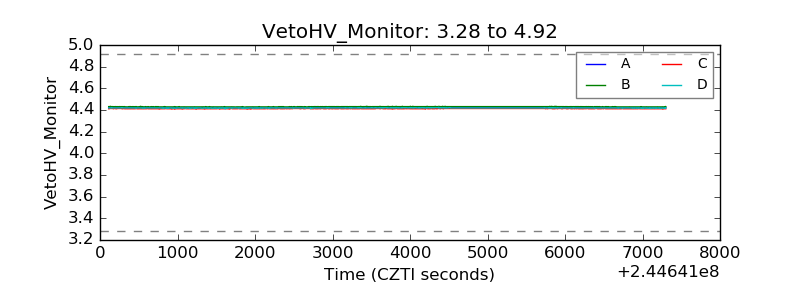 |
| Veto LLD |  |
| Alpha Counter | 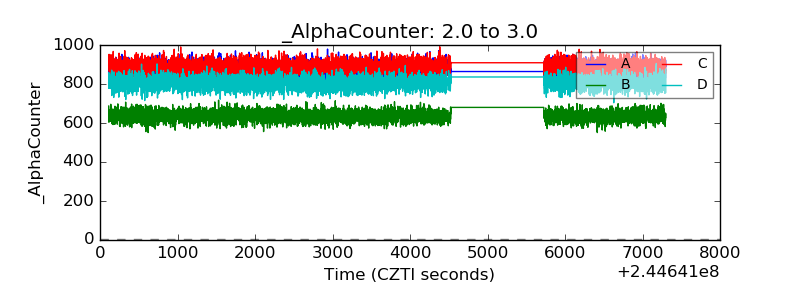 |
| _CPM_Rate | 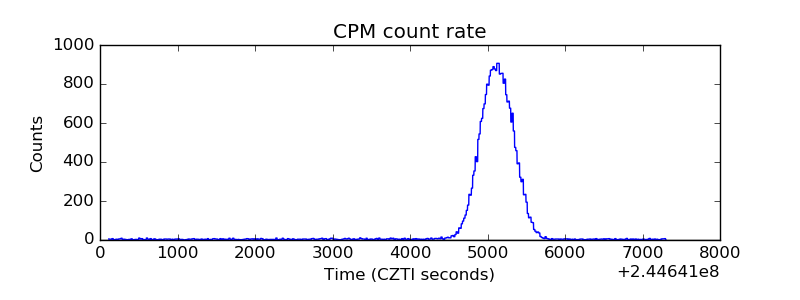 |
| CZT Counter | 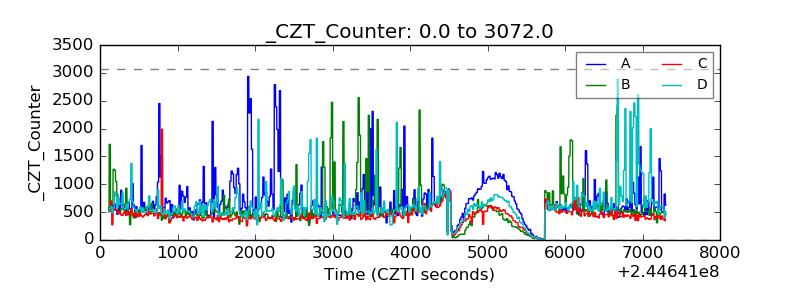 |
| +2.5 Volts monitor |  |
| +5 Volts monitor |  |
| _ROLL_ROT | 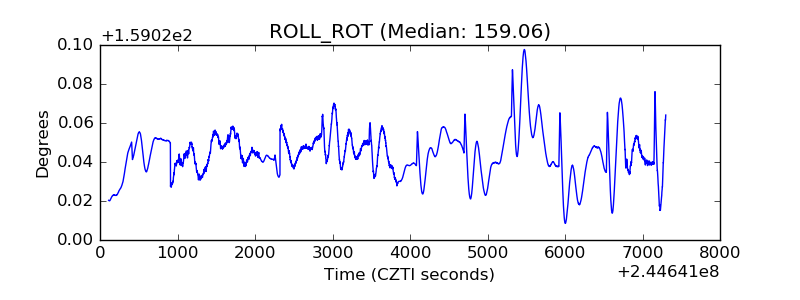 |
| _Roll_DEC | 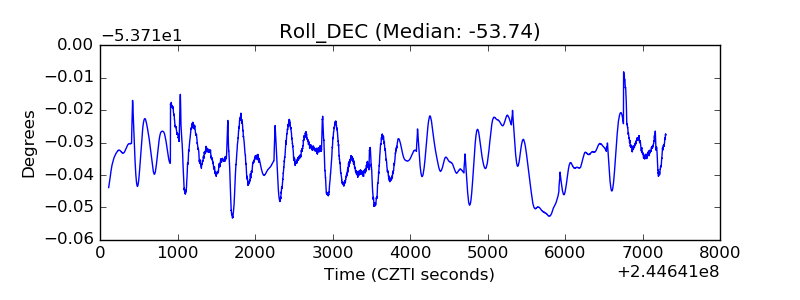 |
| _Roll_RA | 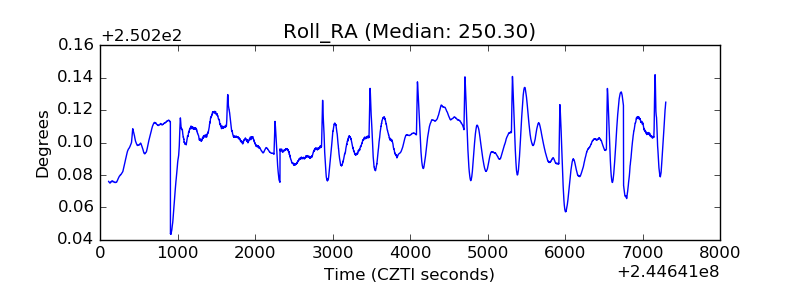 |
| Veto Counter | 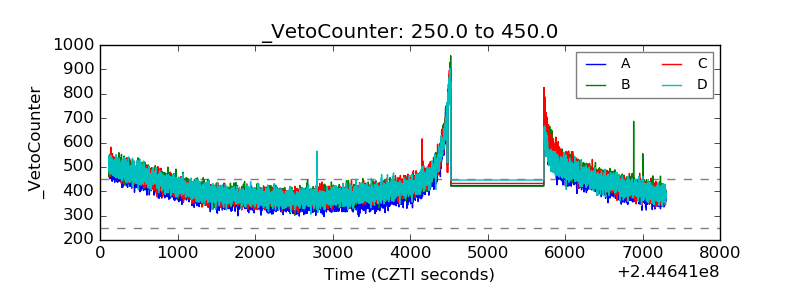 |