| Param | Original file | Final file |
|---|---|---|
| Filename | modeM0/AS1A04_055T01_9000001574_10886cztM0_level2.evt | modeM0/AS1A04_055T01_9000001574_10886cztM0_level2_quad_clean.evt |
| Size (bytes) | 576,371,520 | 92,615,040 |
| Size | 549.7 MB | 88.3 MB |
| Events in quadrant A | 4,601,200 | 590,457 |
| Events in quadrant B | 3,957,292 | 607,589 |
| Events in quadrant C | 2,830,715 | 611,539 |
| Events in quadrant D | 5,636,091 | 551,906 |
| Mode M0 | |||
|---|---|---|---|
| Quadrant | BADHDUFLAG | Total packets | Discarded packets |
| A | 0 | 17954 | 2 |
| B | 0 | 15867 | 1 |
| C | 0 | 13077 | 1 |
| D | 0 | 21056 | 1 |
| Mode M9 | |||
|---|---|---|---|
| Quadrant | BADHDUFLAG | Total packets | Discarded packets |
| A | 0 | 10 | 0 |
| B | 0 | 10 | 0 |
| C | 0 | 10 | 0 |
| D | 0 | 10 | 0 |
| Mode SS | |||
|---|---|---|---|
| Quadrant | BADHDUFLAG | Total packets | Discarded packets |
| A | 0 | 130 | 0 |
| B | 0 | 130 | 0 |
| C | 0 | 130 | 0 |
| D | 0 | 130 | 0 |
| Quadrant | Total seconds | Saturated seconds | Saturation percentage |
|---|---|---|---|
| A | 6343 | 382 | 6.022387% |
| B | 6343 | 272 | 4.288192% |
| C | 6343 | 27 | 0.425666% |
| D | 6343 | 742 | 11.697935% |
Noise dominated data is calculated using 1-second bins in cleaned event files. If a bin has >2000 counts, and if more than 50% of those come from <1% of pixels, then it is considered to be noise-dominated and hence unusable.
| Quadrant | # 1 sec bins | Bins with >0 counts | Bins with >2000 counts | High rate bins dominated by noise | Noise dominated (total time) | Noise dominated (detector-on time) | Marked lightcurve |
|---|---|---|---|---|---|---|---|
| A | 7393 | 6344 | 206 | 206 | 2.79% | 3.25% |  |
| B | 7393 | 6344 | 151 | 151 | 2.04% | 2.38% |  |
| C | 7393 | 6344 | 4 | 4 | 0.05% | 0.06% |  |
| D | 7393 | 6344 | 547 | 547 | 7.40% | 8.62% | 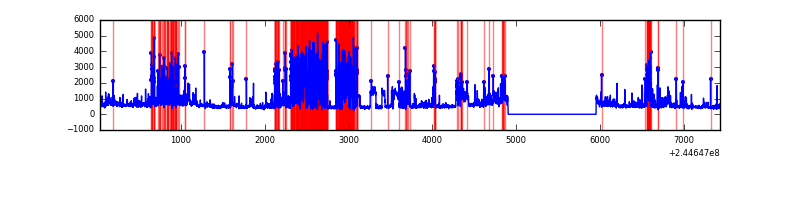 |
Top three noisy pixels from each quadrant. If the there are fewer than three noisy pixels in the level2.evt file, extra rows are filled as -1
| Pixel properties | Quadrant properties | ||||||
|---|---|---|---|---|---|---|---|
| Quadrant | DetID | PixID | Counts | Sigma | Mean | Median | Sigma |
| A | 8 | 5 | 1346665 | 8984.42 | 737 | 722 | 149.8 |
| A | 15 | 223 | 222467 | 1480.19 | 737 | 722 | 149.8 |
| A | 15 | 239 | 84216 | 557.34 | 737 | 722 | 149.8 |
| B | 4 | 239 | 886101 | 6247.12 | 743 | 727 | 141.7 |
| B | 0 | 219 | 81086 | 567.01 | 743 | 727 | 141.7 |
| B | 15 | 85 | 24142 | 165.21 | 743 | 727 | 141.7 |
| C | 0 | 207 | 30439 | 180.08 | 716 | 718 | 165.0 |
| C | 13 | 61 | 5386 | 28.28 | 716 | 718 | 165.0 |
| C | 8 | 222 | 3362 | 16.02 | 716 | 718 | 165.0 |
| D | 1 | 52 | 2280693 | 13624.17 | 683 | 660 | 167.4 |
| D | 8 | 195 | 290974 | 1734.75 | 683 | 660 | 167.4 |
| D | 13 | 104 | 141331 | 840.57 | 683 | 660 | 167.4 |
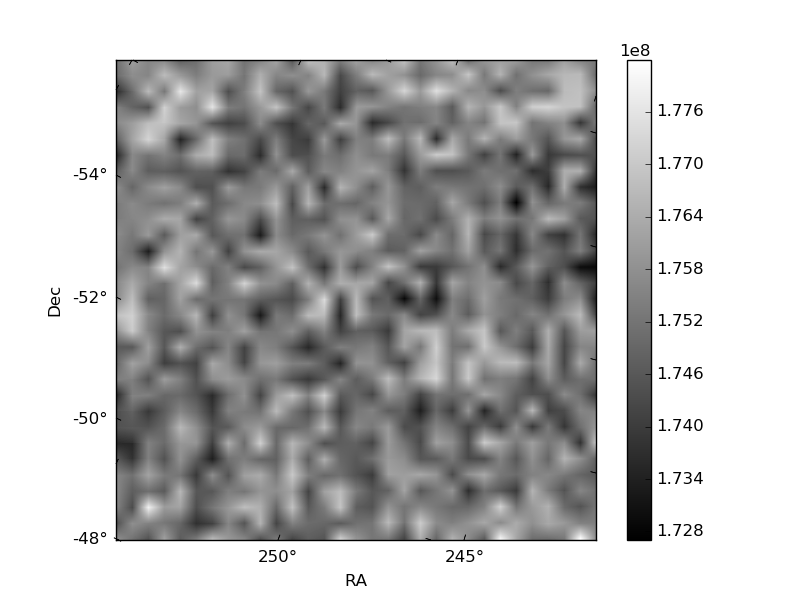
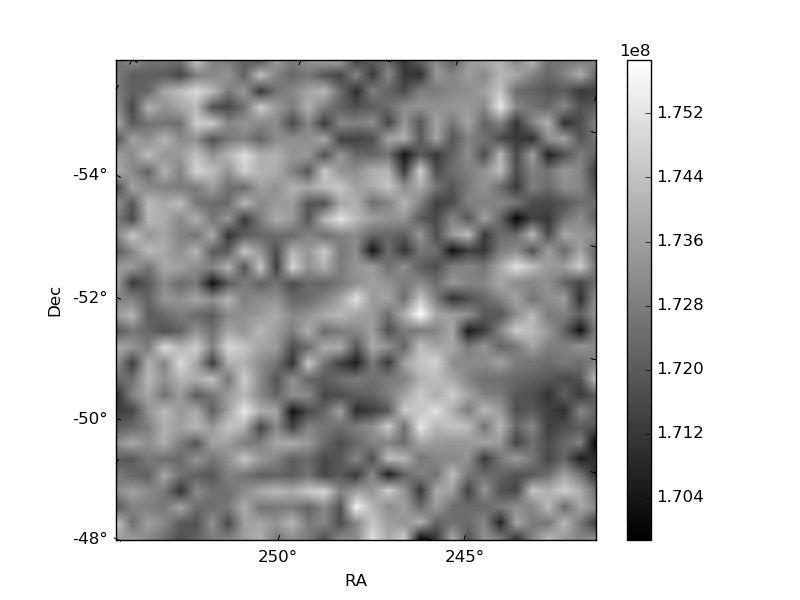
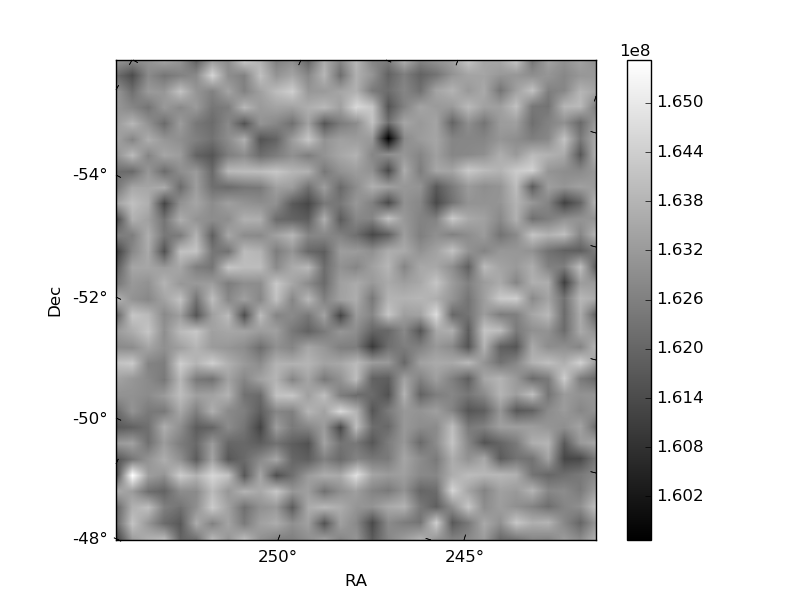
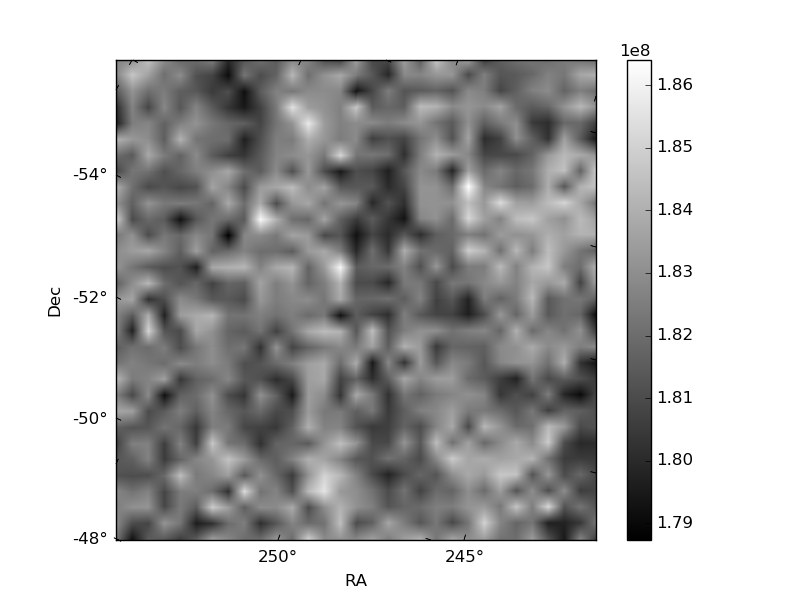
Histogram calculated using DETX and DETY for each event in the final _common_clean file
| Quadrant A | 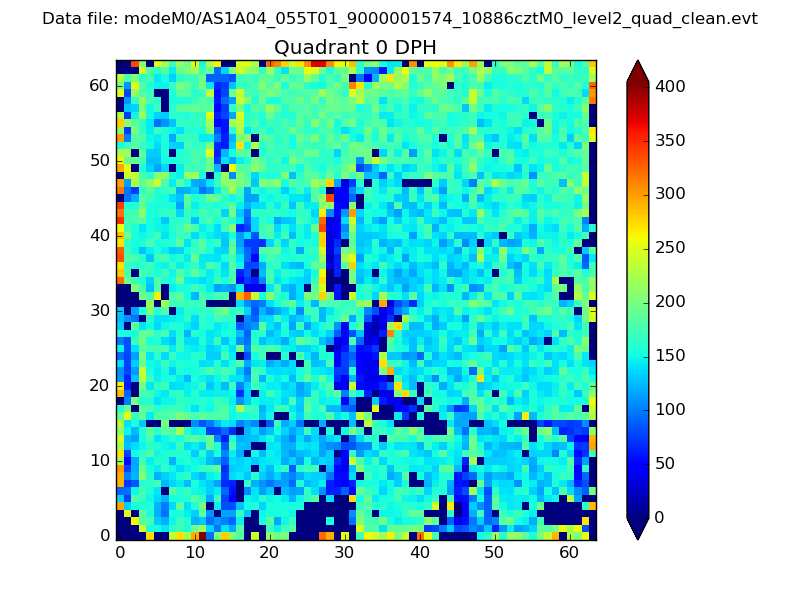 |
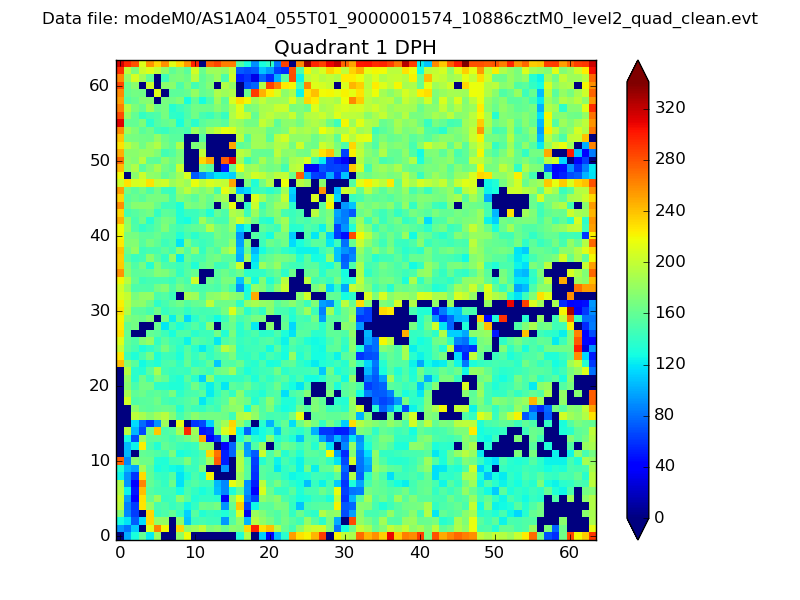 |
Quadrant B |
|---|---|---|---|
| Quadrant D | 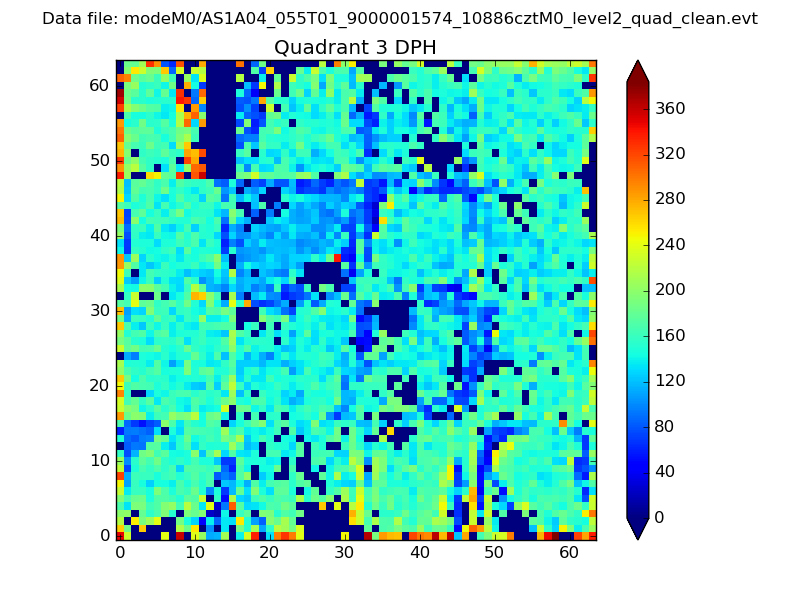 |
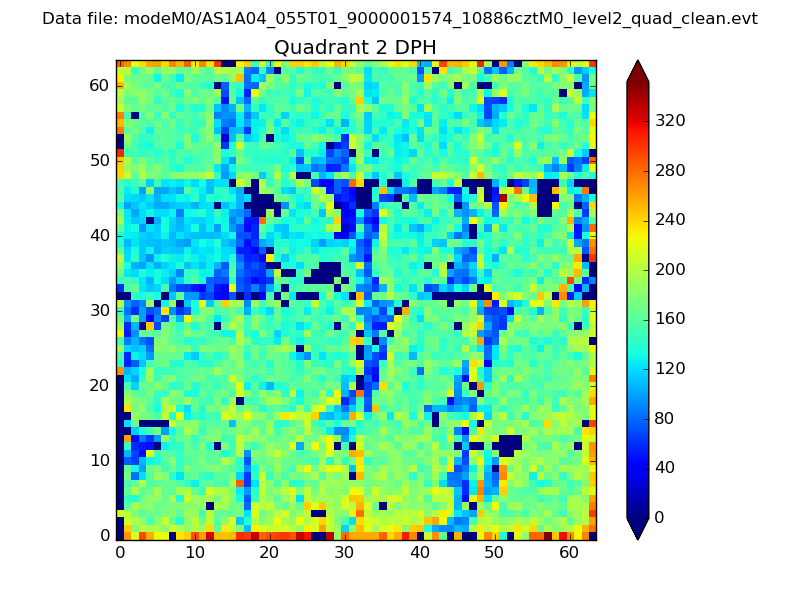 |
Quadrant C |
| Plot type | Count rate plots | Images |
|---|---|---|
| Comparison with Poisson distribution Blue bars denote a histogram of data divided into 1 sec bins. Red curve is a Poisson curve with rate = median count rate of data. |
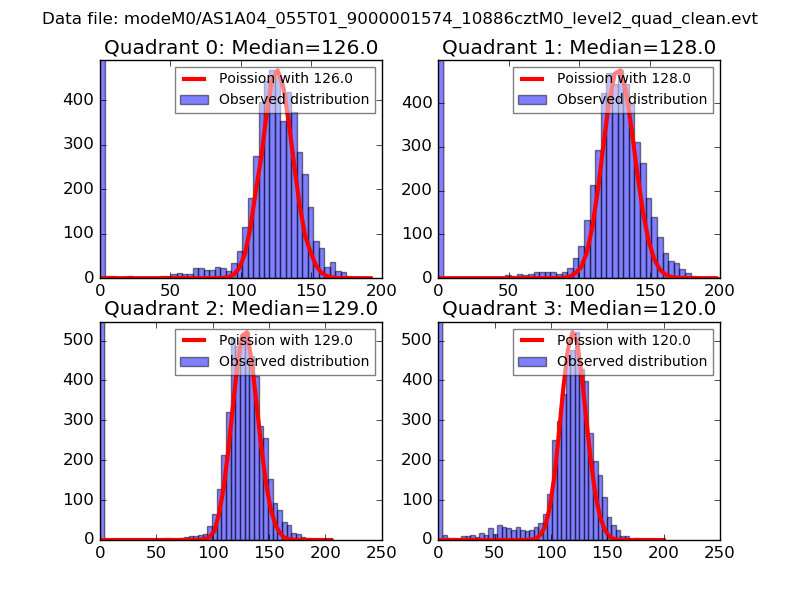 |
 |
| Quadrant-wise count rates Data is divided into 100 sec bins |
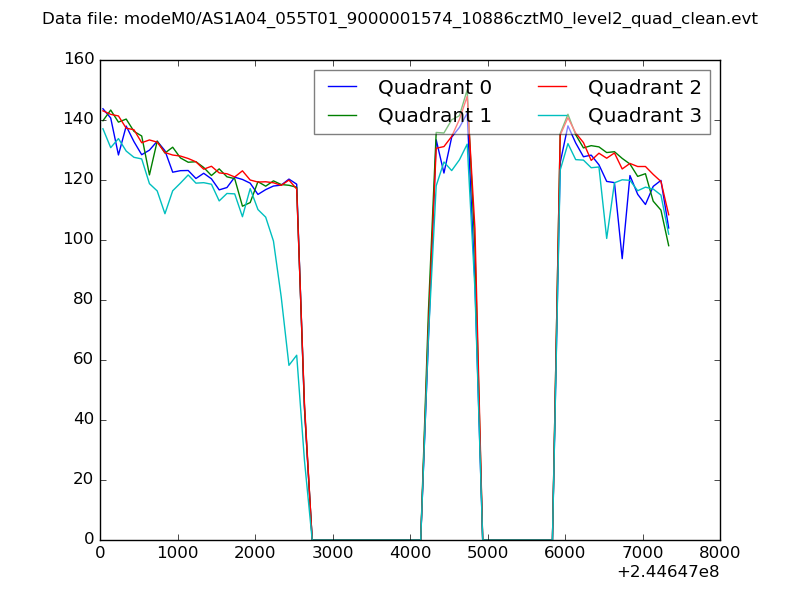 |
|
| Module-wise count rates for Quadrant A Data is divided into 100 sec bins |
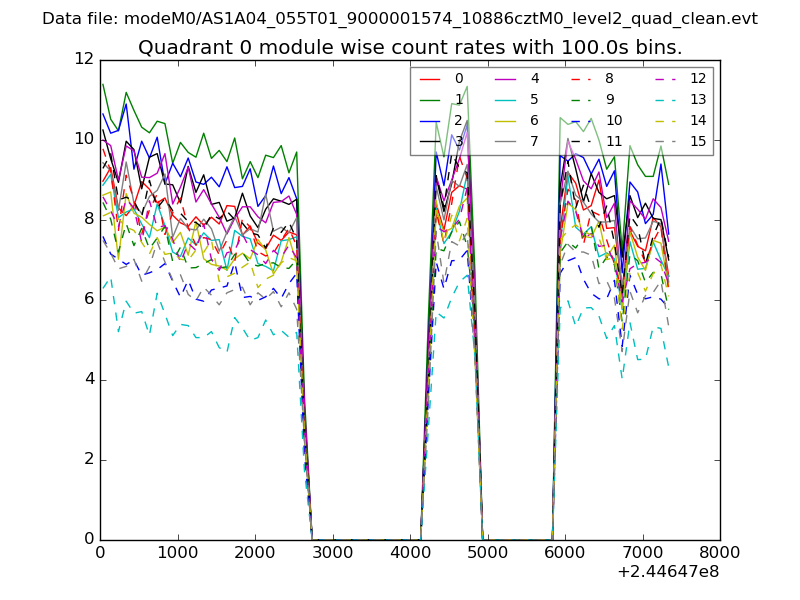 |
 |
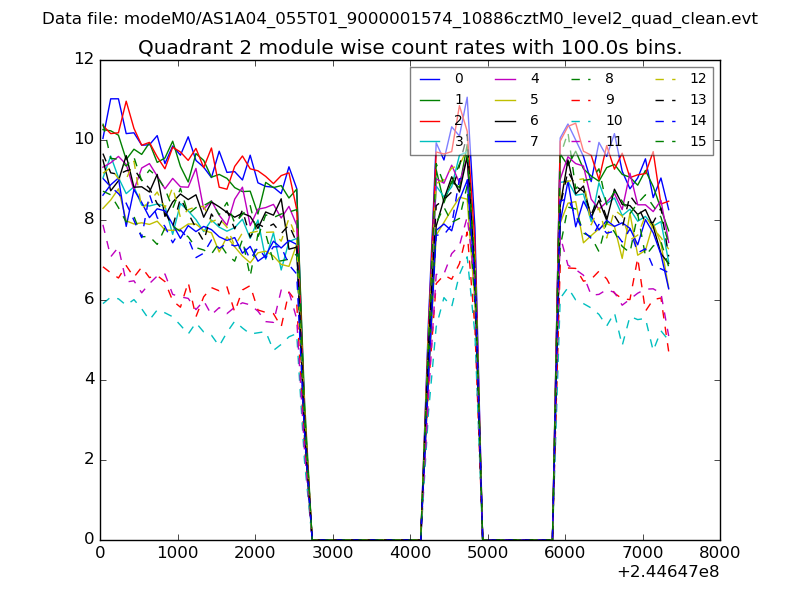
| Module-wise count rates for Quadrant B Data is divided into 100 sec bins |
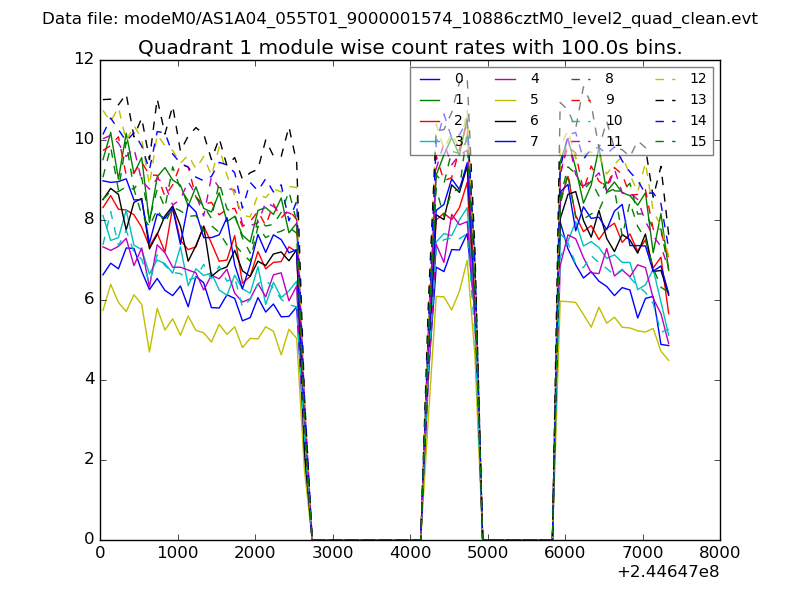 |
 |
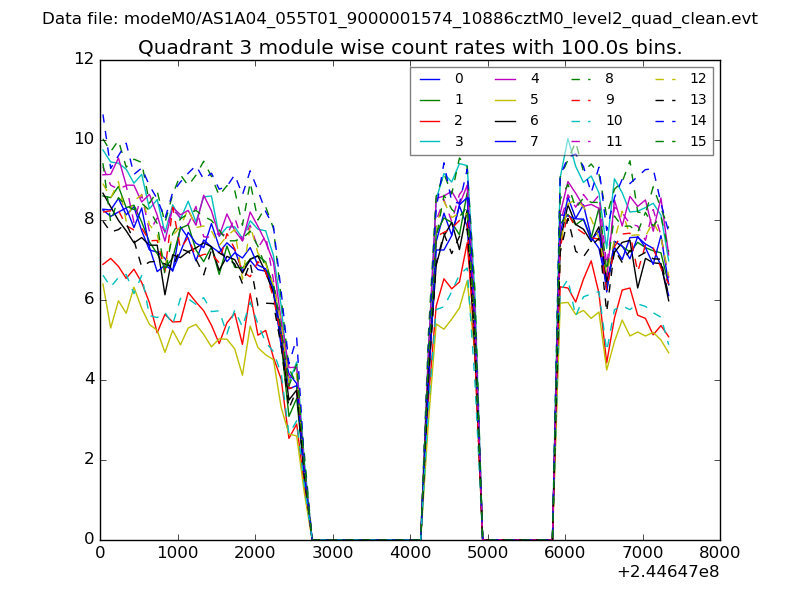
| Module-wise count rates for Quadrant C Data is divided into 100 sec bins |
 |
 |
| Module-wise count rates for Quadrant D Data is divided into 100 sec bins |
 |
 |
| Parameter | Plot |
|---|---|
| CZT HV Monitor | 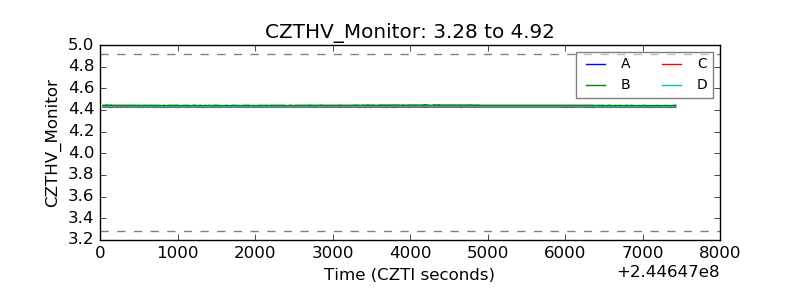 |
| D_VDD | 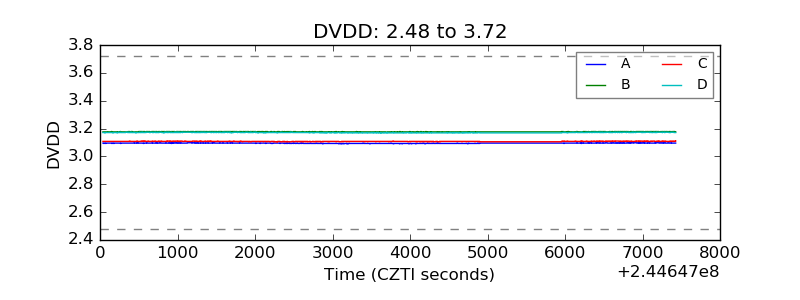 |
| Temperature 1 | 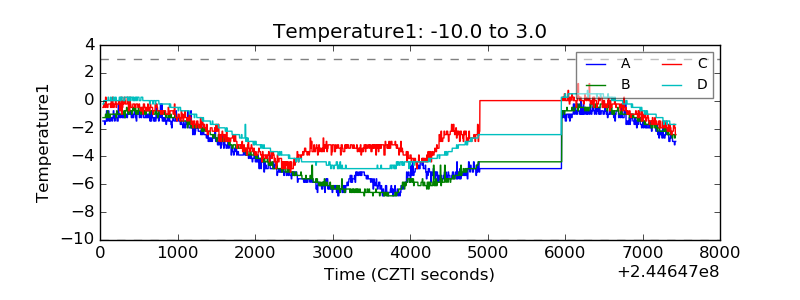 |
| Veto HV Monitor | 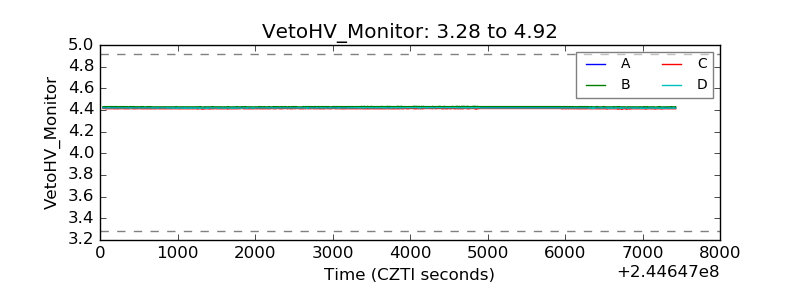 |
| Veto LLD |  |
| Alpha Counter | 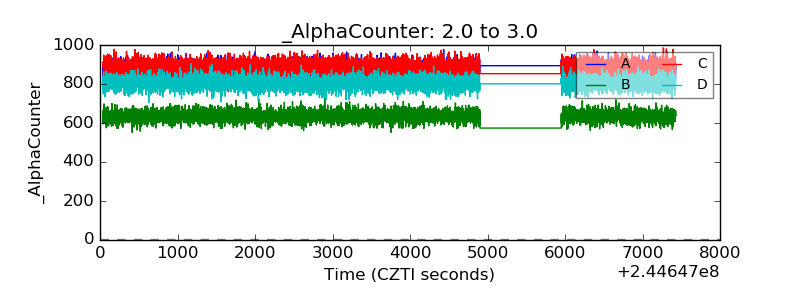 |
| _CPM_Rate | 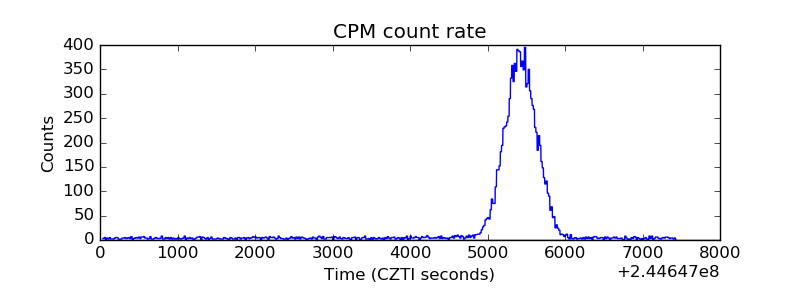 |
| CZT Counter | 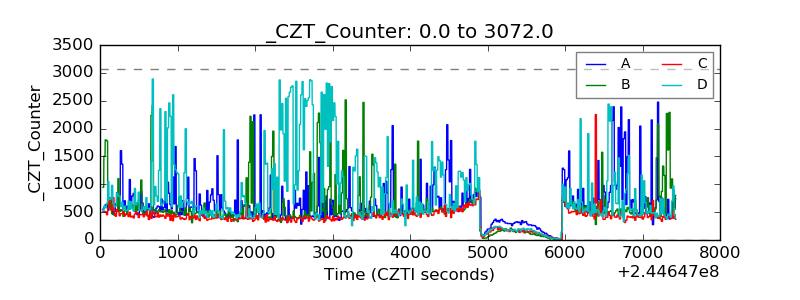 |
| +2.5 Volts monitor |  |
| +5 Volts monitor |  |
| _ROLL_ROT | 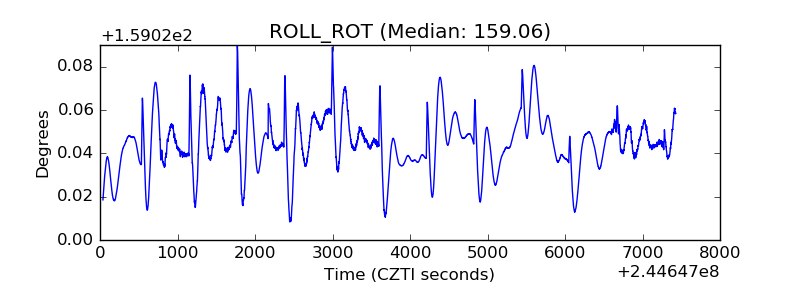 |
| _Roll_DEC | 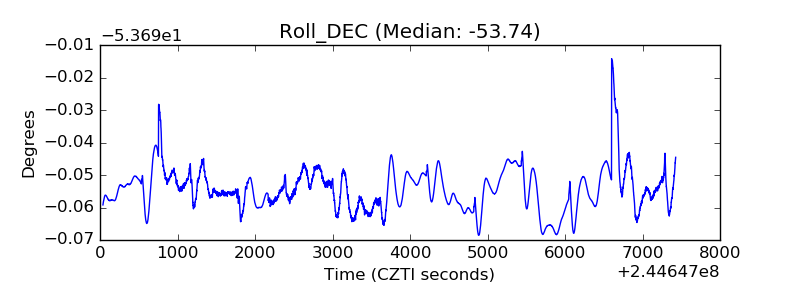 |
| _Roll_RA | 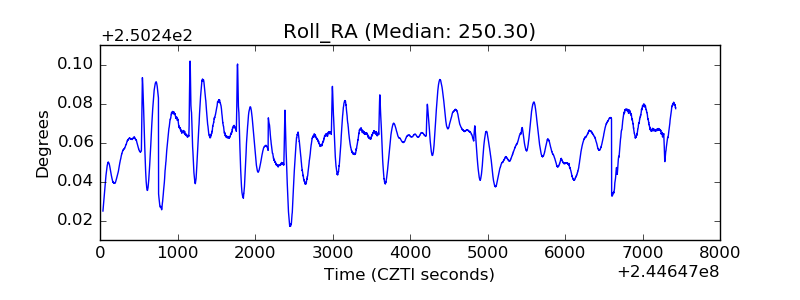 |
| Veto Counter | 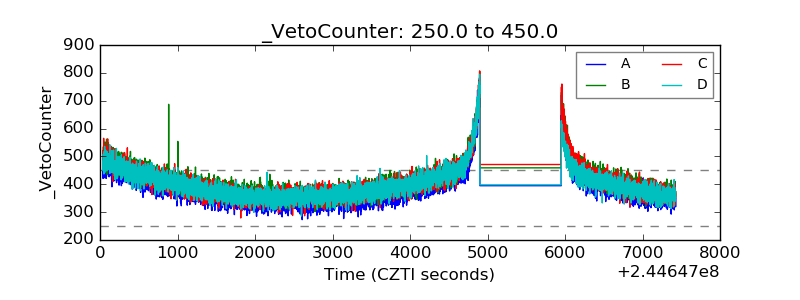 |