| Param | Original file | Final file |
|---|---|---|
| Filename | modeM0/AS1A04_055T01_9000001574_10887cztM0_level2.evt | modeM0/AS1A04_055T01_9000001574_10887cztM0_level2_quad_clean.evt |
| Size (bytes) | 525,456,000 | 86,402,880 |
| Size | 501.1 MB | 82.4 MB |
| Events in quadrant A | 3,776,129 | 554,285 |
| Events in quadrant B | 5,197,324 | 521,631 |
| Events in quadrant C | 2,675,986 | 570,838 |
| Events in quadrant D | 3,843,350 | 536,686 |
| Mode M0 | |||
|---|---|---|---|
| Quadrant | BADHDUFLAG | Total packets | Discarded packets |
| A | 0 | 15323 | 2 |
| B | 0 | 19583 | 1 |
| C | 0 | 12584 | 1 |
| D | 0 | 15613 | 1 |
| Mode M9 | |||
|---|---|---|---|
| Quadrant | BADHDUFLAG | Total packets | Discarded packets |
| A | 0 | 7 | 0 |
| B | 0 | 7 | 0 |
| C | 0 | 7 | 0 |
| D | 0 | 7 | 0 |
| Mode SS | |||
|---|---|---|---|
| Quadrant | BADHDUFLAG | Total packets | Discarded packets |
| A | 0 | 128 | 0 |
| B | 0 | 128 | 0 |
| C | 0 | 128 | 0 |
| D | 0 | 128 | 0 |
| Quadrant | Total seconds | Saturated seconds | Saturation percentage |
|---|---|---|---|
| A | 6189 | 194 | 3.134594% |
| B | 6189 | 900 | 14.541929% |
| C | 6189 | 7 | 0.113104% |
| D | 6189 | 138 | 2.229762% |
Noise dominated data is calculated using 1-second bins in cleaned event files. If a bin has >2000 counts, and if more than 50% of those come from <1% of pixels, then it is considered to be noise-dominated and hence unusable.
| Quadrant | # 1 sec bins | Bins with >0 counts | Bins with >2000 counts | High rate bins dominated by noise | Noise dominated (total time) | Noise dominated (detector-on time) | Marked lightcurve |
|---|---|---|---|---|---|---|---|
| A | 6964 | 6190 | 114 | 114 | 1.64% | 1.84% | 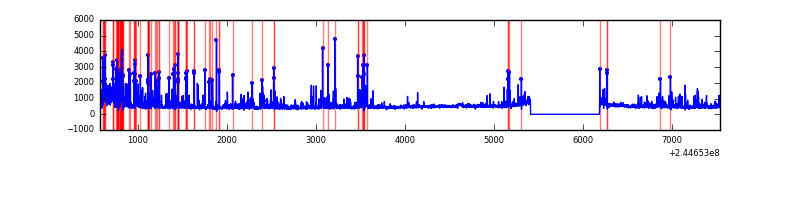 |
| B | 6964 | 6190 | 642 | 642 | 9.22% | 10.37% | 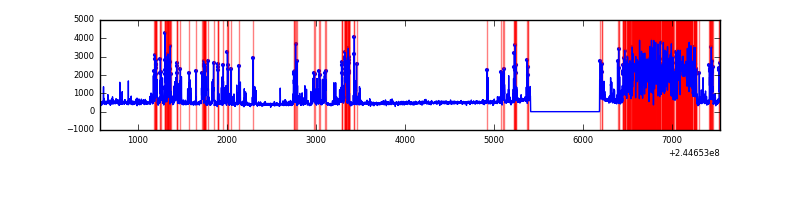 |
| C | 6964 | 6190 | 2 | 2 | 0.03% | 0.03% | 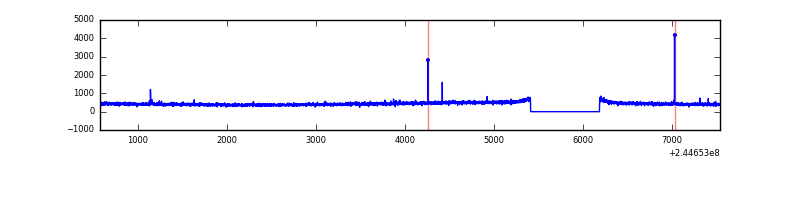 |
| D | 6964 | 6190 | 118 | 118 | 1.69% | 1.91% | 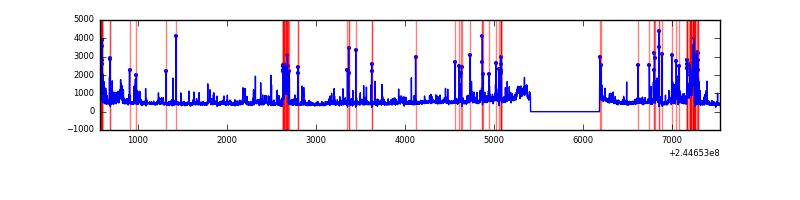 |
Top three noisy pixels from each quadrant. If the there are fewer than three noisy pixels in the level2.evt file, extra rows are filled as -1
| Pixel properties | Quadrant properties | ||||||
|---|---|---|---|---|---|---|---|
| Quadrant | DetID | PixID | Counts | Sigma | Mean | Median | Sigma |
| A | 8 | 5 | 745601 | 5185.26 | 702 | 688 | 143.7 |
| A | 15 | 223 | 159062 | 1102.42 | 702 | 688 | 143.7 |
| A | 5 | 16 | 58058 | 399.35 | 702 | 688 | 143.7 |
| B | 4 | 239 | 2257084 | 17709.41 | 670 | 655 | 127.4 |
| B | 0 | 182 | 196420 | 1536.45 | 670 | 655 | 127.4 |
| B | 0 | 219 | 35848 | 276.21 | 670 | 655 | 127.4 |
| C | 0 | 207 | 12105 | 72.91 | 679 | 682 | 156.7 |
| C | 13 | 61 | 5115 | 28.29 | 679 | 682 | 156.7 |
| C | 14 | 234 | 5029 | 27.75 | 679 | 682 | 156.7 |
| D | 1 | 52 | 426537 | 2606.35 | 675 | 655 | 163.4 |
| D | 13 | 249 | 331066 | 2022.07 | 675 | 655 | 163.4 |
| D | 13 | 104 | 150855 | 919.2 | 675 | 655 | 163.4 |
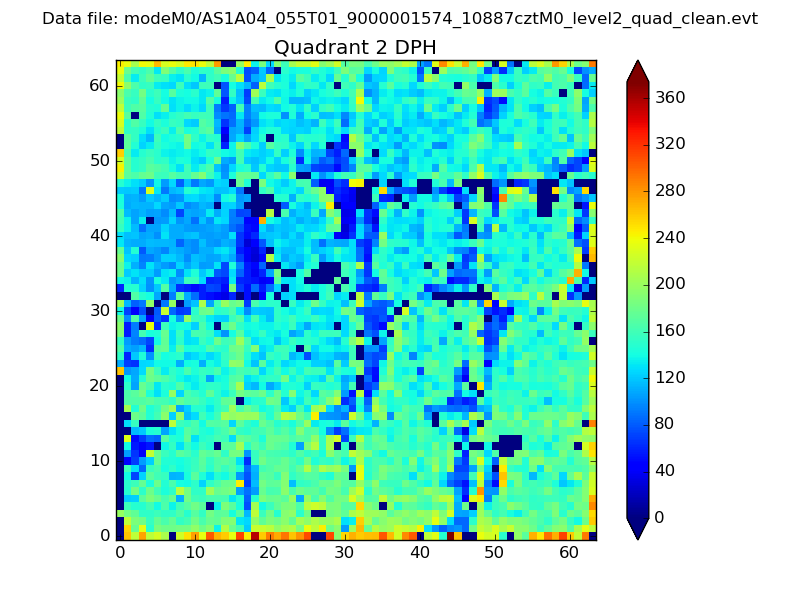
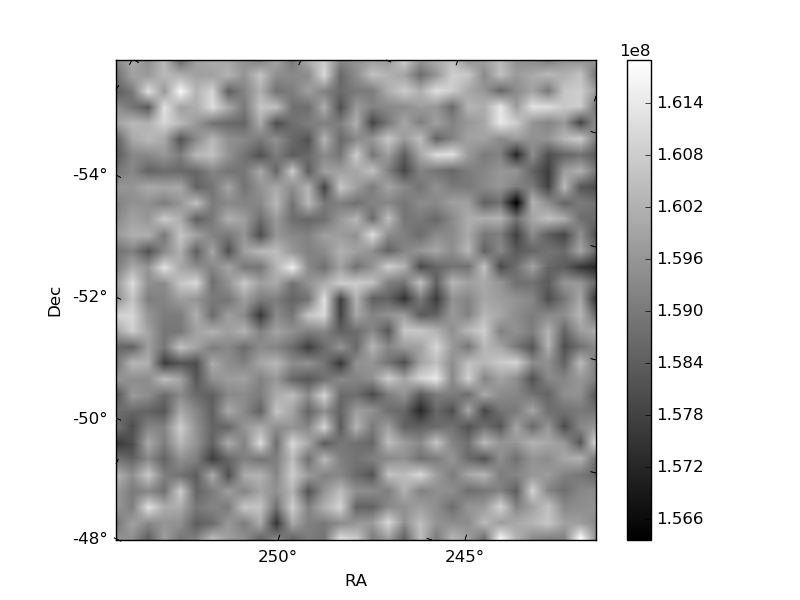
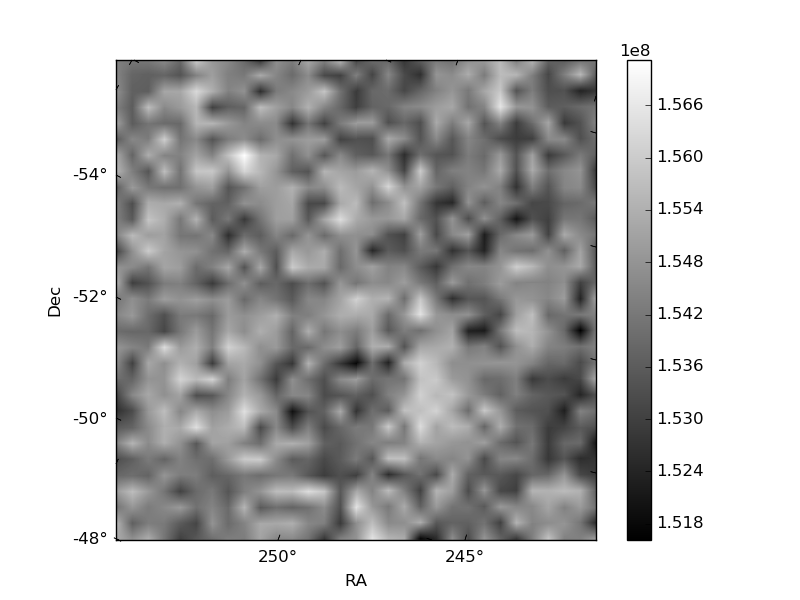
Histogram calculated using DETX and DETY for each event in the final _common_clean file
| Quadrant A | 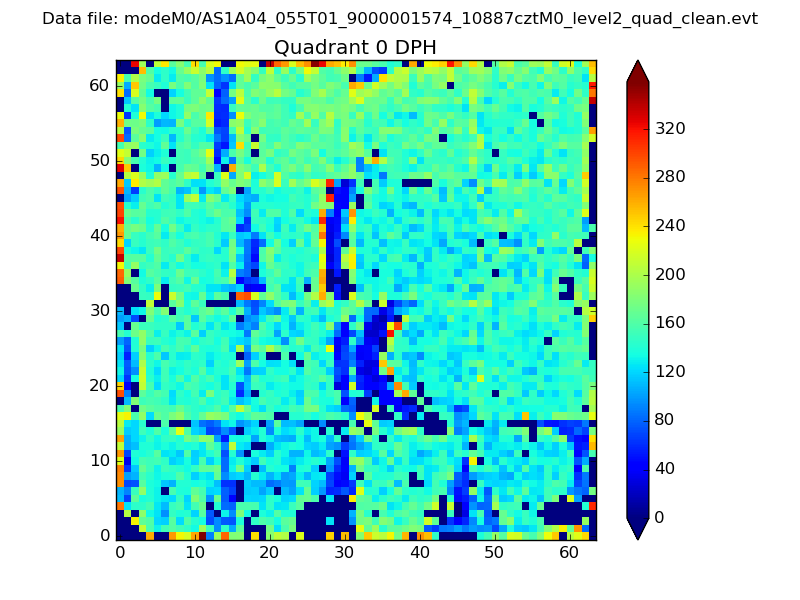 |
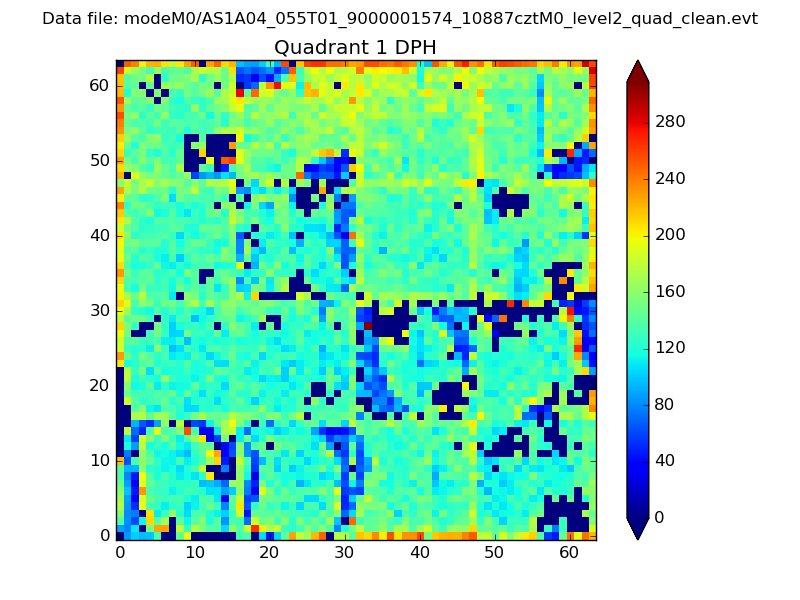 |
Quadrant B |
|---|---|---|---|
| Quadrant D | 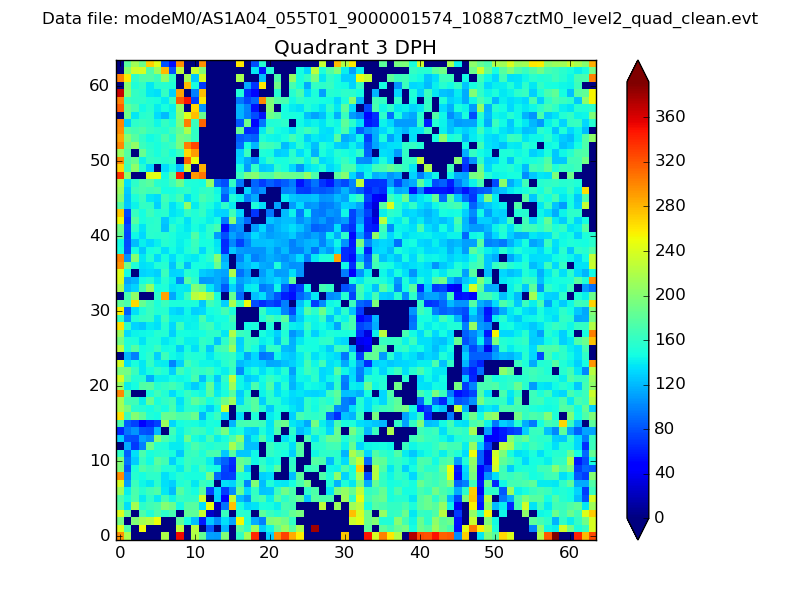 |
 |
Quadrant C |
| Plot type | Count rate plots | Images |
|---|---|---|
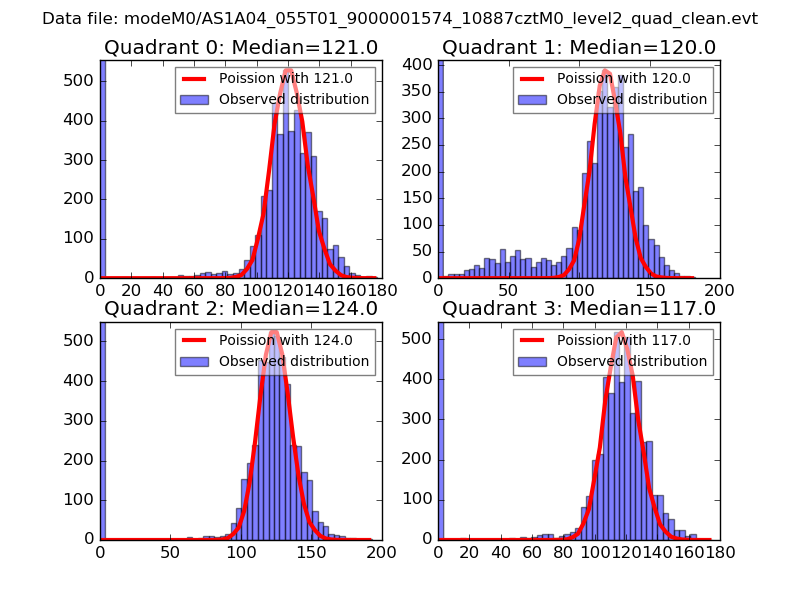
| Comparison with Poisson distribution Blue bars denote a histogram of data divided into 1 sec bins. Red curve is a Poisson curve with rate = median count rate of data. |
 |
 |
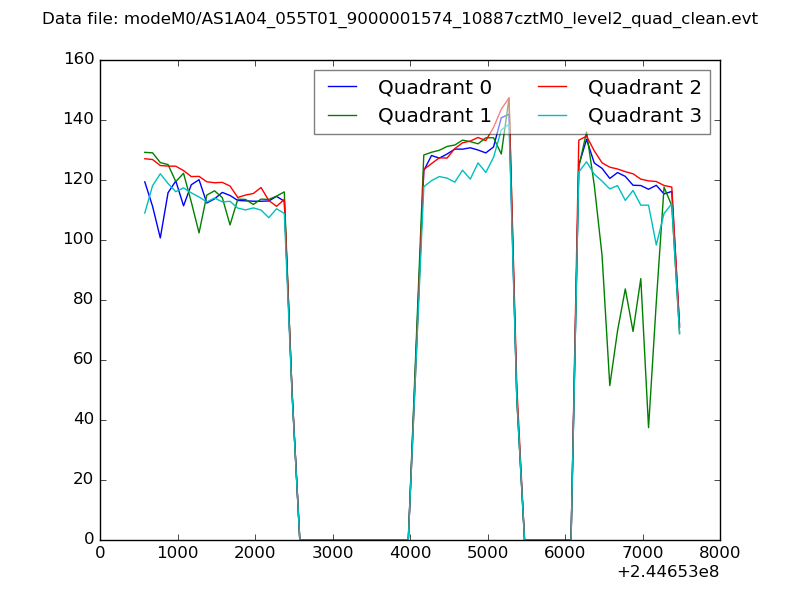
| Quadrant-wise count rates Data is divided into 100 sec bins |
 |
|
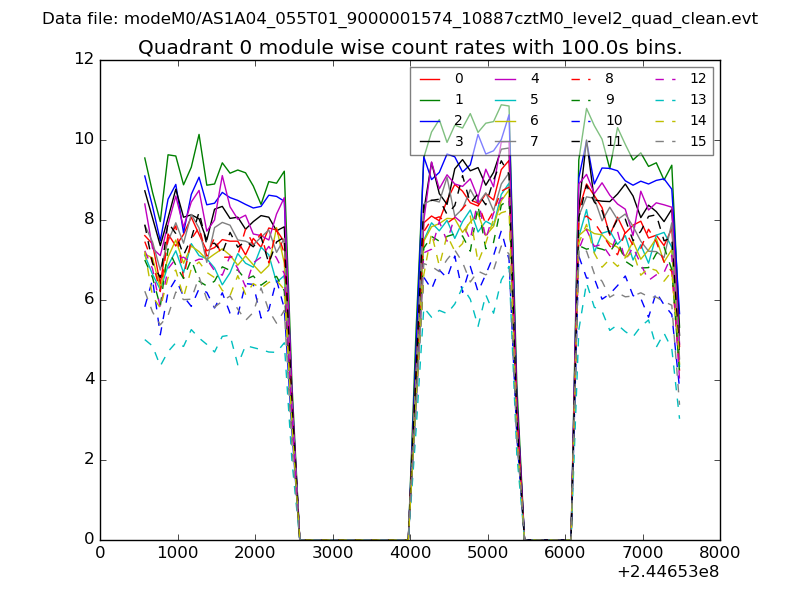
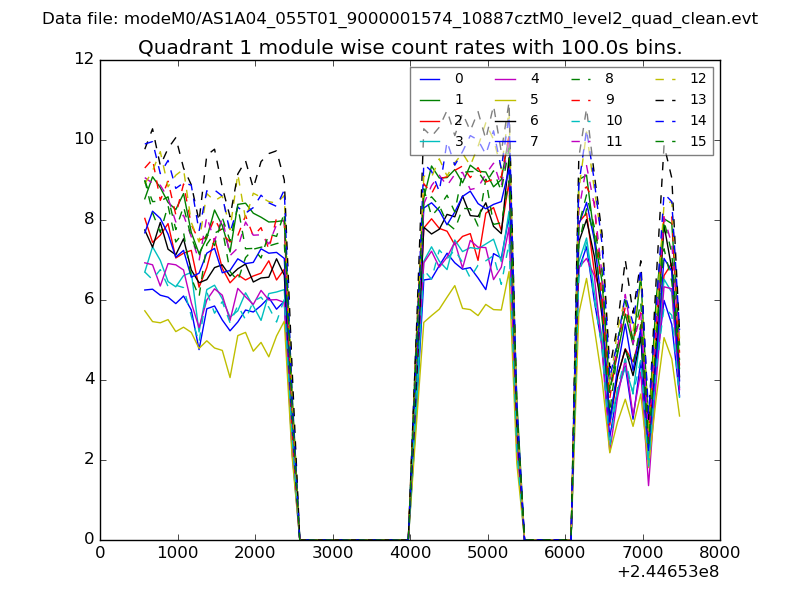
| Module-wise count rates for Quadrant A Data is divided into 100 sec bins |
 |
 |
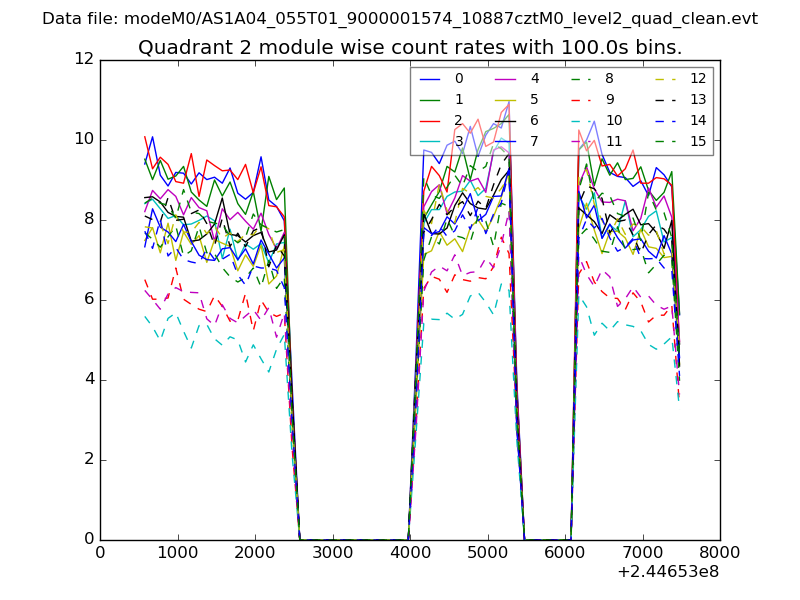
| Module-wise count rates for Quadrant B Data is divided into 100 sec bins |
 |
 |
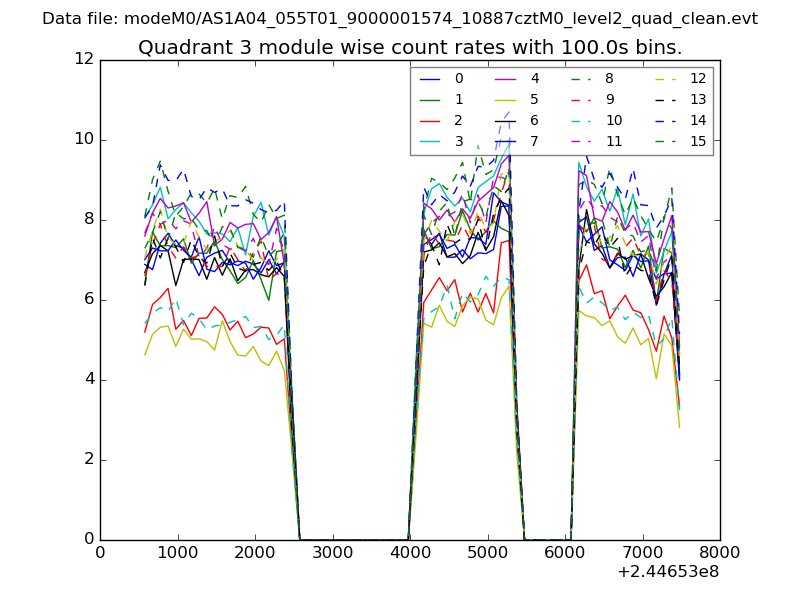
| Module-wise count rates for Quadrant C Data is divided into 100 sec bins |
 |
 |
| Module-wise count rates for Quadrant D Data is divided into 100 sec bins |
 |
 |
| Parameter | Plot |
|---|---|
| CZT HV Monitor |  |
| D_VDD | 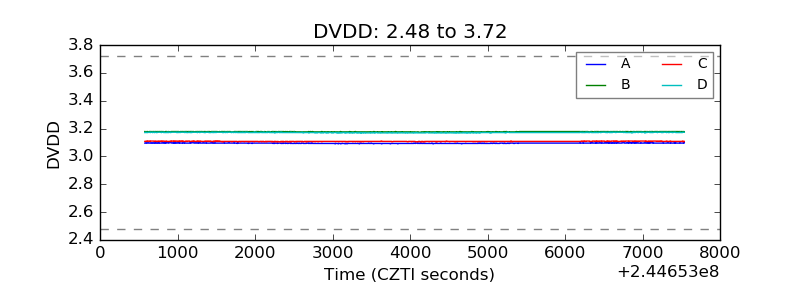 |
| Temperature 1 | 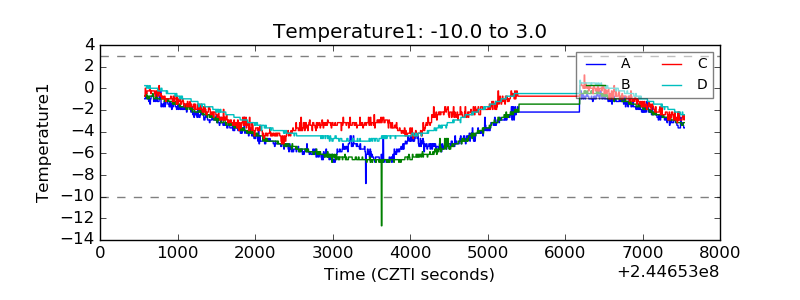 |
| Veto HV Monitor | 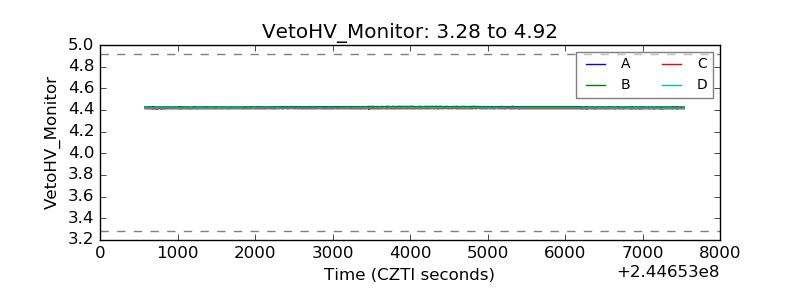 |
| Veto LLD | 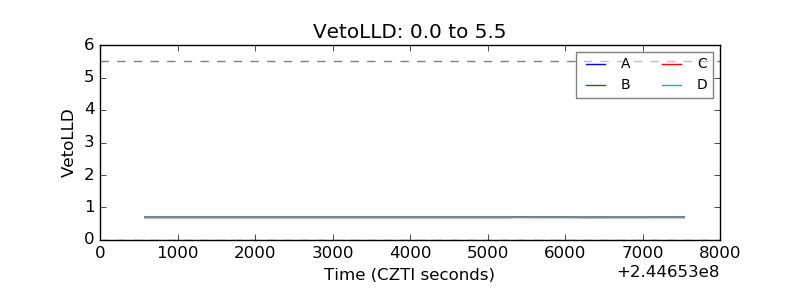 |
| Alpha Counter | 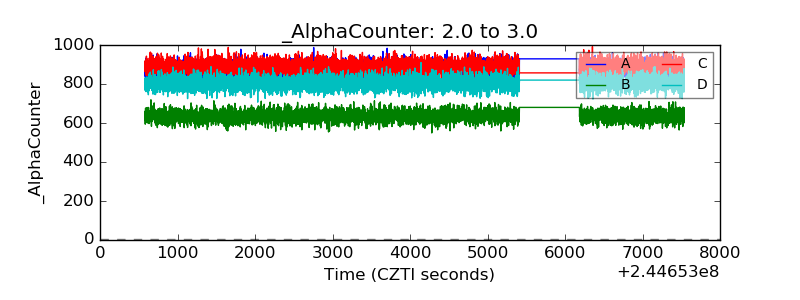 |
| _CPM_Rate | 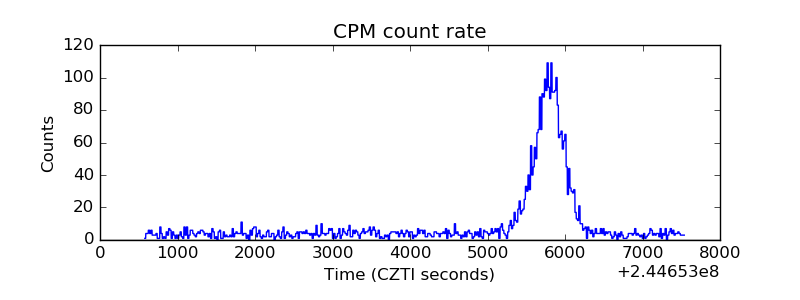 |
| CZT Counter | 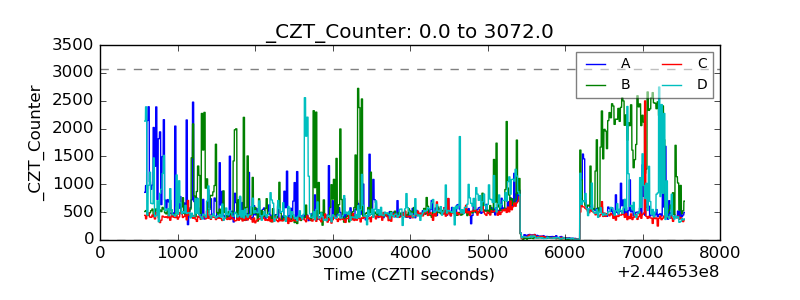 |
| +2.5 Volts monitor |  |
| +5 Volts monitor |  |
| _ROLL_ROT | 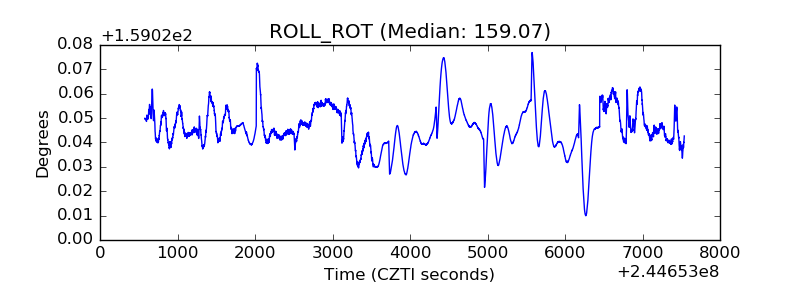 |
| _Roll_DEC | 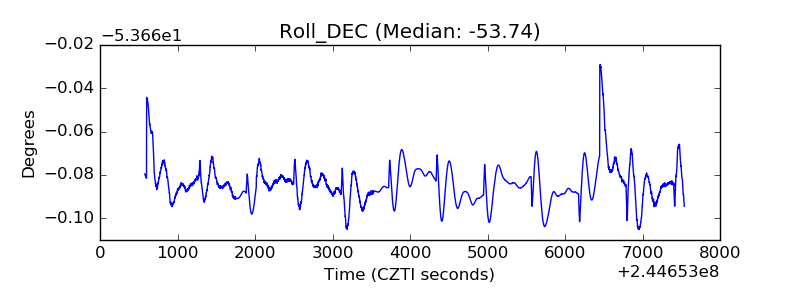 |
| _Roll_RA | 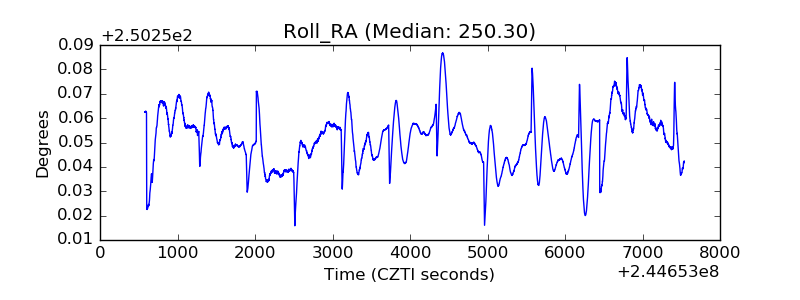 |
| Veto Counter | 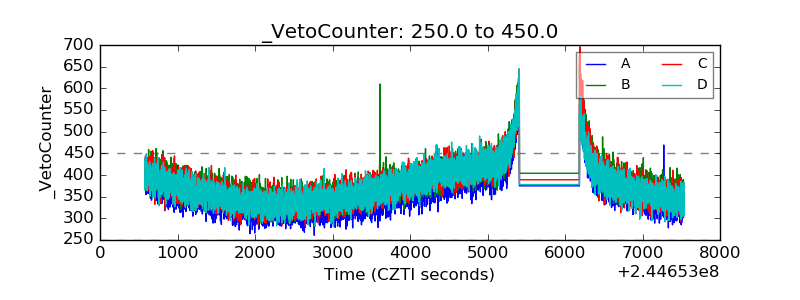 |