| Param | Original file | Final file |
|---|---|---|
| Filename | modeM0/AS1A04_055T01_9000001574_10888cztM0_level2.evt | modeM0/AS1A04_055T01_9000001574_10888cztM0_level2_quad_clean.evt |
| Size (bytes) | 612,587,520 | 101,384,640 |
| Size | 584.2 MB | 96.7 MB |
| Events in quadrant A | 4,218,029 | 657,087 |
| Events in quadrant B | 6,316,732 | 602,729 |
| Events in quadrant C | 3,084,962 | 681,243 |
| Events in quadrant D | 4,449,104 | 632,045 |
| Mode M0 | |||
|---|---|---|---|
| Quadrant | BADHDUFLAG | Total packets | Discarded packets |
| A | 0 | 17304 | 2 |
| B | 0 | 23649 | 1 |
| C | 0 | 14479 | 1 |
| D | 0 | 18164 | 1 |
| Mode M9 | |||
|---|---|---|---|
| Quadrant | BADHDUFLAG | Total packets | Discarded packets |
| A | 0 | 3 | 0 |
| B | 0 | 3 | 0 |
| C | 0 | 3 | 0 |
| D | 0 | 3 | 0 |
| Mode SS | |||
|---|---|---|---|
| Quadrant | BADHDUFLAG | Total packets | Discarded packets |
| A | 0 | 146 | 0 |
| B | 0 | 146 | 0 |
| C | 0 | 146 | 0 |
| D | 0 | 146 | 0 |
| Quadrant | Total seconds | Saturated seconds | Saturation percentage |
|---|---|---|---|
| A | 7126 | 188 | 2.638226% |
| B | 7126 | 1158 | 16.250351% |
| C | 7126 | 18 | 0.252596% |
| D | 7126 | 232 | 3.255683% |
Noise dominated data is calculated using 1-second bins in cleaned event files. If a bin has >2000 counts, and if more than 50% of those come from <1% of pixels, then it is considered to be noise-dominated and hence unusable.
| Quadrant | # 1 sec bins | Bins with >0 counts | Bins with >2000 counts | High rate bins dominated by noise | Noise dominated (total time) | Noise dominated (detector-on time) | Marked lightcurve |
|---|---|---|---|---|---|---|---|
| A | 7496 | 7127 | 101 | 101 | 1.35% | 1.42% |  |
| B | 7496 | 7127 | 838 | 838 | 11.18% | 11.76% |  |
| C | 7496 | 7127 | 5 | 5 | 0.07% | 0.07% | 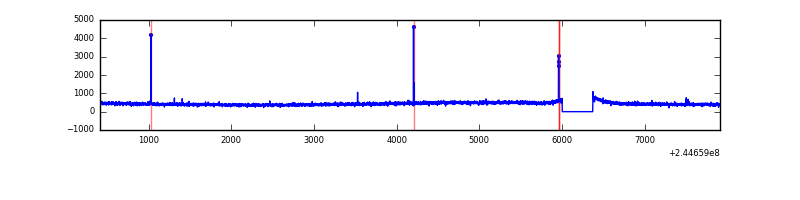 |
| D | 7496 | 7127 | 207 | 207 | 2.76% | 2.90% |  |
Top three noisy pixels from each quadrant. If the there are fewer than three noisy pixels in the level2.evt file, extra rows are filled as -1
| Pixel properties | Quadrant properties | ||||||
|---|---|---|---|---|---|---|---|
| Quadrant | DetID | PixID | Counts | Sigma | Mean | Median | Sigma |
| A | 8 | 5 | 911461 | 5508.1 | 806 | 789 | 165.3 |
| A | 5 | 16 | 159017 | 957.02 | 806 | 789 | 165.3 |
| A | 8 | 15 | 14792 | 84.7 | 806 | 789 | 165.3 |
| B | 4 | 239 | 2957982 | 20627.98 | 754 | 735 | 143.4 |
| B | 0 | 182 | 264020 | 1836.52 | 754 | 735 | 143.4 |
| B | 0 | 219 | 37142 | 253.95 | 754 | 735 | 143.4 |
| C | 0 | 207 | 15567 | 81.61 | 782 | 783 | 181.2 |
| C | 14 | 234 | 11831 | 60.99 | 782 | 783 | 181.2 |
| C | 13 | 61 | 6012 | 28.86 | 782 | 783 | 181.2 |
| D | 10 | 199 | 429650 | 2243.43 | 775 | 749 | 191.2 |
| D | 13 | 249 | 304393 | 1588.25 | 775 | 749 | 191.2 |
| D | 5 | 97 | 246875 | 1287.4 | 775 | 749 | 191.2 |
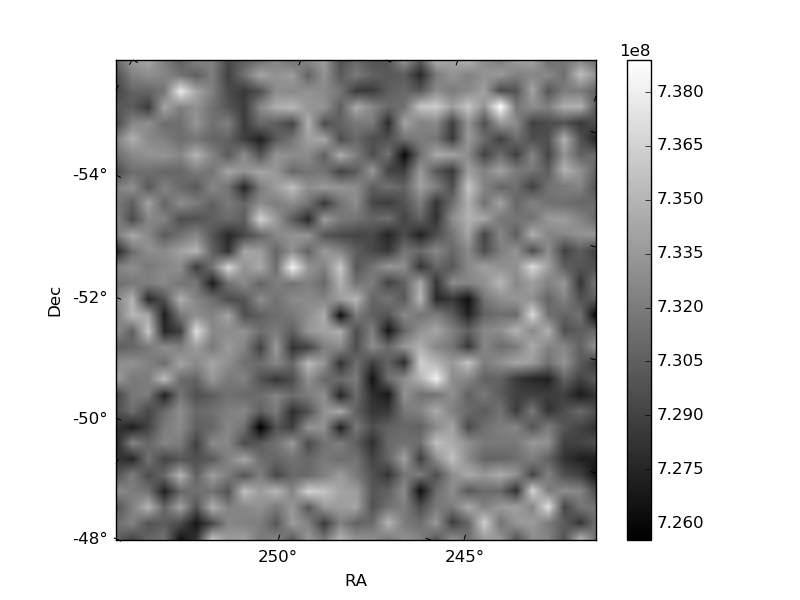
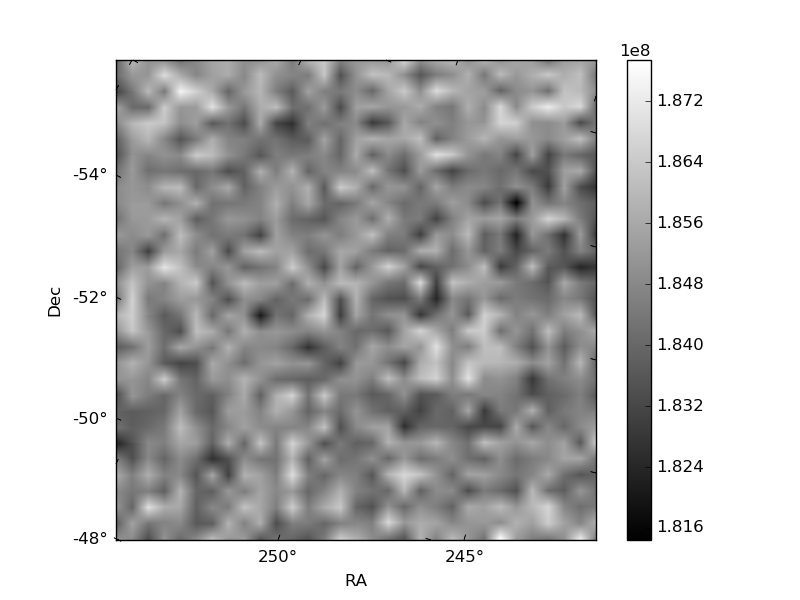
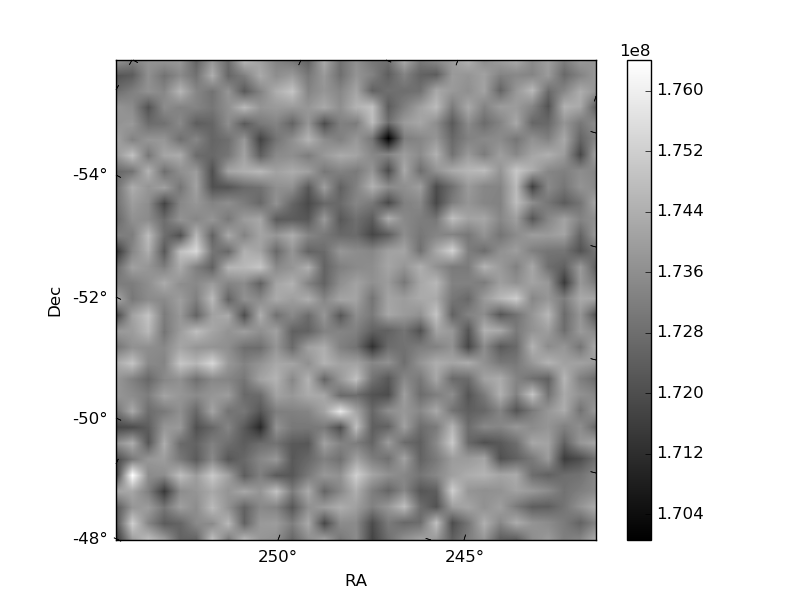
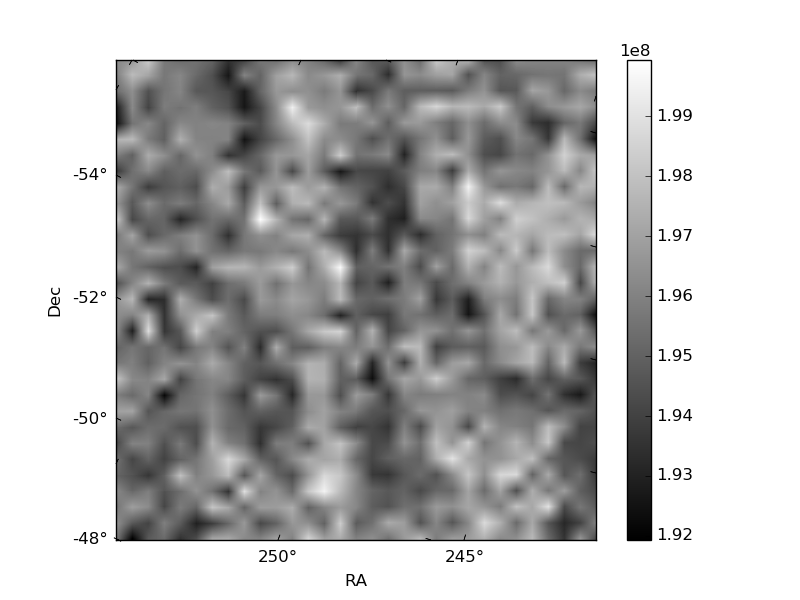
Histogram calculated using DETX and DETY for each event in the final _common_clean file
| Quadrant A | 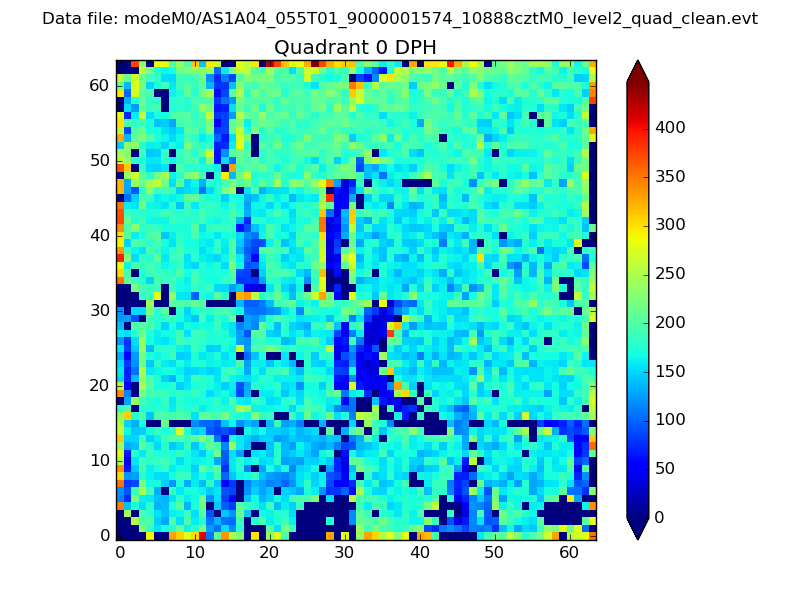 |
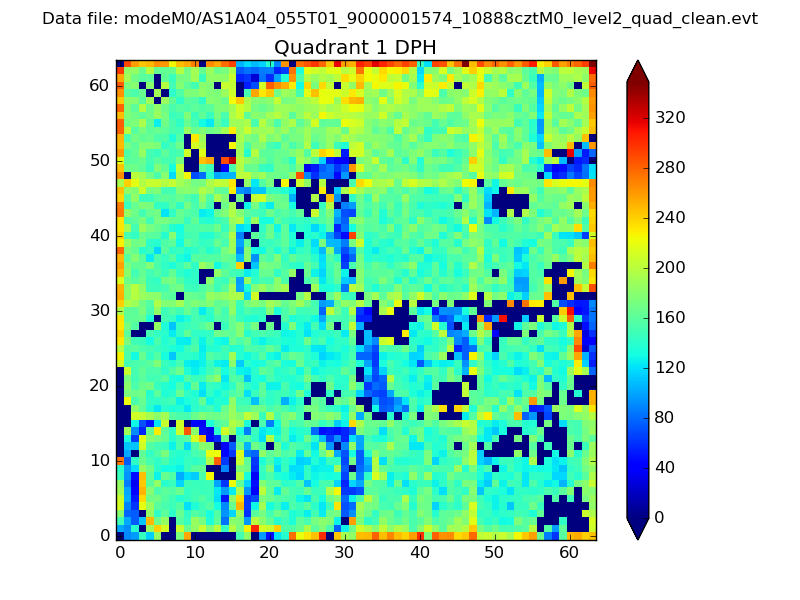 |
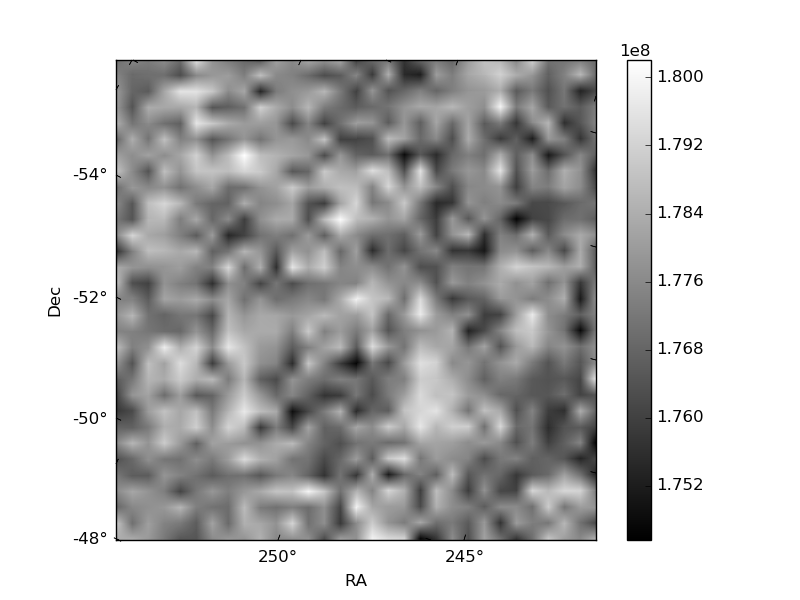
Quadrant B |
|---|---|---|---|
| Quadrant D |  |
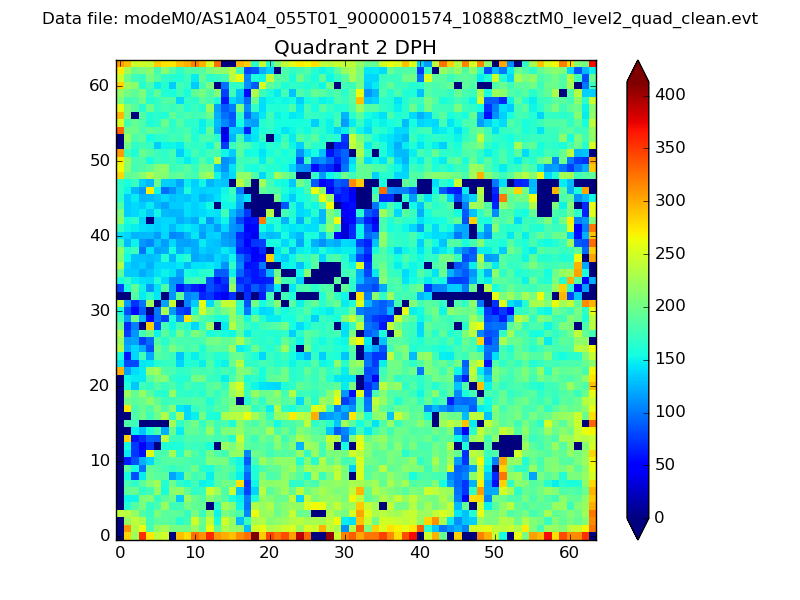 |
Quadrant C |
| Plot type | Count rate plots | Images |
|---|---|---|
| Comparison with Poisson distribution Blue bars denote a histogram of data divided into 1 sec bins. Red curve is a Poisson curve with rate = median count rate of data. |
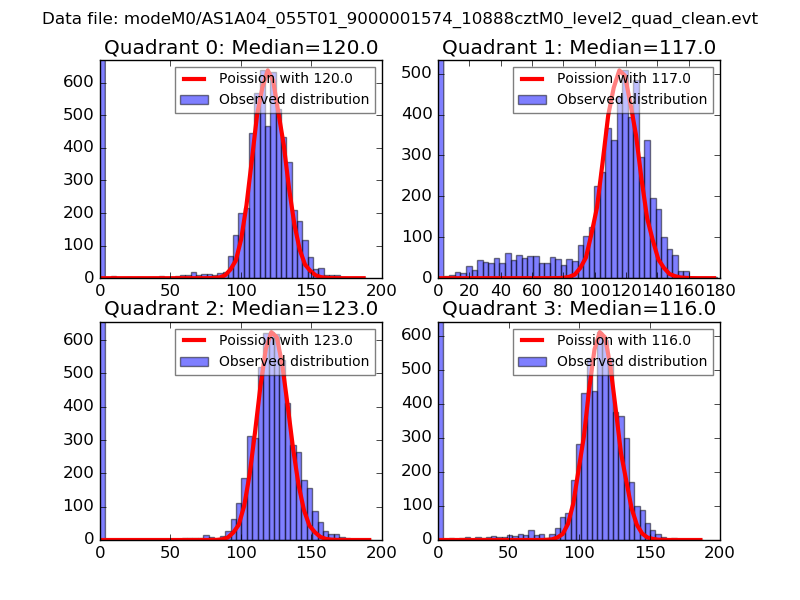 |
 |
| Quadrant-wise count rates Data is divided into 100 sec bins |
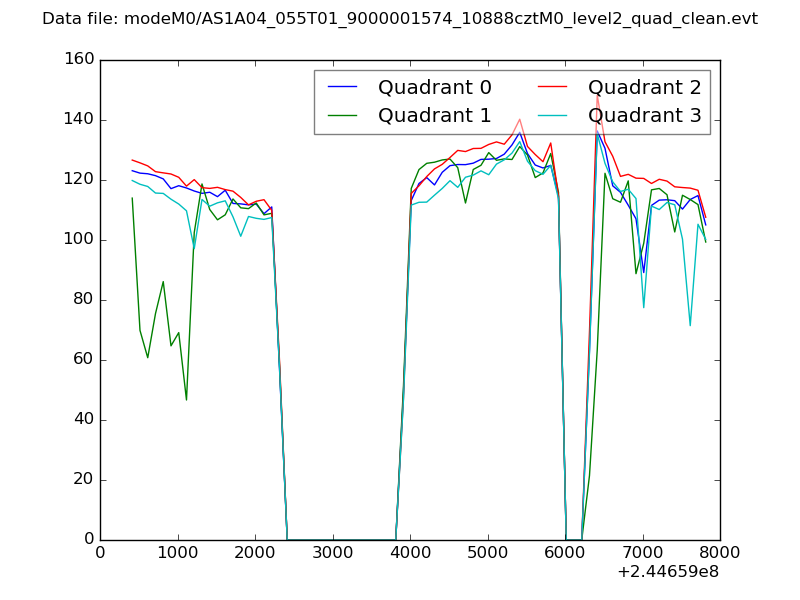 |
|
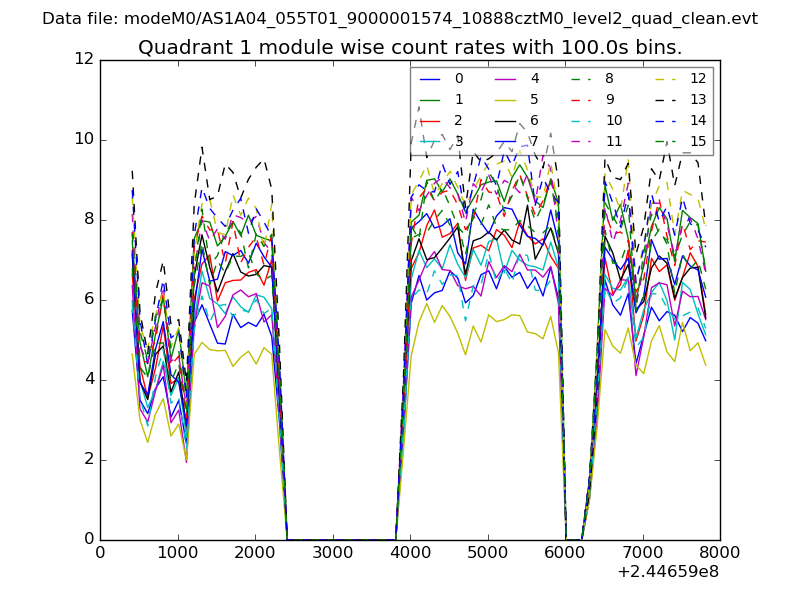
| Module-wise count rates for Quadrant A Data is divided into 100 sec bins |
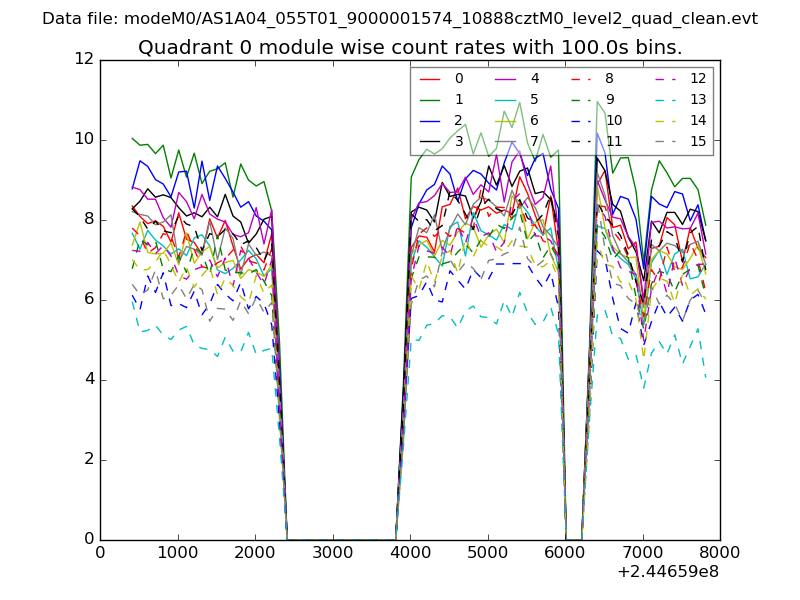 |
 |
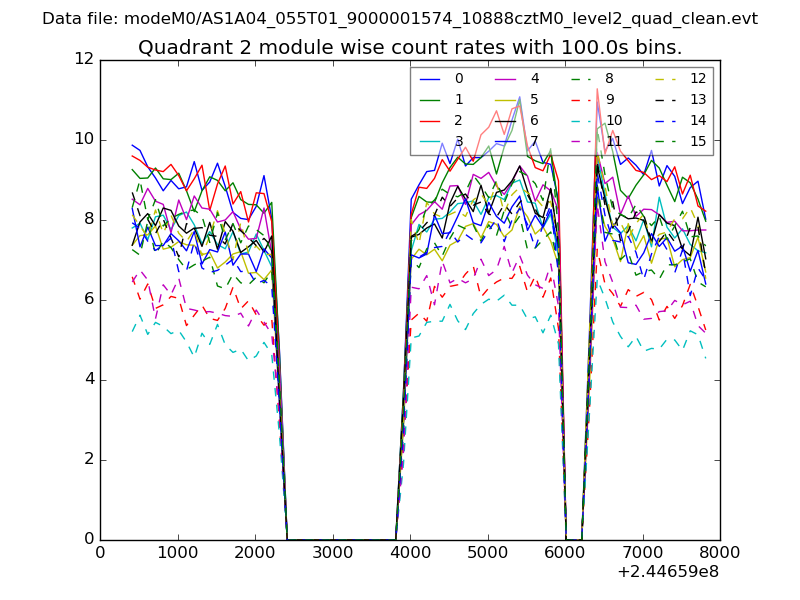
| Module-wise count rates for Quadrant B Data is divided into 100 sec bins |
 |
 |
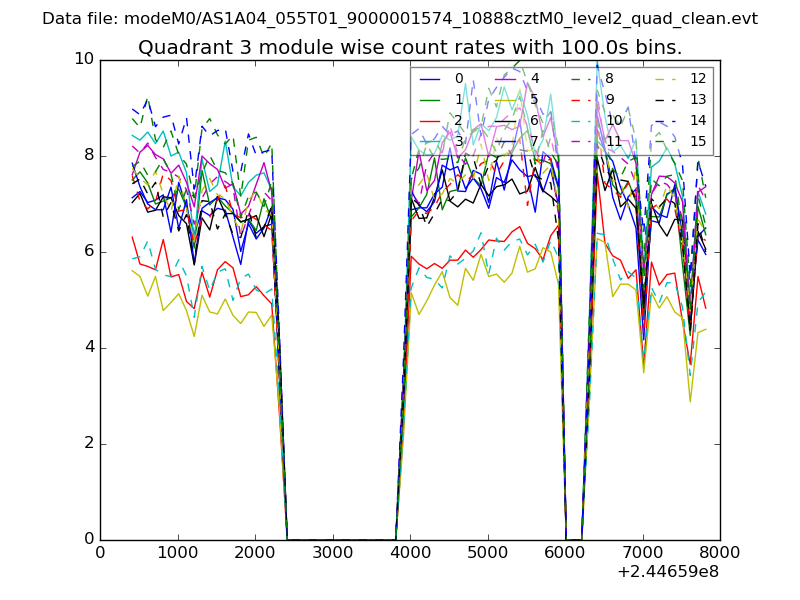
| Module-wise count rates for Quadrant C Data is divided into 100 sec bins |
 |
 |
| Module-wise count rates for Quadrant D Data is divided into 100 sec bins |
 |
 |
| Parameter | Plot |
|---|---|
| CZT HV Monitor | 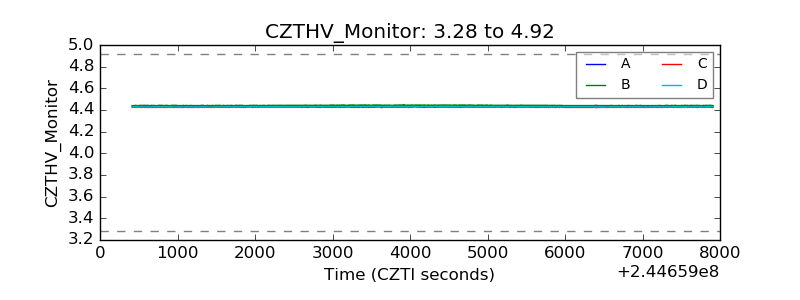 |
| D_VDD | 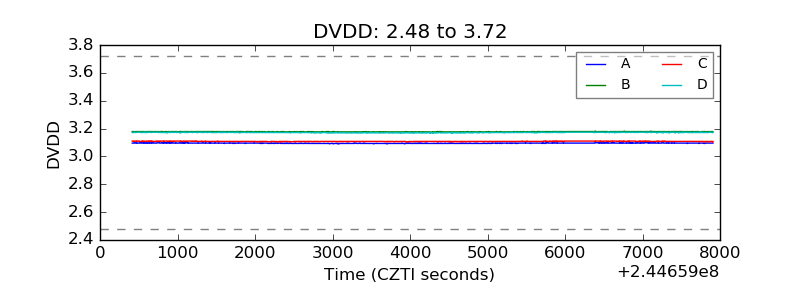 |
| Temperature 1 | 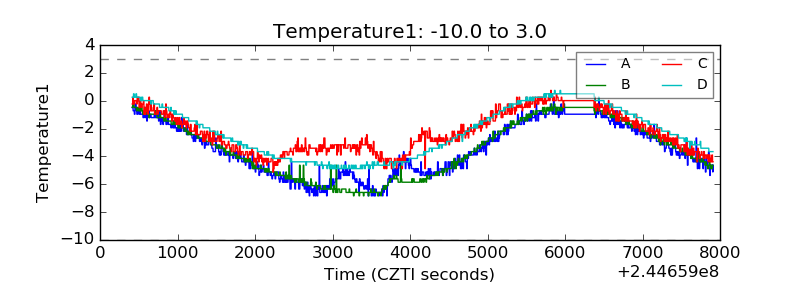 |
| Veto HV Monitor |  |
| Veto LLD | 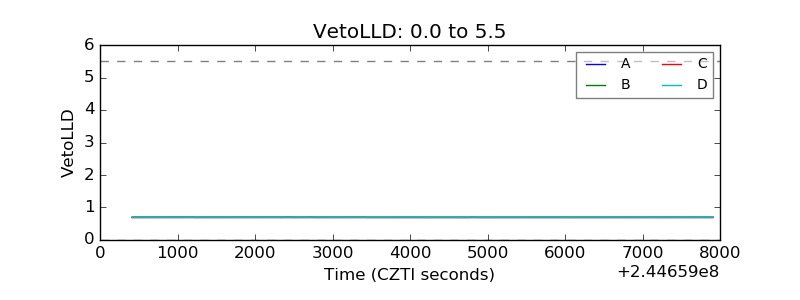 |
| Alpha Counter | 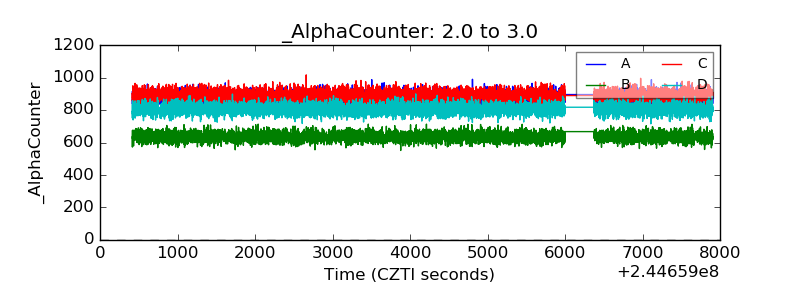 |
| _CPM_Rate | 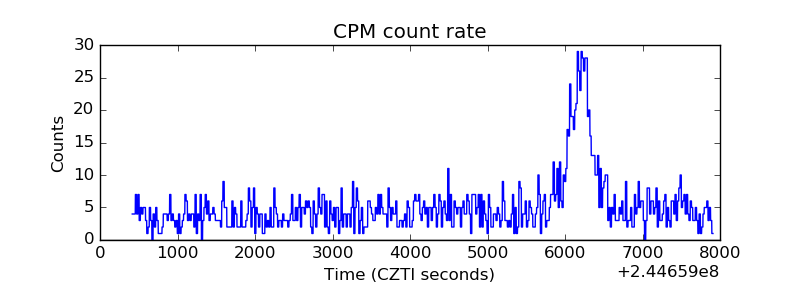 |
| CZT Counter | 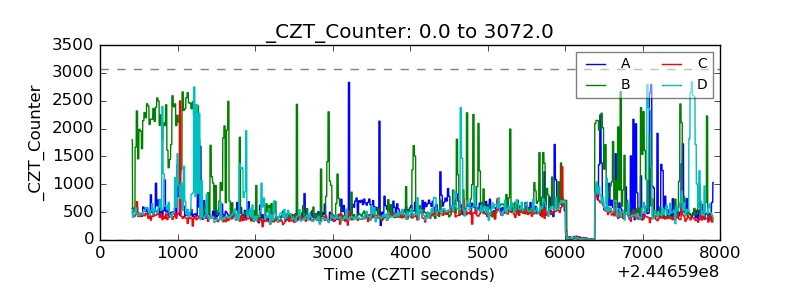 |
| +2.5 Volts monitor | 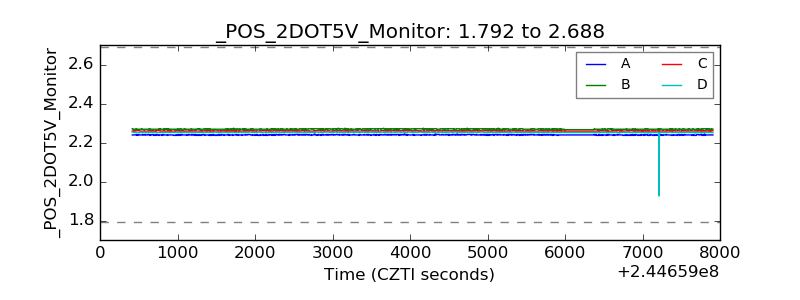 |
| +5 Volts monitor |  |
| _ROLL_ROT | 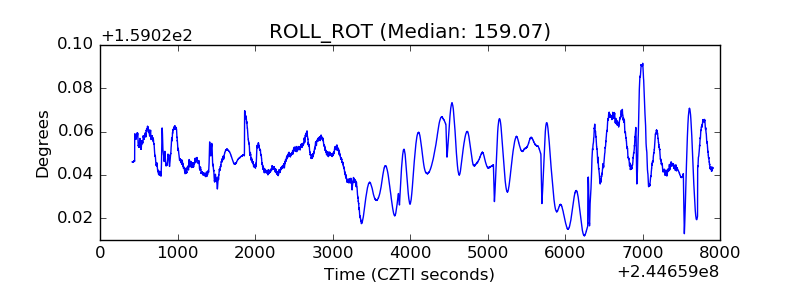 |
| _Roll_DEC | 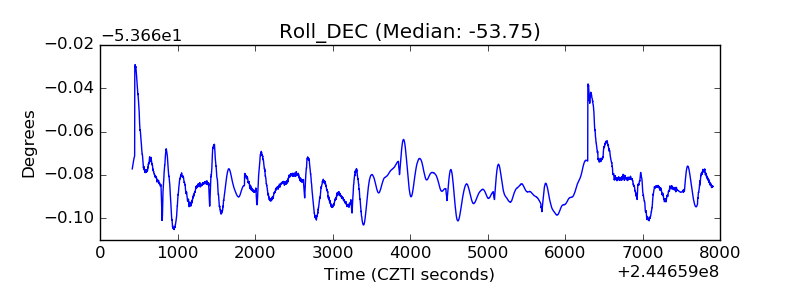 |
| _Roll_RA | 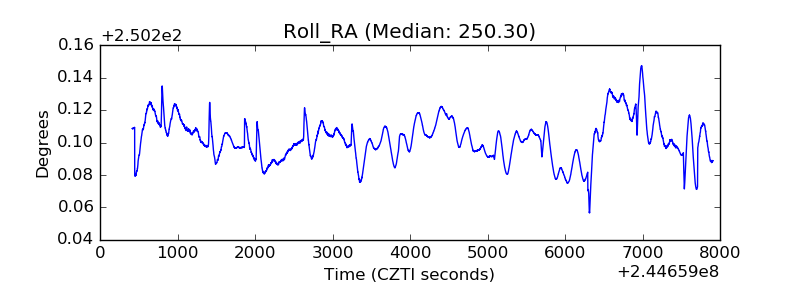 |
| Veto Counter | 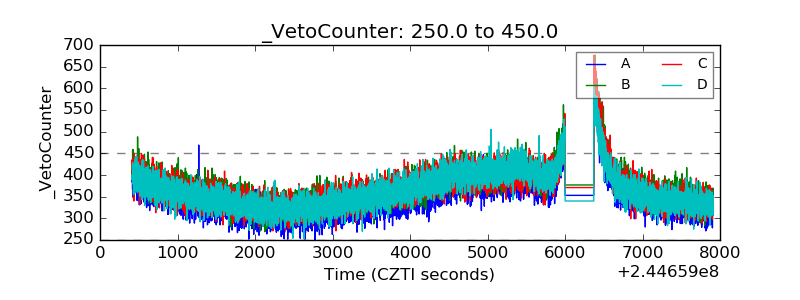 |