| Param | Original file | Final file |
|---|---|---|
| Filename | modeM0/AS1A04_055T01_9000001574_10889cztM0_level2.evt | modeM0/AS1A04_055T01_9000001574_10889cztM0_level2_quad_clean.evt |
| Size (bytes) | 621,204,480 | 108,426,240 |
| Size | 592.4 MB | 103.4 MB |
| Events in quadrant A | 4,527,443 | 691,281 |
| Events in quadrant B | 5,297,534 | 678,477 |
| Events in quadrant C | 3,339,151 | 719,229 |
| Events in quadrant D | 5,131,508 | 662,942 |
| Mode M0 | |||
|---|---|---|---|
| Quadrant | BADHDUFLAG | Total packets | Discarded packets |
| A | 0 | 18554 | 3 |
| B | 0 | 20987 | 2 |
| C | 0 | 15606 | 2 |
| D | 0 | 20491 | 2 |
| Mode M9 | |||
|---|---|---|---|
| Quadrant | BADHDUFLAG | Total packets | Discarded packets |
| A | 0 | 4 | 0 |
| B | 0 | 4 | 0 |
| C | 0 | 4 | 0 |
| D | 0 | 4 | 0 |
| Mode SS | |||
|---|---|---|---|
| Quadrant | BADHDUFLAG | Total packets | Discarded packets |
| A | 0 | 156 | 0 |
| B | 0 | 156 | 0 |
| C | 0 | 156 | 0 |
| D | 0 | 156 | 0 |
| Quadrant | Total seconds | Saturated seconds | Saturation percentage |
|---|---|---|---|
| A | 7633 | 257 | 3.366959% |
| B | 7633 | 611 | 8.004716% |
| C | 7633 | 18 | 0.235818% |
| D | 7633 | 341 | 4.467444% |
Noise dominated data is calculated using 1-second bins in cleaned event files. If a bin has >2000 counts, and if more than 50% of those come from <1% of pixels, then it is considered to be noise-dominated and hence unusable.
| Quadrant | # 1 sec bins | Bins with >0 counts | Bins with >2000 counts | High rate bins dominated by noise | Noise dominated (total time) | Noise dominated (detector-on time) | Marked lightcurve |
|---|---|---|---|---|---|---|---|
| A | 7893 | 7635 | 124 | 124 | 1.57% | 1.62% | 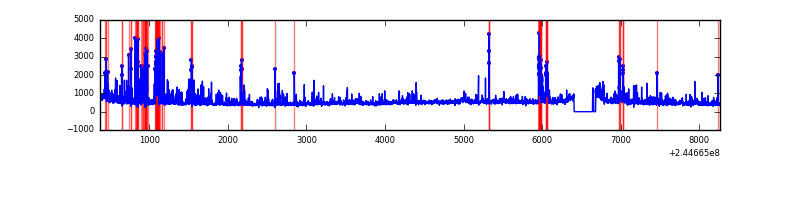 |
| B | 7893 | 7635 | 371 | 371 | 4.70% | 4.86% | 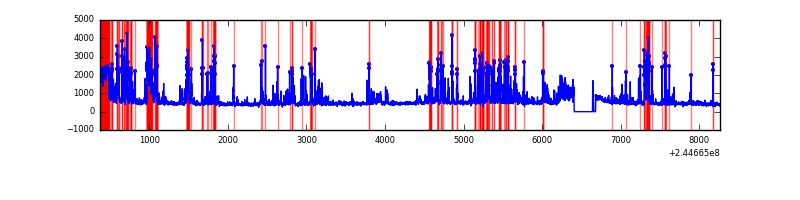 |
| C | 7893 | 7635 | 1 | 1 | 0.01% | 0.01% | 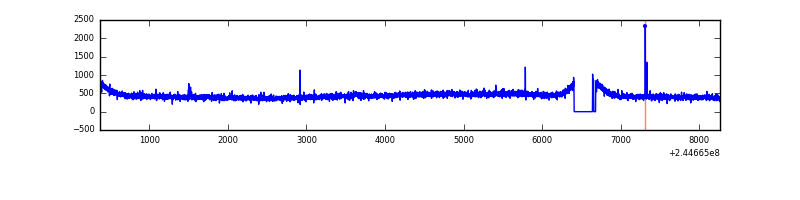 |
| D | 7893 | 7635 | 284 | 284 | 3.60% | 3.72% | 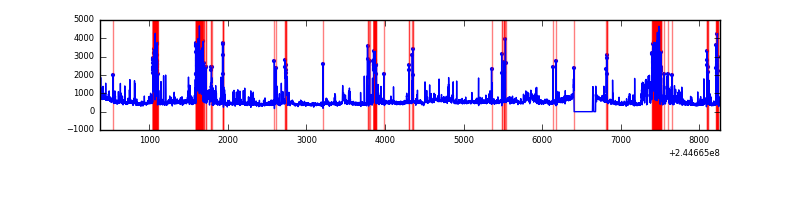 |
Top three noisy pixels from each quadrant. If the there are fewer than three noisy pixels in the level2.evt file, extra rows are filled as -1
| Pixel properties | Quadrant properties | ||||||
|---|---|---|---|---|---|---|---|
| Quadrant | DetID | PixID | Counts | Sigma | Mean | Median | Sigma |
| A | 8 | 5 | 960483 | 5352.89 | 870 | 850 | 179.3 |
| A | 5 | 16 | 173505 | 963.08 | 870 | 850 | 179.3 |
| A | 1 | 162 | 13457 | 70.32 | 870 | 850 | 179.3 |
| B | 4 | 239 | 1815011 | 11102.04 | 852 | 832 | 163.4 |
| B | 0 | 182 | 82572 | 500.22 | 852 | 832 | 163.4 |
| B | 0 | 214 | 22333 | 131.58 | 852 | 832 | 163.4 |
| C | 14 | 234 | 10376 | 48.2 | 849 | 851 | 197.6 |
| C | 13 | 61 | 6371 | 27.94 | 849 | 851 | 197.6 |
| C | 4 | 222 | 5373 | 22.88 | 849 | 851 | 197.6 |
| D | 10 | 199 | 707186 | 3493.9 | 832 | 805 | 202.2 |
| D | 5 | 97 | 362723 | 1790.12 | 832 | 805 | 202.2 |
| D | 8 | 195 | 324925 | 1603.16 | 832 | 805 | 202.2 |
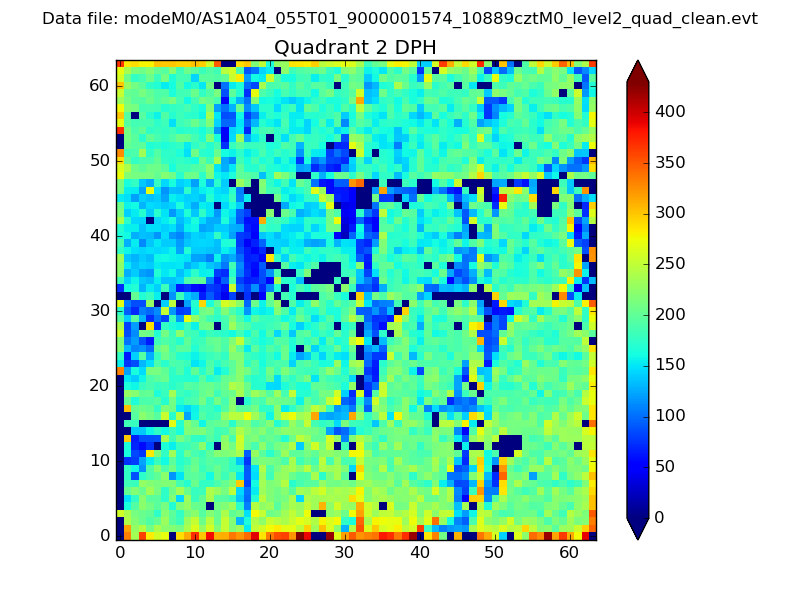
Histogram calculated using DETX and DETY for each event in the final _common_clean file
| Quadrant A | 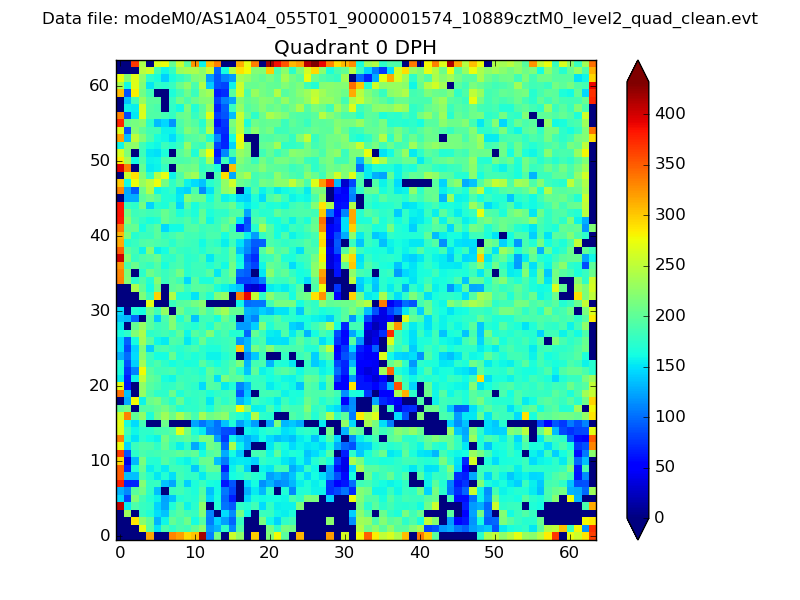 |
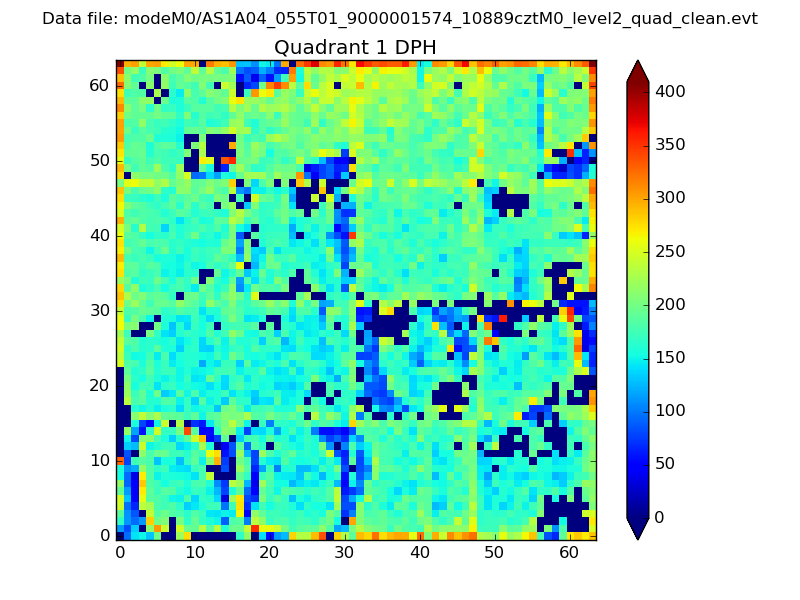 |
Quadrant B |
|---|---|---|---|
| Quadrant D | 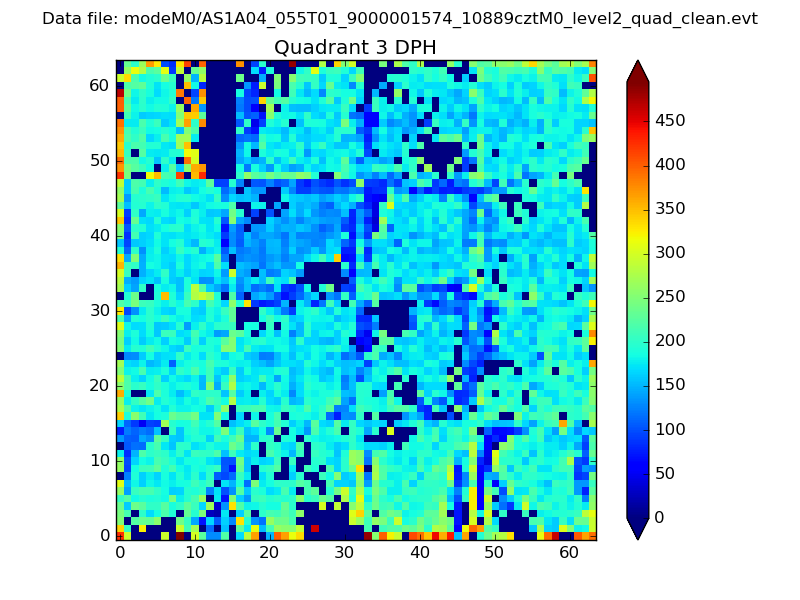 |
 |
Quadrant C |
| Plot type | Count rate plots | Images |
|---|---|---|
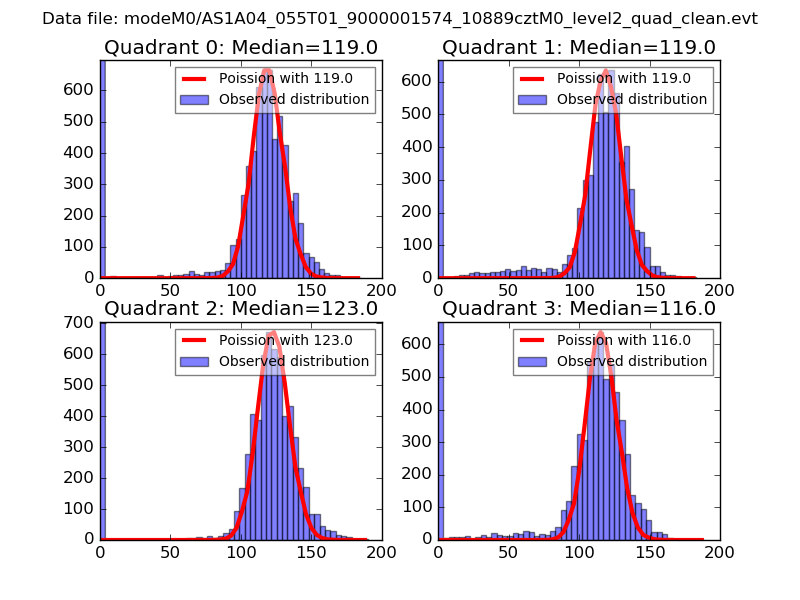
| Comparison with Poisson distribution Blue bars denote a histogram of data divided into 1 sec bins. Red curve is a Poisson curve with rate = median count rate of data. |
 |
 |
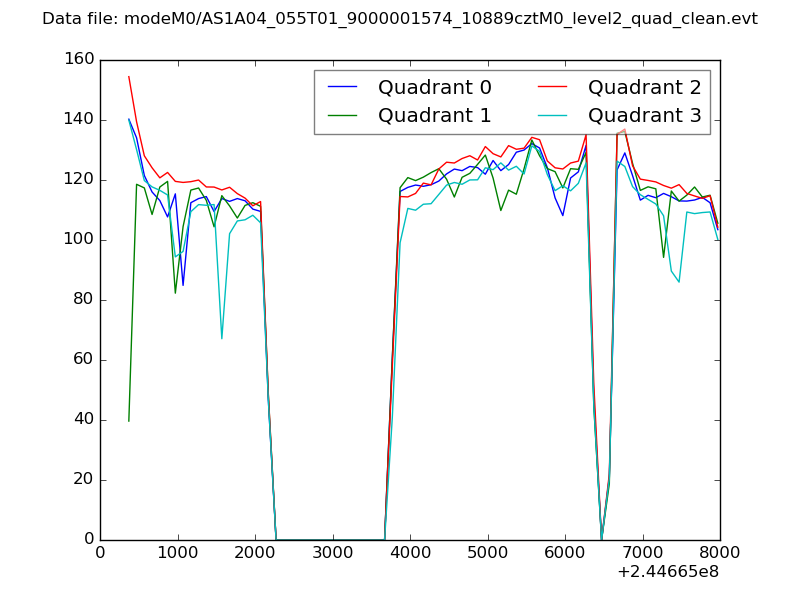
| Quadrant-wise count rates Data is divided into 100 sec bins |
 |
|
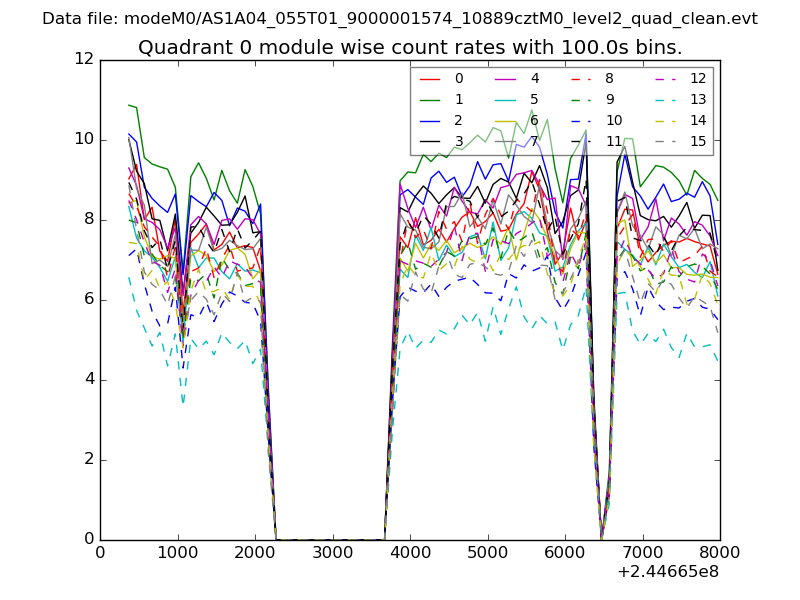
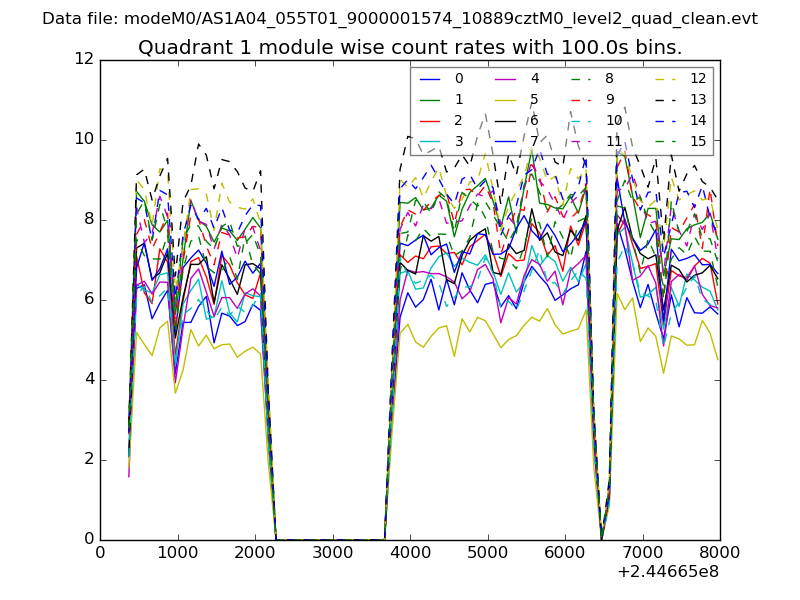
| Module-wise count rates for Quadrant A Data is divided into 100 sec bins |
 |
 |
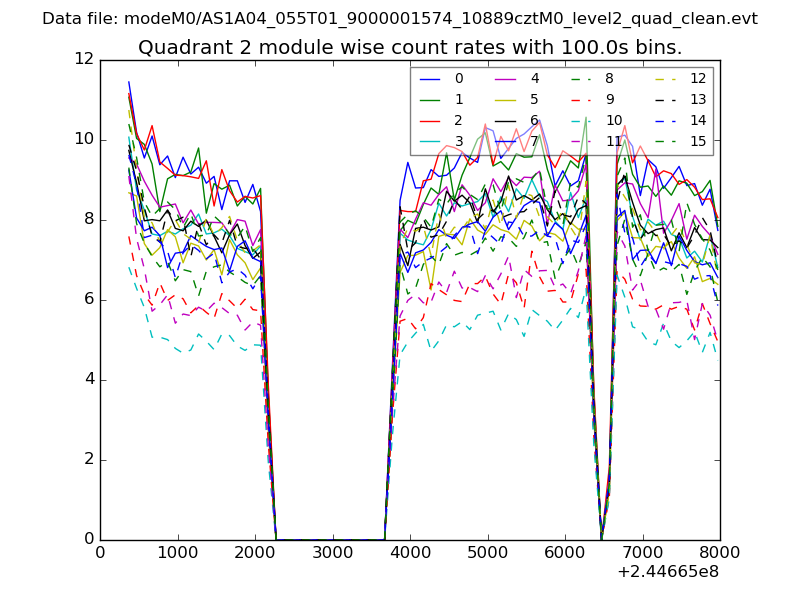
| Module-wise count rates for Quadrant B Data is divided into 100 sec bins |
 |
 |
| Module-wise count rates for Quadrant C Data is divided into 100 sec bins |
 |
 |
| Module-wise count rates for Quadrant D Data is divided into 100 sec bins |
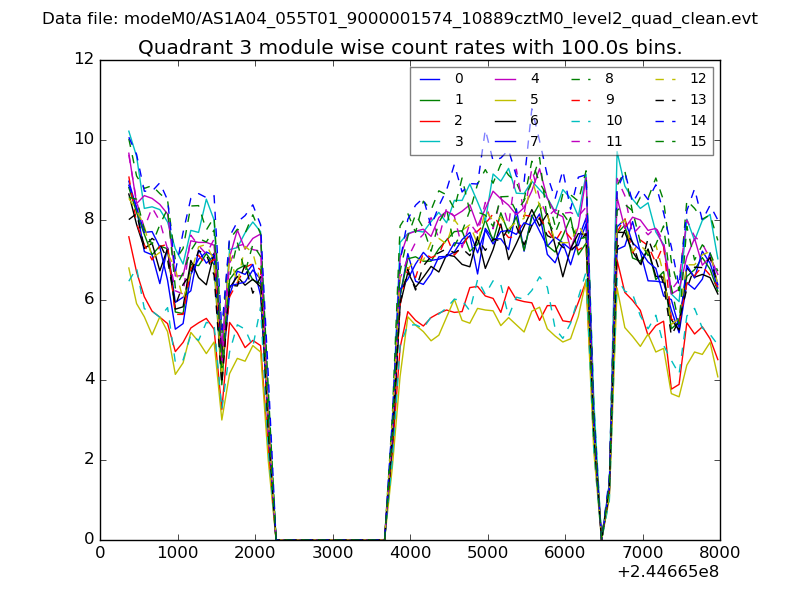 |
 |
| Parameter | Plot |
|---|---|
| CZT HV Monitor | 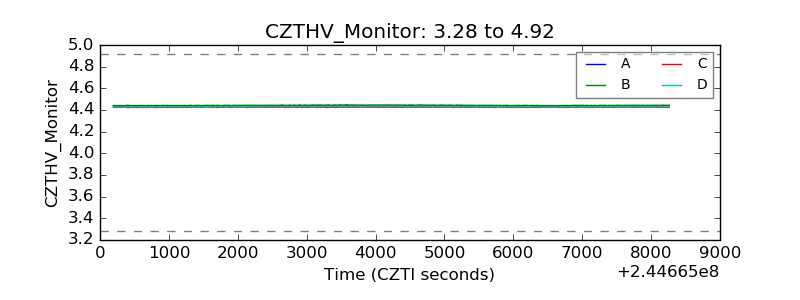 |
| D_VDD | 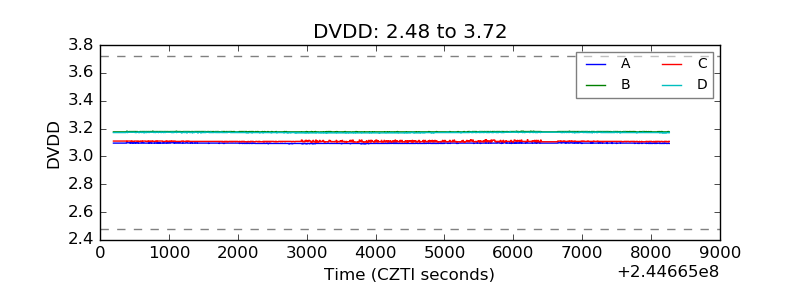 |
| Temperature 1 | 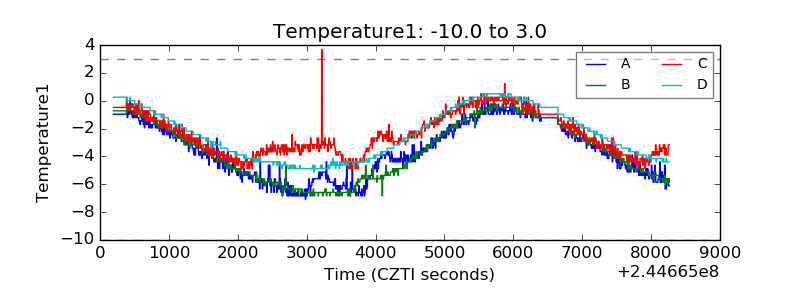 |
| Veto HV Monitor | 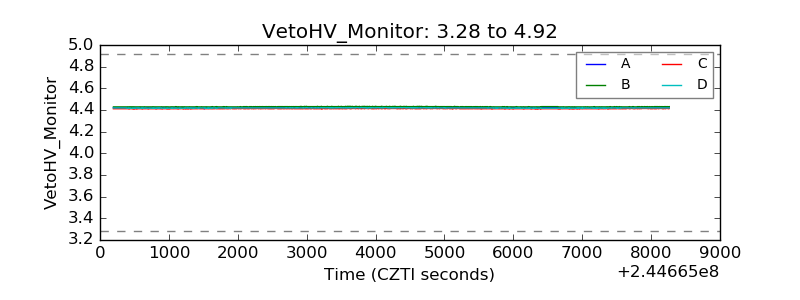 |
| Veto LLD | 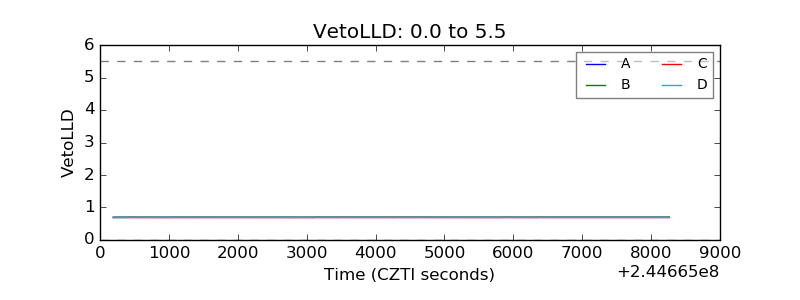 |
| Alpha Counter | 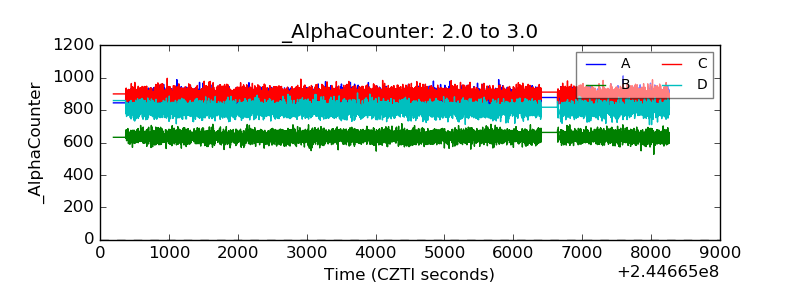 |
| _CPM_Rate | 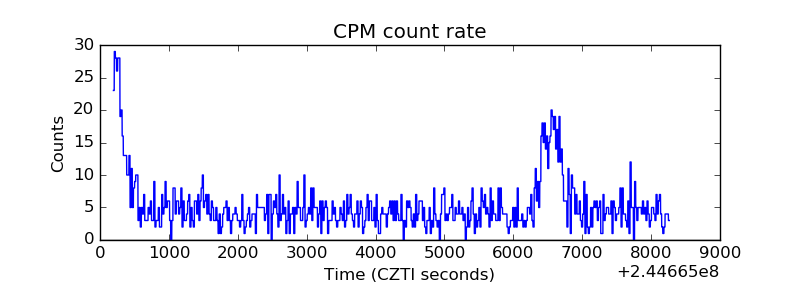 |
| CZT Counter | 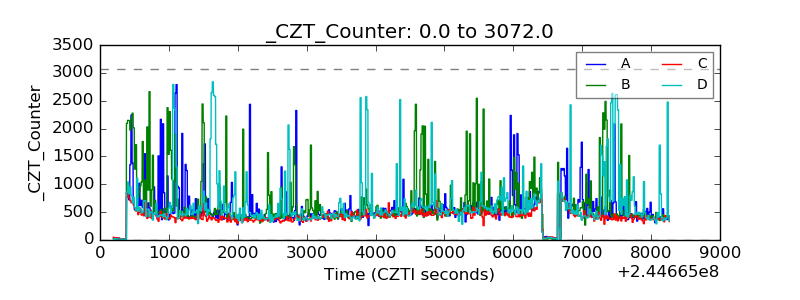 |
| +2.5 Volts monitor |  |
| +5 Volts monitor |  |
| _ROLL_ROT | 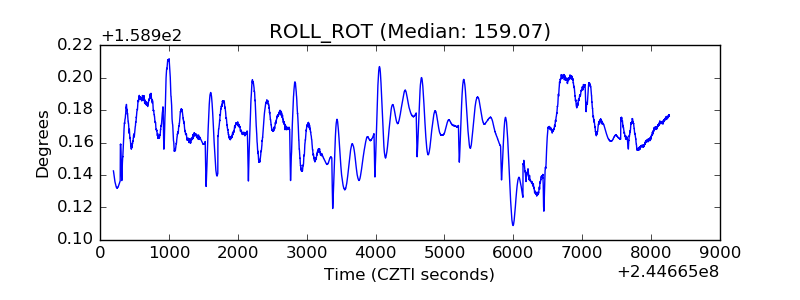 |
| _Roll_DEC | 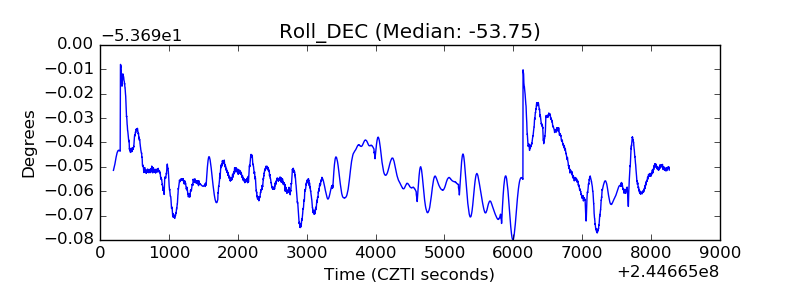 |
| _Roll_RA |  |
| Veto Counter | 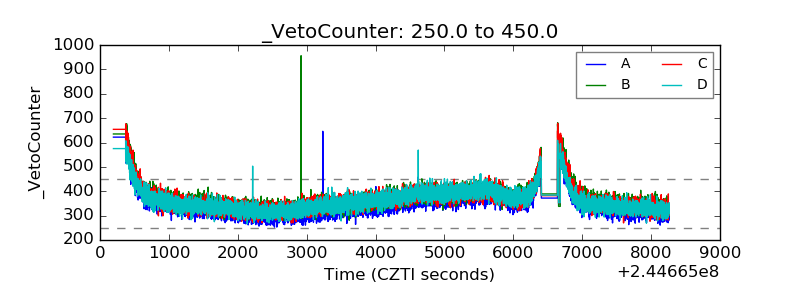 |