| Param | Original file | Final file |
|---|---|---|
| Filename | modeM0/AS1A04_055T01_9000001574_10890cztM0_level2.evt | modeM0/AS1A04_055T01_9000001574_10890cztM0_level2_quad_clean.evt |
| Size (bytes) | 587,632,320 | 101,027,520 |
| Size | 560.4 MB | 96.3 MB |
| Events in quadrant A | 4,450,176 | 630,843 |
| Events in quadrant B | 4,737,691 | 634,840 |
| Events in quadrant C | 3,325,586 | 653,215 |
| Events in quadrant D | 4,766,041 | 609,894 |
| Mode M0 | |||
|---|---|---|---|
| Quadrant | BADHDUFLAG | Total packets | Discarded packets |
| A | 0 | 18298 | 3 |
| B | 0 | 19221 | 2 |
| C | 0 | 15617 | 2 |
| D | 0 | 19566 | 2 |
| Mode M9 | |||
|---|---|---|---|
| Quadrant | BADHDUFLAG | Total packets | Discarded packets |
| A | 0 | 6 | 0 |
| B | 0 | 6 | 0 |
| C | 0 | 6 | 0 |
| D | 0 | 6 | 0 |
| Mode SS | |||
|---|---|---|---|
| Quadrant | BADHDUFLAG | Total packets | Discarded packets |
| A | 0 | 158 | 0 |
| B | 0 | 158 | 0 |
| C | 0 | 158 | 0 |
| D | 0 | 158 | 0 |
| Quadrant | Total seconds | Saturated seconds | Saturation percentage |
|---|---|---|---|
| A | 7620 | 221 | 2.900262% |
| B | 7620 | 409 | 5.367454% |
| C | 7620 | 23 | 0.301837% |
| D | 7620 | 258 | 3.385827% |
Noise dominated data is calculated using 1-second bins in cleaned event files. If a bin has >2000 counts, and if more than 50% of those come from <1% of pixels, then it is considered to be noise-dominated and hence unusable.
| Quadrant | # 1 sec bins | Bins with >0 counts | Bins with >2000 counts | High rate bins dominated by noise | Noise dominated (total time) | Noise dominated (detector-on time) | Marked lightcurve |
|---|---|---|---|---|---|---|---|
| A | 8256 | 7623 | 82 | 82 | 0.99% | 1.08% | 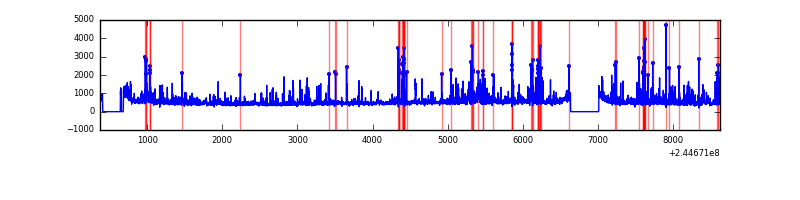 |
| B | 8256 | 7623 | 203 | 203 | 2.46% | 2.66% | 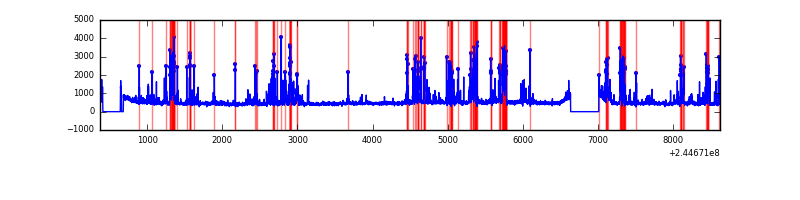 |
| C | 8256 | 7623 | 1 | 1 | 0.01% | 0.01% | 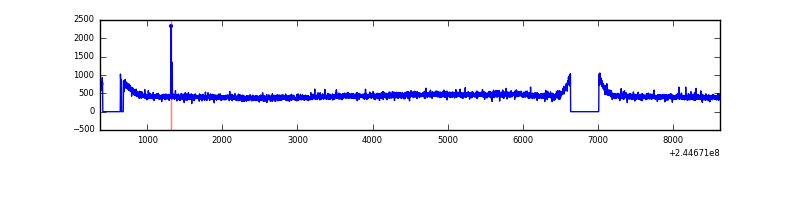 |
| D | 8256 | 7623 | 175 | 175 | 2.12% | 2.30% | 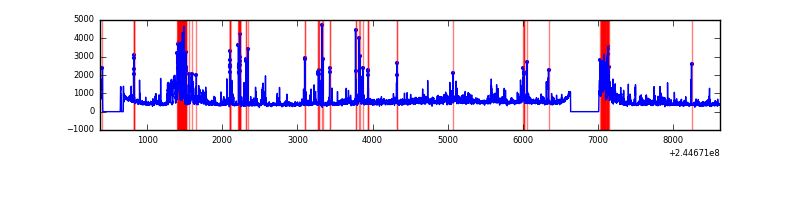 |
Top three noisy pixels from each quadrant. If the there are fewer than three noisy pixels in the level2.evt file, extra rows are filled as -1
| Pixel properties | Quadrant properties | ||||||
|---|---|---|---|---|---|---|---|
| Quadrant | DetID | PixID | Counts | Sigma | Mean | Median | Sigma |
| A | 8 | 5 | 1036626 | 5753.05 | 870 | 849 | 180.0 |
| A | 11 | 29 | 24218 | 129.8 | 870 | 849 | 180.0 |
| A | 5 | 16 | 11050 | 56.66 | 870 | 849 | 180.0 |
| B | 4 | 239 | 1240876 | 7455.24 | 869 | 848 | 166.3 |
| B | 0 | 214 | 36248 | 212.83 | 869 | 848 | 166.3 |
| B | 0 | 219 | 21836 | 126.18 | 869 | 848 | 166.3 |
| C | 14 | 234 | 7595 | 33.88 | 849 | 851 | 199.0 |
| C | 13 | 61 | 6494 | 28.35 | 849 | 851 | 199.0 |
| C | 8 | 128 | 3437 | 12.99 | 849 | 851 | 199.0 |
| D | 10 | 199 | 677148 | 3325.21 | 836 | 812 | 203.4 |
| D | 1 | 52 | 362315 | 1777.33 | 836 | 812 | 203.4 |
| D | 5 | 222 | 133282 | 651.29 | 836 | 812 | 203.4 |
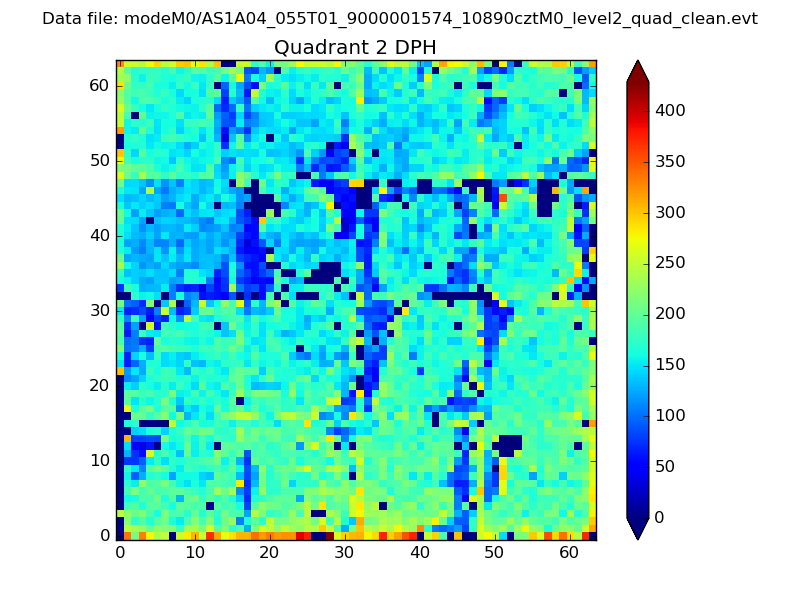
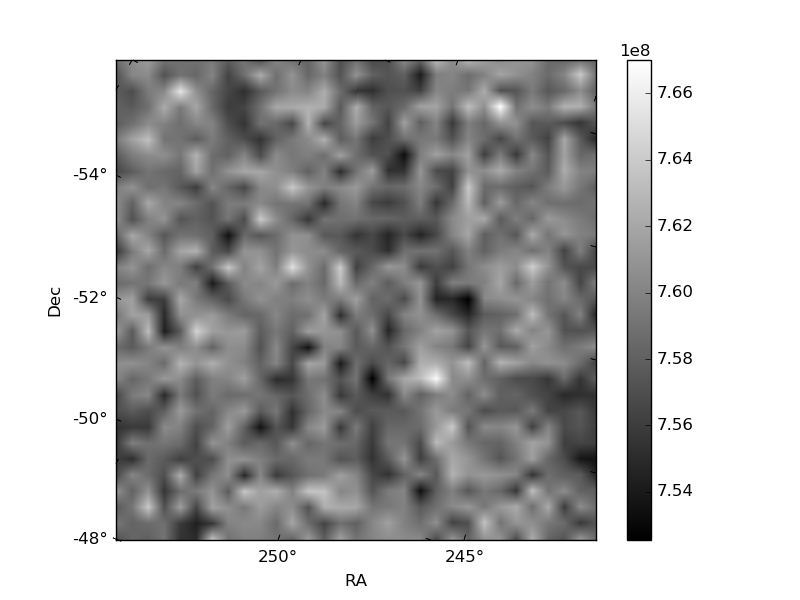
Histogram calculated using DETX and DETY for each event in the final _common_clean file
| Quadrant A | 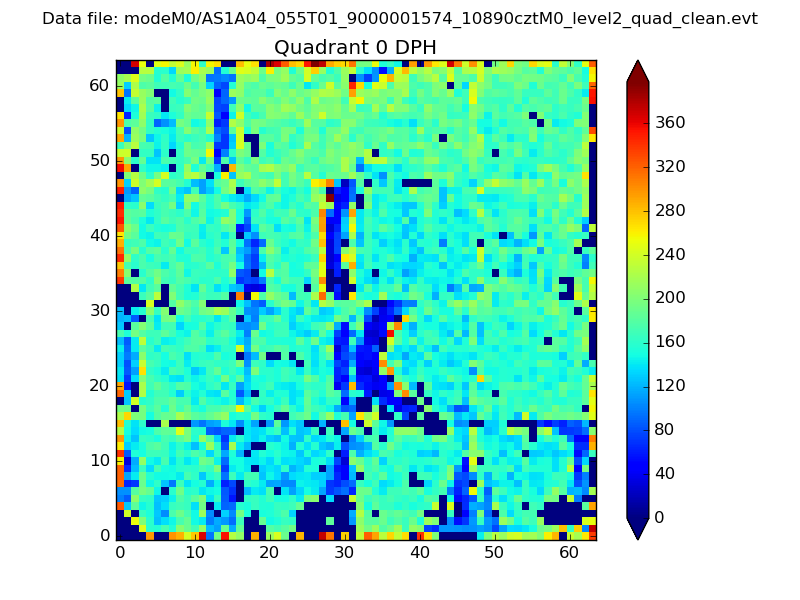 |
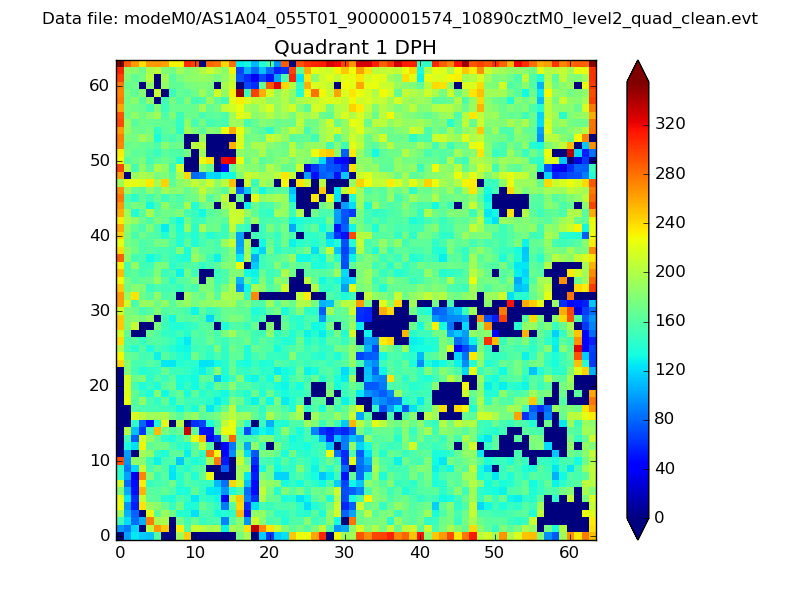 |
Quadrant B |
|---|---|---|---|
| Quadrant D | 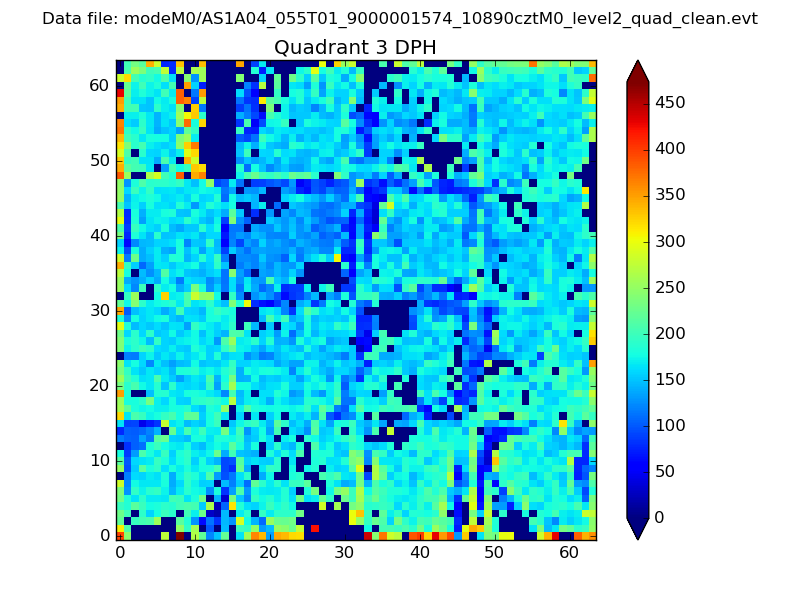 |
 |
Quadrant C |
| Plot type | Count rate plots | Images |
|---|---|---|
| Comparison with Poisson distribution Blue bars denote a histogram of data divided into 1 sec bins. Red curve is a Poisson curve with rate = median count rate of data. |
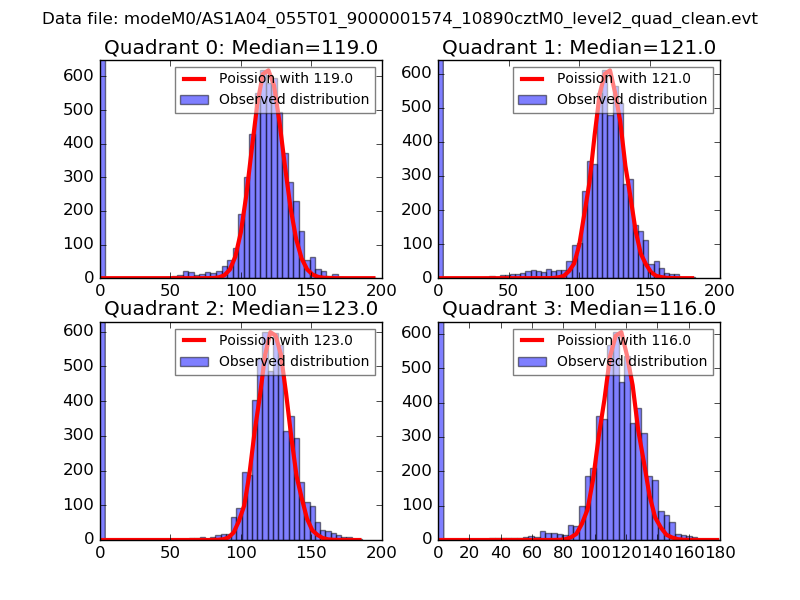 |
 |
| Quadrant-wise count rates Data is divided into 100 sec bins |
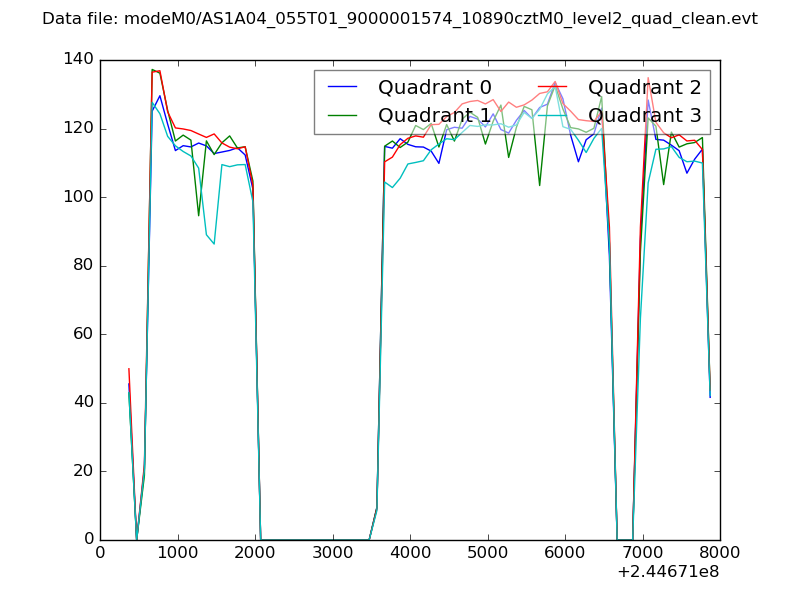 |
|
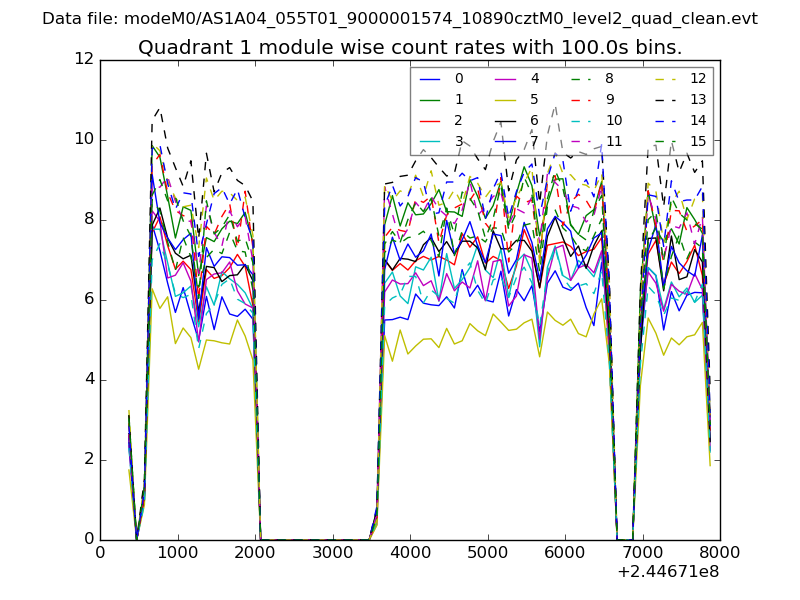
| Module-wise count rates for Quadrant A Data is divided into 100 sec bins |
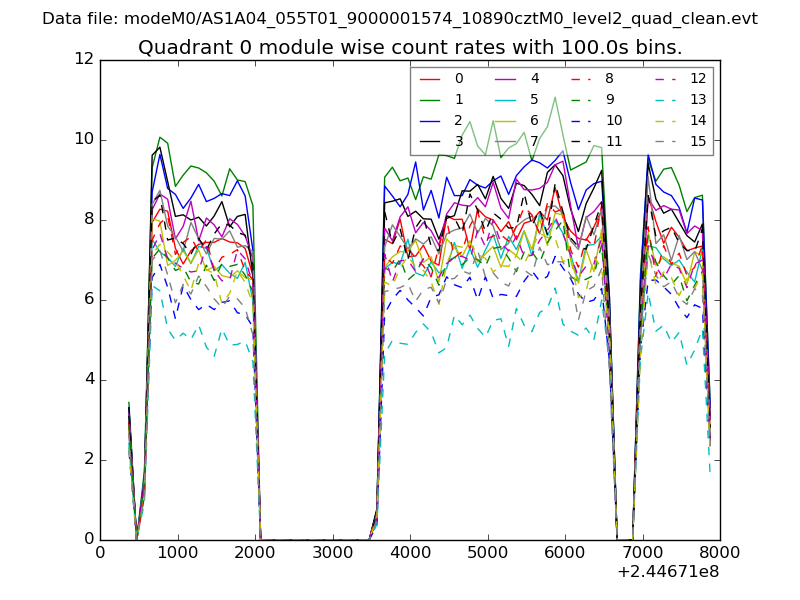 |
 |
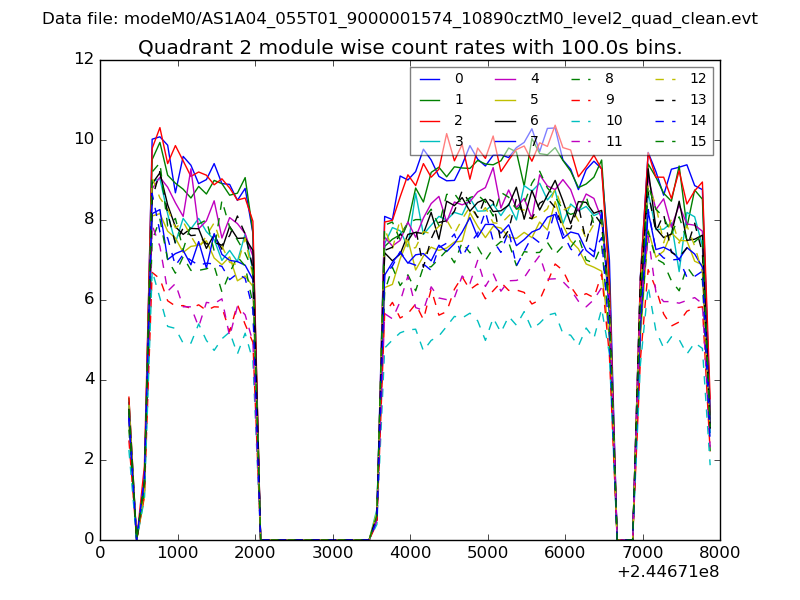
| Module-wise count rates for Quadrant B Data is divided into 100 sec bins |
 |
 |
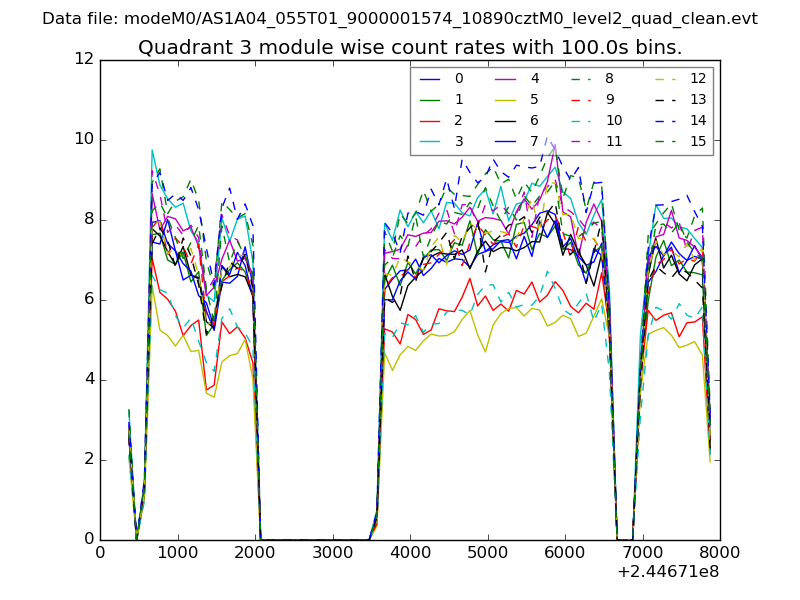
| Module-wise count rates for Quadrant C Data is divided into 100 sec bins |
 |
 |
| Module-wise count rates for Quadrant D Data is divided into 100 sec bins |
 |
 |
| Parameter | Plot |
|---|---|
| CZT HV Monitor | 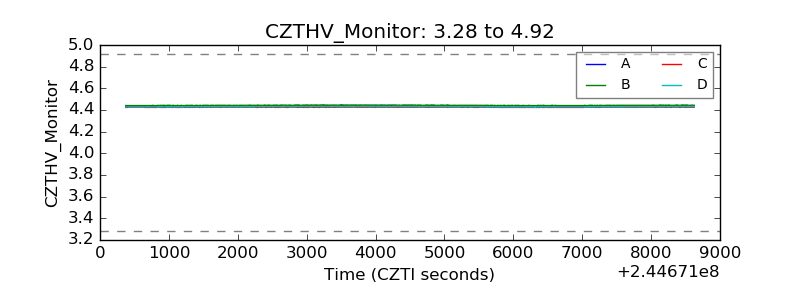 |
| D_VDD | 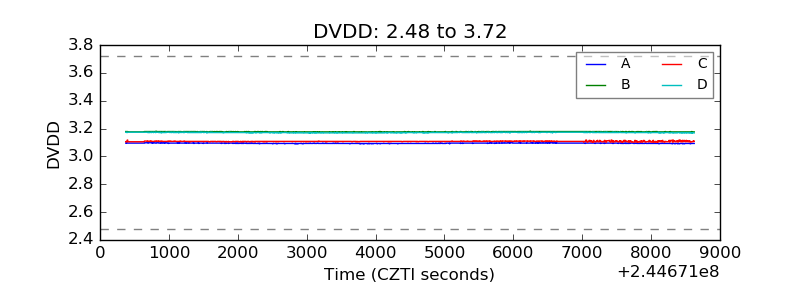 |
| Temperature 1 | 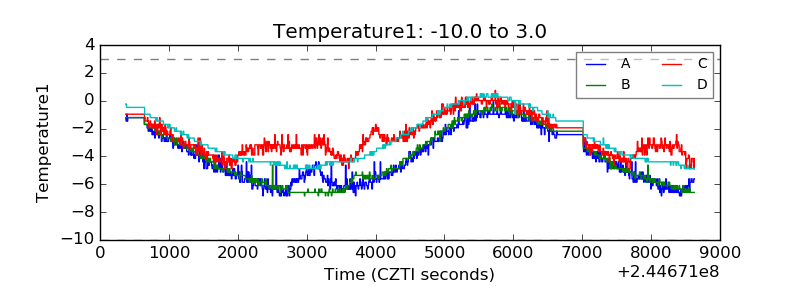 |
| Veto HV Monitor |  |
| Veto LLD | 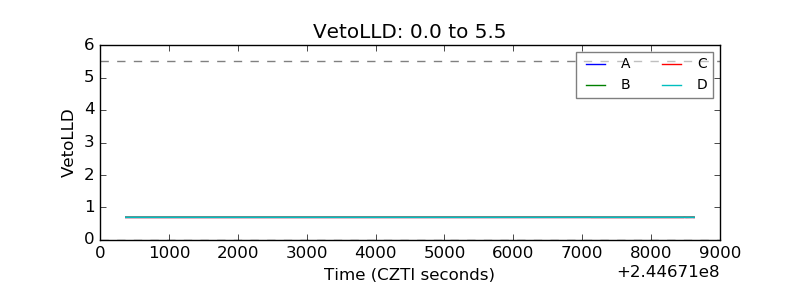 |
| Alpha Counter | 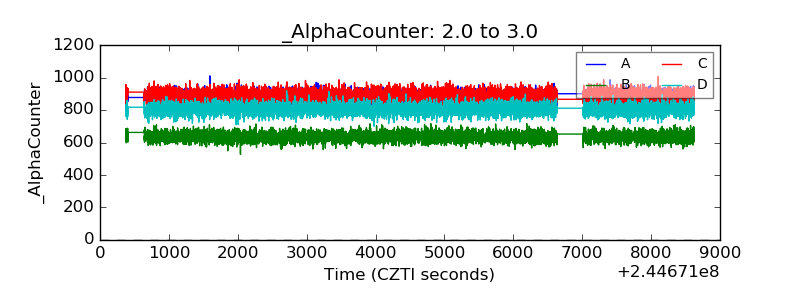 |
| _CPM_Rate | 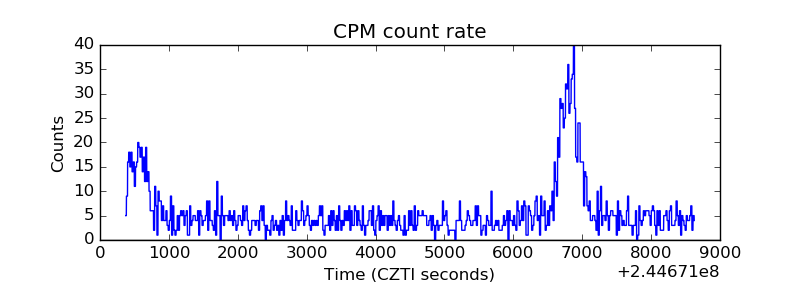 |
| CZT Counter | 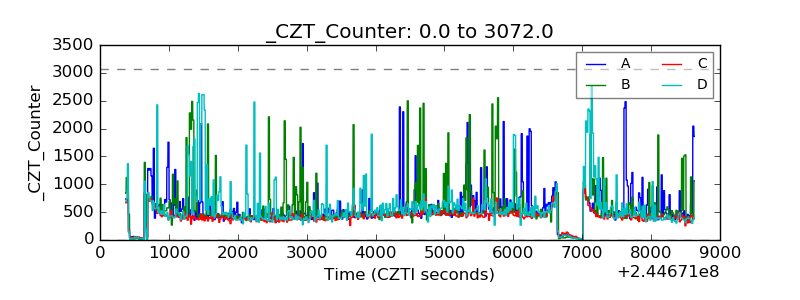 |
| +2.5 Volts monitor |  |
| +5 Volts monitor |  |
| _ROLL_ROT | 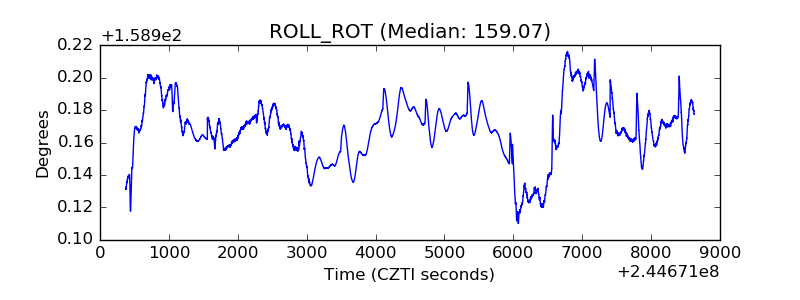 |
| _Roll_DEC | 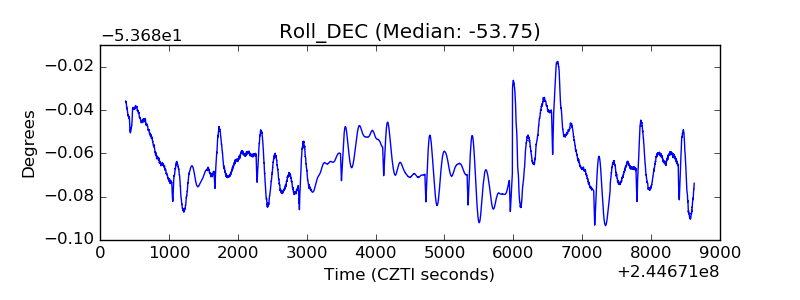 |
| _Roll_RA | 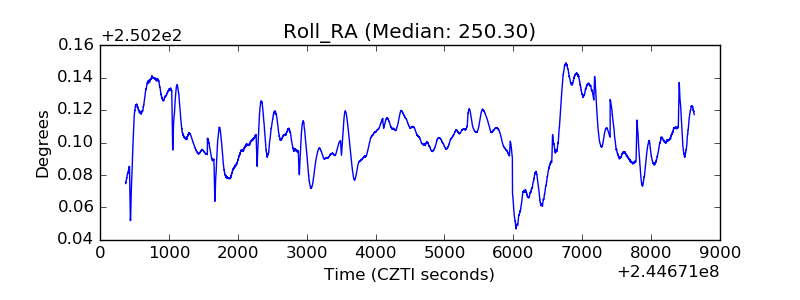 |
| Veto Counter | 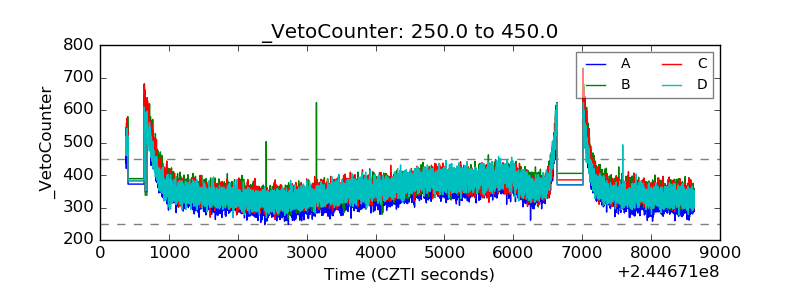 |