| Param | Original file | Final file |
|---|---|---|
| Filename | modeM0/AS1A04_055T01_9000001574_10893cztM0_level2.evt | modeM0/AS1A04_055T01_9000001574_10893cztM0_level2_quad_clean.evt |
| Size (bytes) | 1,434,723,840 | 229,420,800 |
| Size | 1.3 GB | 218.8 MB |
| Events in quadrant A | 12,796,005 | 1,401,567 |
| Events in quadrant B | 12,463,173 | 1,411,437 |
| Events in quadrant C | 7,962,704 | 1,480,025 |
| Events in quadrant D | 9,004,408 | 1,405,036 |
| Mode M0 | |||
|---|---|---|---|
| Quadrant | BADHDUFLAG | Total packets | Discarded packets |
| A | 0 | 49958 | 4 |
| B | 0 | 49103 | 3 |
| C | 0 | 36756 | 3 |
| D | 0 | 39586 | 3 |
| Mode M9 | |||
|---|---|---|---|
| Quadrant | BADHDUFLAG | Total packets | Discarded packets |
| A | 0 | 22 | 0 |
| B | 0 | 22 | 0 |
| C | 0 | 22 | 0 |
| D | 0 | 22 | 0 |
| Mode SS | |||
|---|---|---|---|
| Quadrant | BADHDUFLAG | Total packets | Discarded packets |
| A | 0 | 368 | 0 |
| B | 0 | 368 | 0 |
| C | 0 | 368 | 0 |
| D | 0 | 368 | 0 |
| Quadrant | Total seconds | Saturated seconds | Saturation percentage |
|---|---|---|---|
| A | 18136 | 1063 | 5.861270% |
| B | 18136 | 1356 | 7.476842% |
| C | 18136 | 87 | 0.479709% |
| D | 18136 | 162 | 0.893251% |
Noise dominated data is calculated using 1-second bins in cleaned event files. If a bin has >2000 counts, and if more than 50% of those come from <1% of pixels, then it is considered to be noise-dominated and hence unusable.
| Quadrant | # 1 sec bins | Bins with >0 counts | Bins with >2000 counts | High rate bins dominated by noise | Noise dominated (total time) | Noise dominated (detector-on time) | Marked lightcurve |
|---|---|---|---|---|---|---|---|
| A | 20316 | 18139 | 668 | 668 | 3.29% | 3.68% | 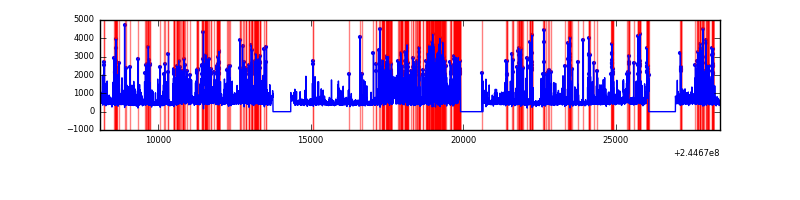 |
| B | 20316 | 18139 | 824 | 824 | 4.06% | 4.54% | 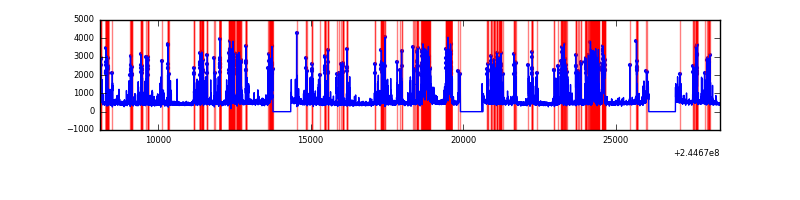 |
| C | 20316 | 18140 | 7 | 7 | 0.03% | 0.04% | 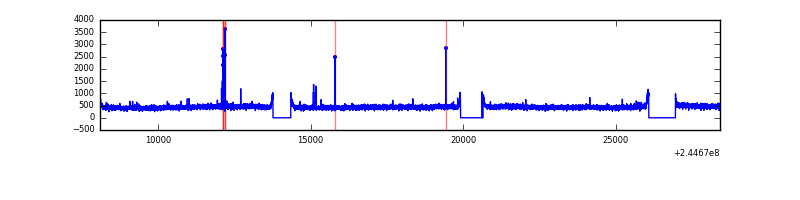 |
| D | 20316 | 18139 | 82 | 82 | 0.40% | 0.45% | 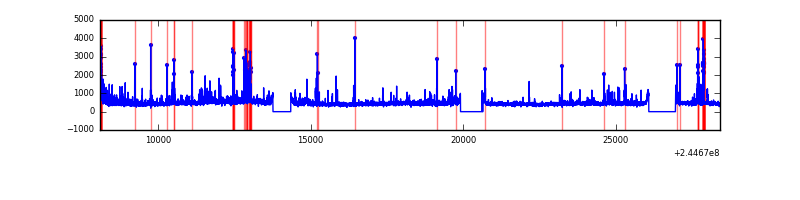 |
Top three noisy pixels from each quadrant. If the there are fewer than three noisy pixels in the level2.evt file, extra rows are filled as -1
| Pixel properties | Quadrant properties | ||||||
|---|---|---|---|---|---|---|---|
| Quadrant | DetID | PixID | Counts | Sigma | Mean | Median | Sigma |
| A | 8 | 5 | 4529868 | 11018.4 | 2034 | 1988 | 410.9 |
| A | 5 | 16 | 368306 | 891.42 | 2034 | 1988 | 410.9 |
| A | 11 | 29 | 24184 | 54.01 | 2034 | 1988 | 410.9 |
| B | 4 | 239 | 4219745 | 10980.79 | 2032 | 1983 | 384.1 |
| B | 0 | 214 | 146020 | 375.0 | 2032 | 1983 | 384.1 |
| B | 0 | 219 | 53586 | 134.35 | 2032 | 1983 | 384.1 |
| C | 14 | 234 | 38679 | 78.52 | 2020 | 2024 | 466.8 |
| C | 14 | 67 | 19321 | 37.05 | 2020 | 2024 | 466.8 |
| C | 13 | 61 | 15206 | 28.24 | 2020 | 2024 | 466.8 |
| D | 10 | 199 | 233447 | 479.66 | 2006 | 1950 | 482.6 |
| D | 8 | 195 | 215681 | 442.85 | 2006 | 1950 | 482.6 |
| D | 9 | 85 | 165714 | 339.32 | 2006 | 1950 | 482.6 |
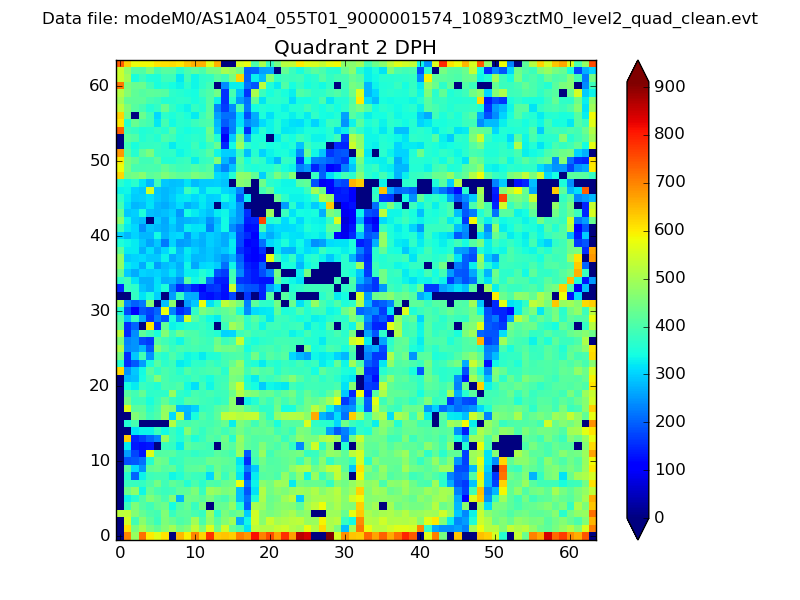
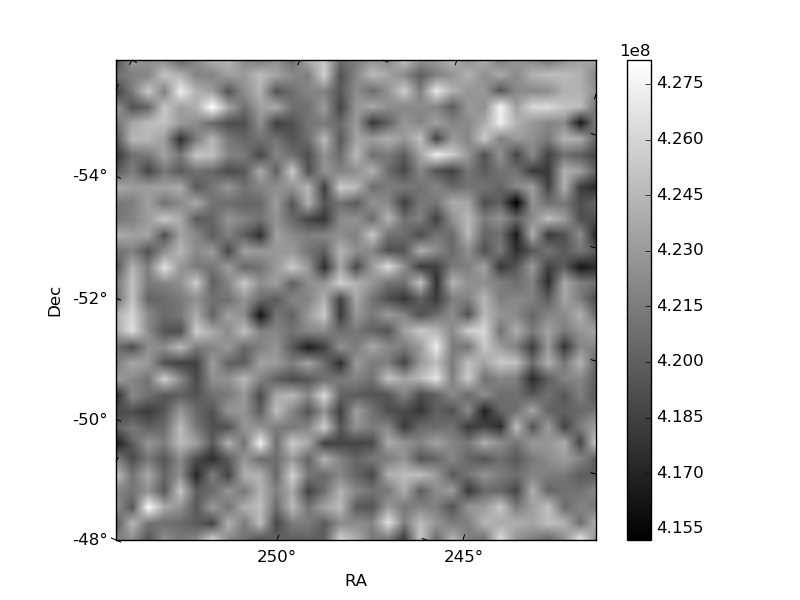
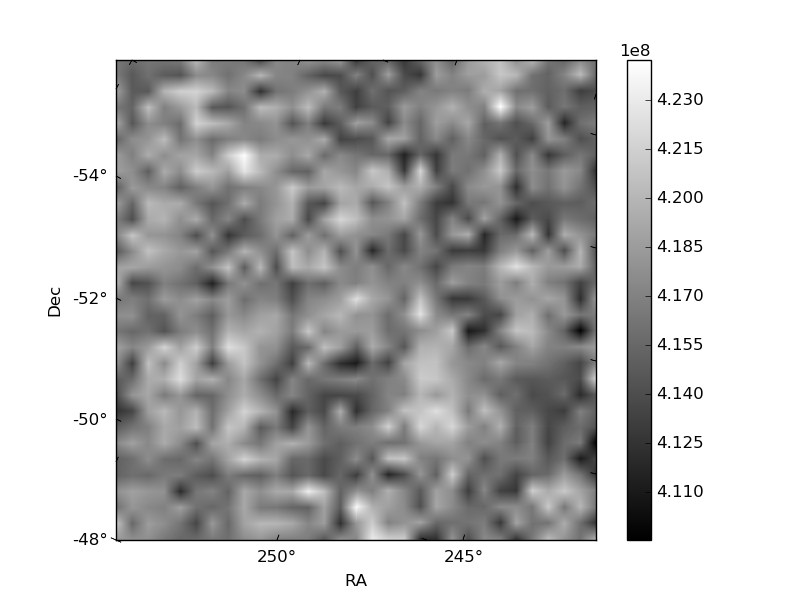
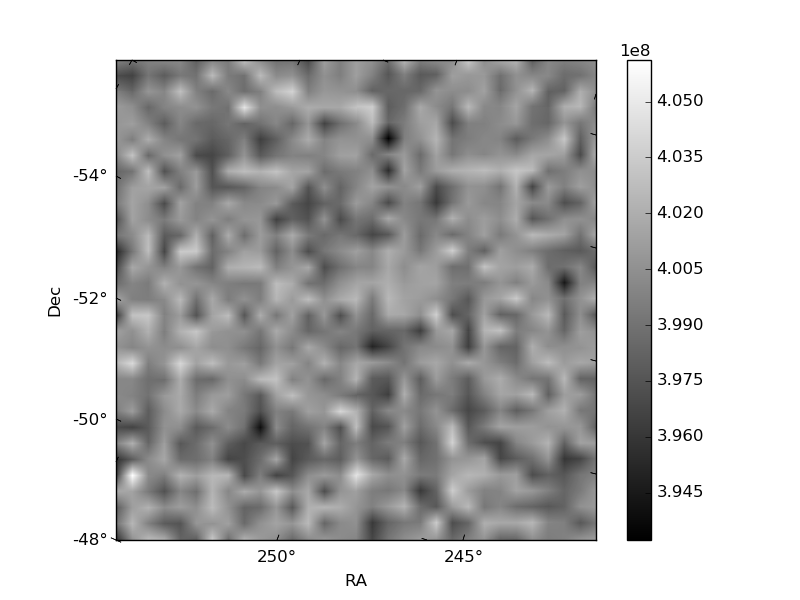
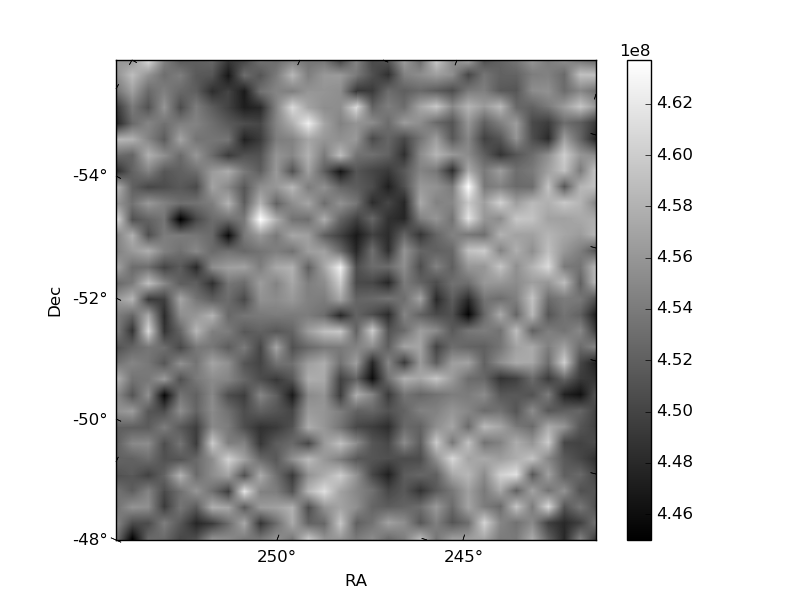
Histogram calculated using DETX and DETY for each event in the final _common_clean file
| Quadrant A | 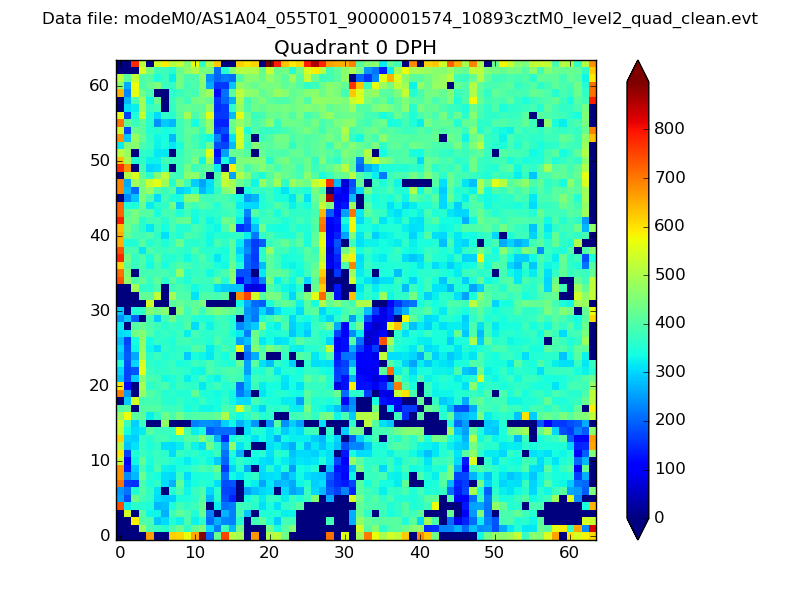 |
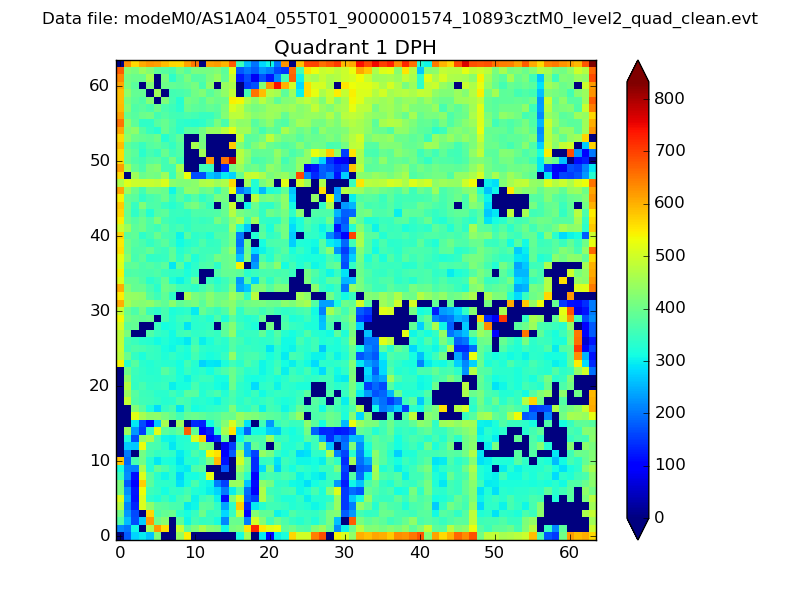 |
Quadrant B |
|---|---|---|---|
| Quadrant D | 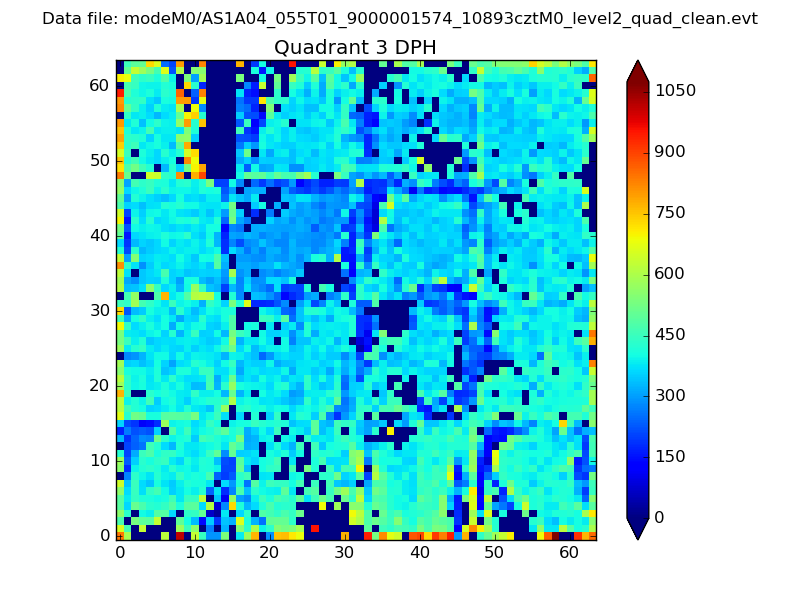 |
 |
Quadrant C |
| Plot type | Count rate plots | Images |
|---|---|---|
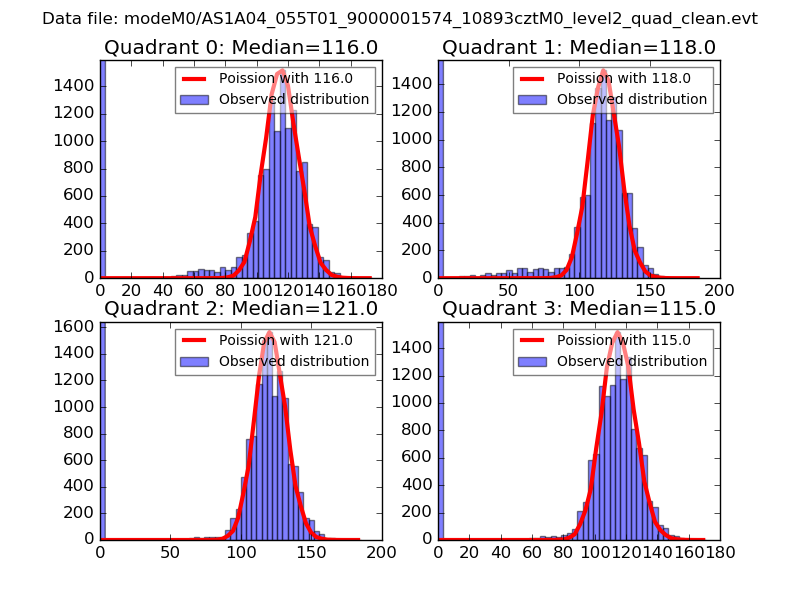
| Comparison with Poisson distribution Blue bars denote a histogram of data divided into 1 sec bins. Red curve is a Poisson curve with rate = median count rate of data. |
 |
 |
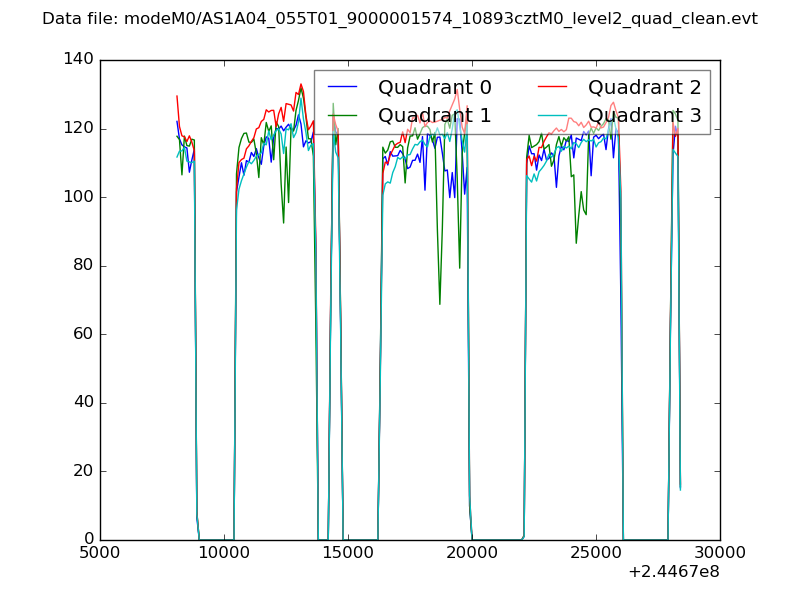
| Quadrant-wise count rates Data is divided into 100 sec bins |
 |
|
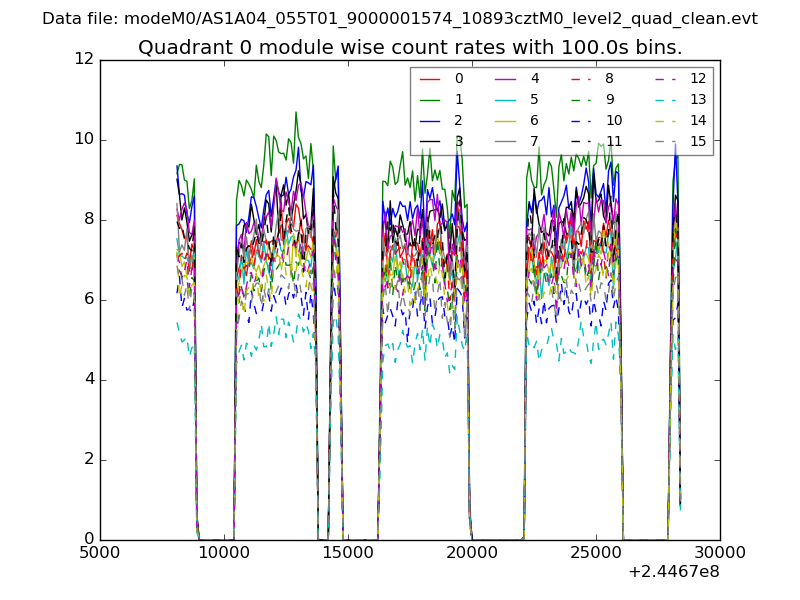
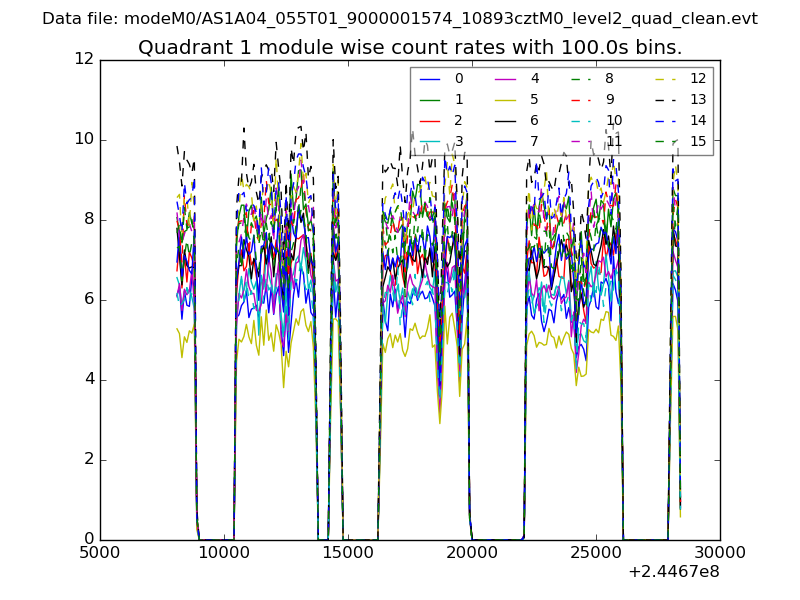
| Module-wise count rates for Quadrant A Data is divided into 100 sec bins |
 |
 |
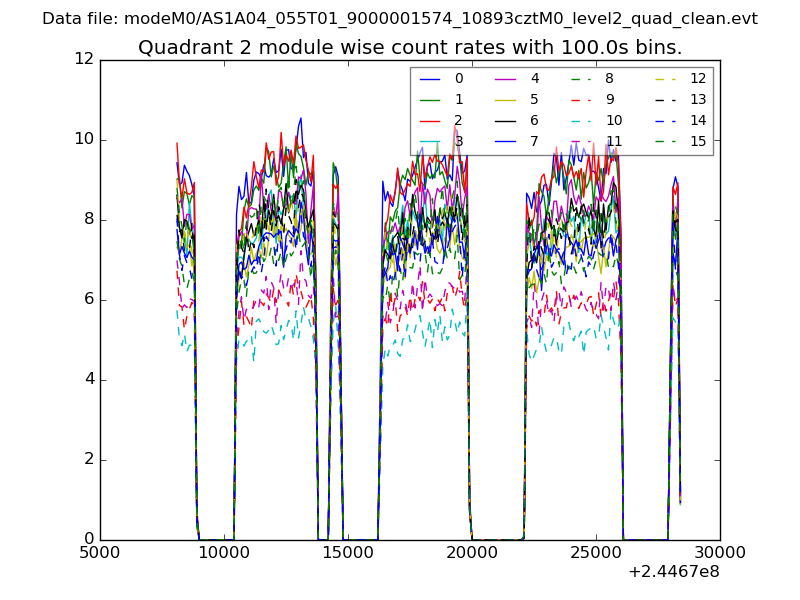
| Module-wise count rates for Quadrant B Data is divided into 100 sec bins |
 |
 |
| Module-wise count rates for Quadrant C Data is divided into 100 sec bins |
 |
 |
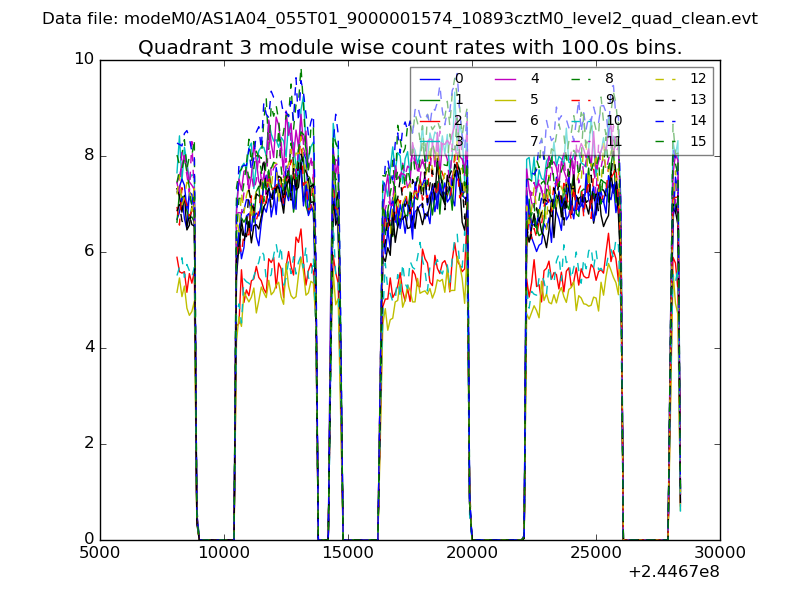
| Module-wise count rates for Quadrant D Data is divided into 100 sec bins |
 |
 |
| Parameter | Plot |
|---|---|
| CZT HV Monitor | 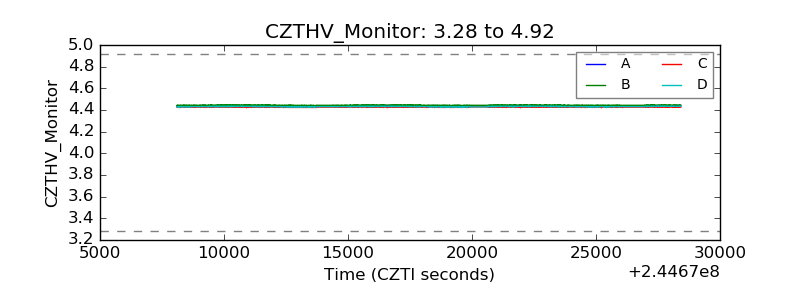 |
| D_VDD | 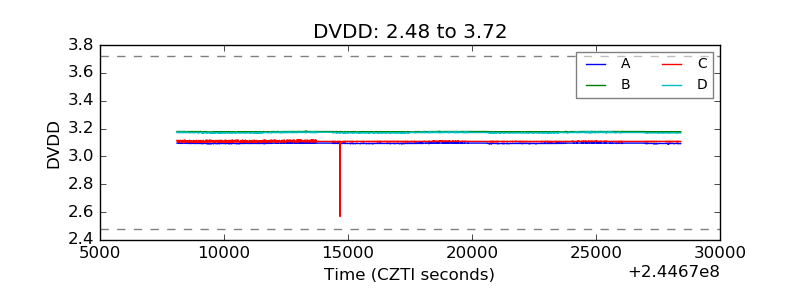 |
| Temperature 1 | 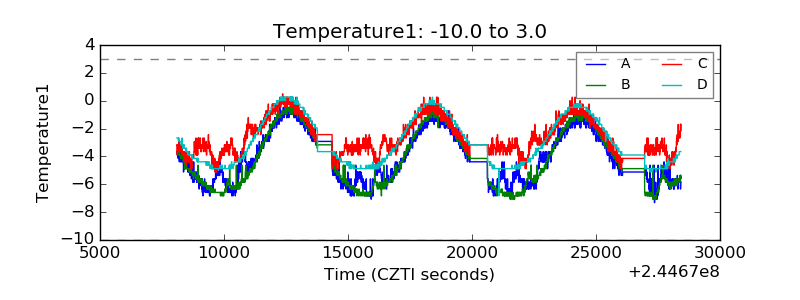 |
| Veto HV Monitor | 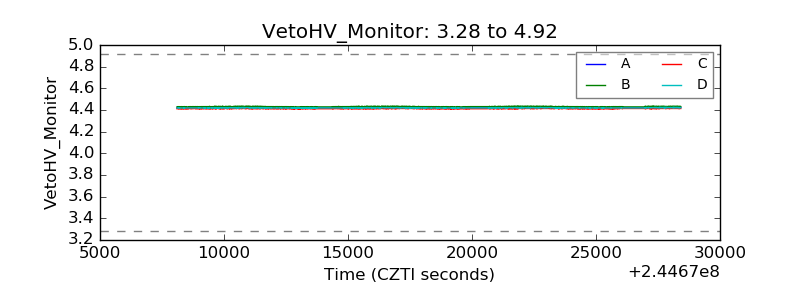 |
| Veto LLD | 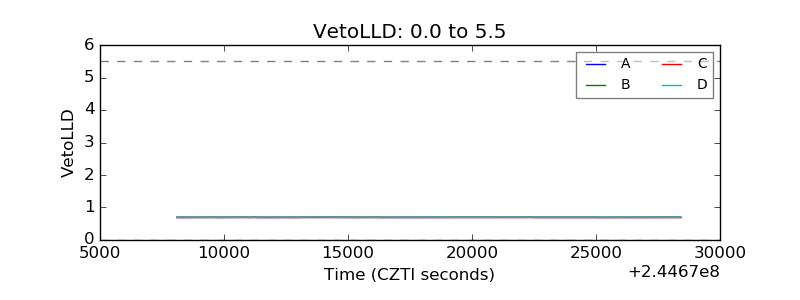 |
| Alpha Counter | 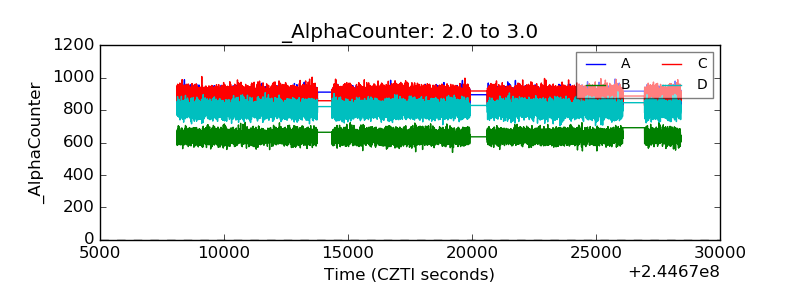 |
| _CPM_Rate | 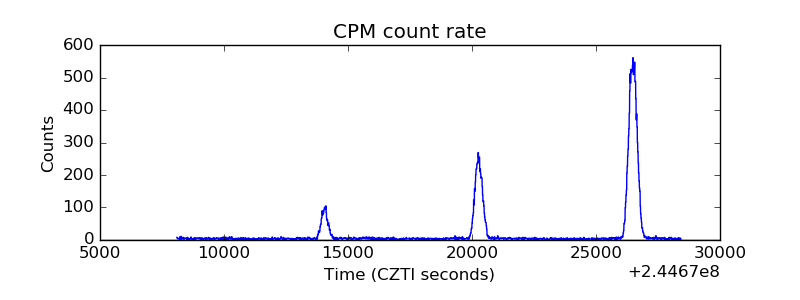 |
| CZT Counter | 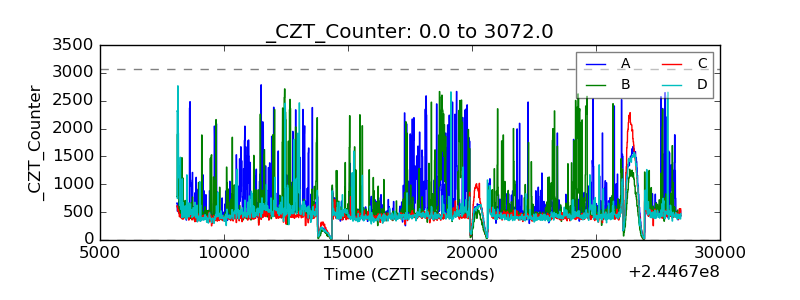 |
| +2.5 Volts monitor |  |
| +5 Volts monitor |  |
| _ROLL_ROT | 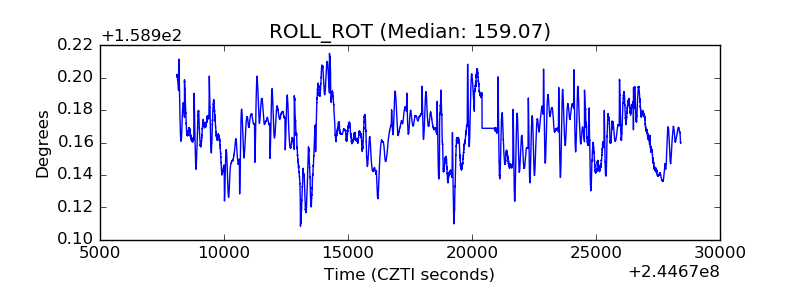 |
| _Roll_DEC | 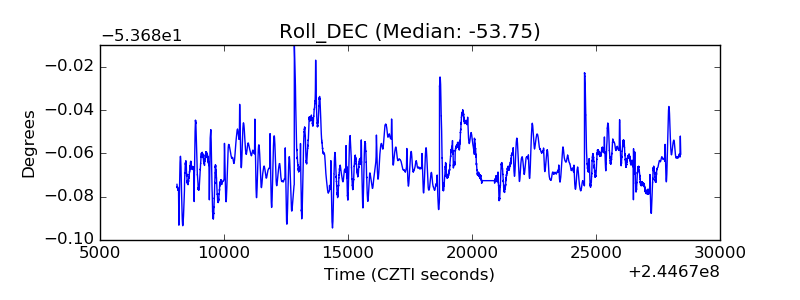 |
| _Roll_RA | 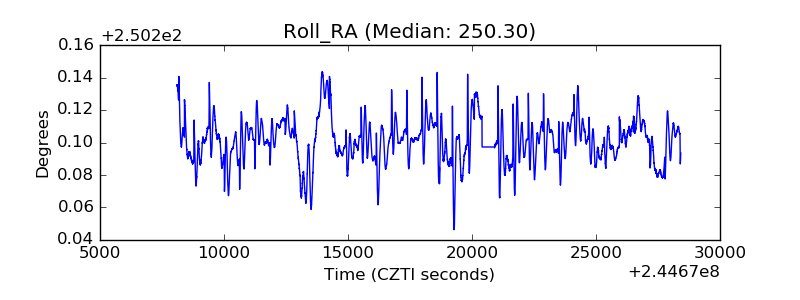 |
| Veto Counter | 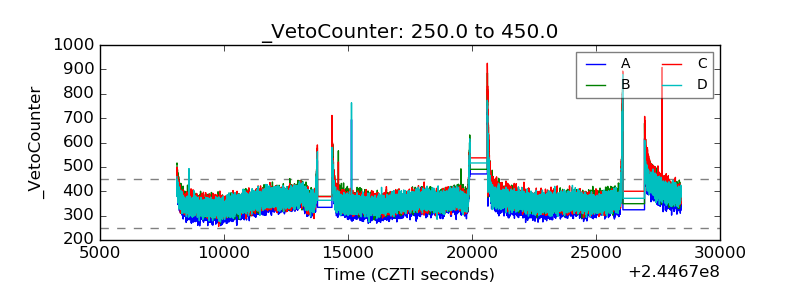 |