| Param | Original file | Final file |
|---|---|---|
| Filename | modeM0/AS1A04_055T01_9000001574_10894cztM0_level2.evt | modeM0/AS1A04_055T01_9000001574_10894cztM0_level2_quad_clean.evt |
| Size (bytes) | 470,226,240 | 91,621,440 |
| Size | 448.4 MB | 87.4 MB |
| Events in quadrant A | 3,987,277 | 579,050 |
| Events in quadrant B | 3,810,840 | 594,208 |
| Events in quadrant C | 2,813,633 | 600,191 |
| Events in quadrant D | 3,209,466 | 569,780 |
| Mode M0 | |||
|---|---|---|---|
| Quadrant | BADHDUFLAG | Total packets | Discarded packets |
| A | 0 | 15906 | 2 |
| B | 0 | 15393 | 1 |
| C | 0 | 12584 | 1 |
| D | 0 | 13729 | 1 |
| Mode M9 | |||
|---|---|---|---|
| Quadrant | BADHDUFLAG | Total packets | Discarded packets |
| A | 0 | 10 | 0 |
| B | 0 | 10 | 0 |
| C | 0 | 10 | 0 |
| D | 0 | 10 | 0 |
| Mode SS | |||
|---|---|---|---|
| Quadrant | BADHDUFLAG | Total packets | Discarded packets |
| A | 0 | 126 | 0 |
| B | 0 | 126 | 0 |
| C | 0 | 126 | 0 |
| D | 0 | 126 | 0 |
| Quadrant | Total seconds | Saturated seconds | Saturation percentage |
|---|---|---|---|
| A | 6177 | 245 | 3.966327% |
| B | 6177 | 255 | 4.128218% |
| C | 6177 | 54 | 0.874211% |
| D | 6177 | 118 | 1.910312% |
Noise dominated data is calculated using 1-second bins in cleaned event files. If a bin has >2000 counts, and if more than 50% of those come from <1% of pixels, then it is considered to be noise-dominated and hence unusable.
| Quadrant | # 1 sec bins | Bins with >0 counts | Bins with >2000 counts | High rate bins dominated by noise | Noise dominated (total time) | Noise dominated (detector-on time) | Marked lightcurve |
|---|---|---|---|---|---|---|---|
| A | 7192 | 6177 | 133 | 133 | 1.85% | 2.15% | 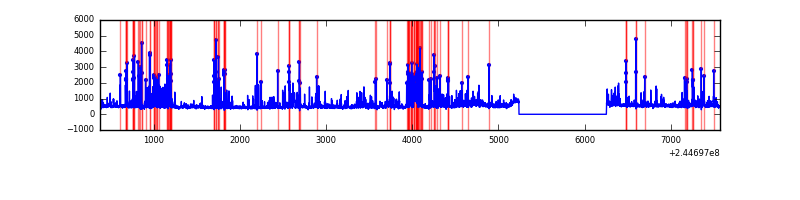 |
| B | 7192 | 6177 | 106 | 106 | 1.47% | 1.72% | 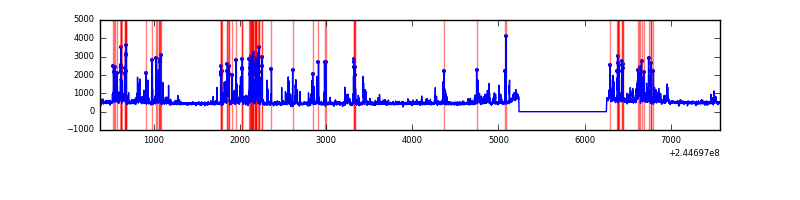 |
| C | 7192 | 6177 | 0 | 0 | 0.00% | 0.00% | 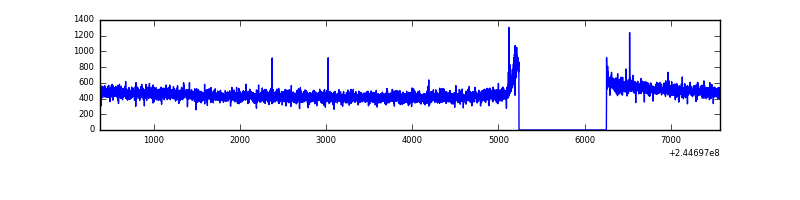 |
| D | 7192 | 6177 | 61 | 61 | 0.85% | 0.99% | 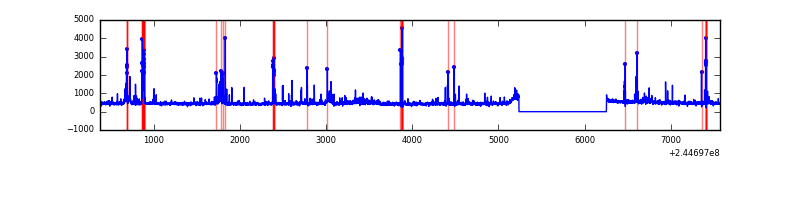 |
Top three noisy pixels from each quadrant. If the there are fewer than three noisy pixels in the level2.evt file, extra rows are filled as -1
| Pixel properties | Quadrant properties | ||||||
|---|---|---|---|---|---|---|---|
| Quadrant | DetID | PixID | Counts | Sigma | Mean | Median | Sigma |
| A | 8 | 5 | 1163043 | 7901.28 | 726 | 711 | 147.1 |
| A | 8 | 6 | 9290 | 58.32 | 726 | 711 | 147.1 |
| A | 0 | 226 | 6584 | 39.92 | 726 | 711 | 147.1 |
| B | 4 | 239 | 893794 | 6404.77 | 728 | 709 | 139.4 |
| B | 0 | 214 | 36462 | 256.4 | 728 | 709 | 139.4 |
| B | 0 | 219 | 31672 | 222.05 | 728 | 709 | 139.4 |
| C | 14 | 234 | 5379 | 28.2 | 718 | 721 | 165.2 |
| C | 13 | 61 | 5312 | 27.8 | 718 | 721 | 165.2 |
| C | 8 | 222 | 4345 | 21.94 | 718 | 721 | 165.2 |
| D | 9 | 85 | 176726 | 1029.37 | 710 | 690 | 171.0 |
| D | 1 | 52 | 61667 | 356.56 | 710 | 690 | 171.0 |
| D | 5 | 222 | 59291 | 342.67 | 710 | 690 | 171.0 |
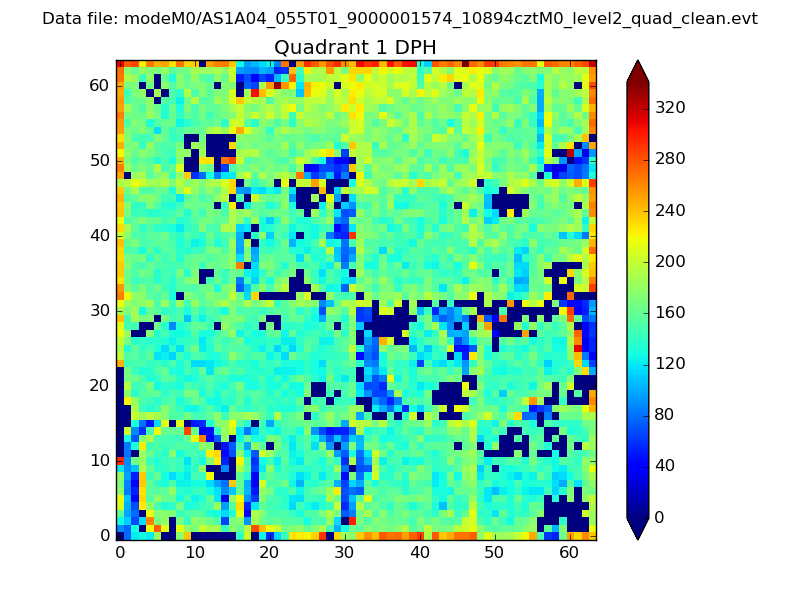
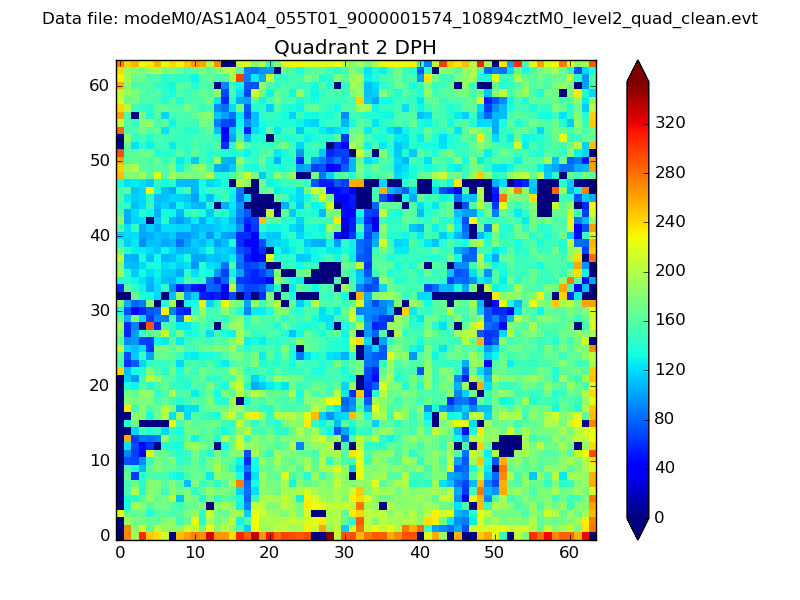
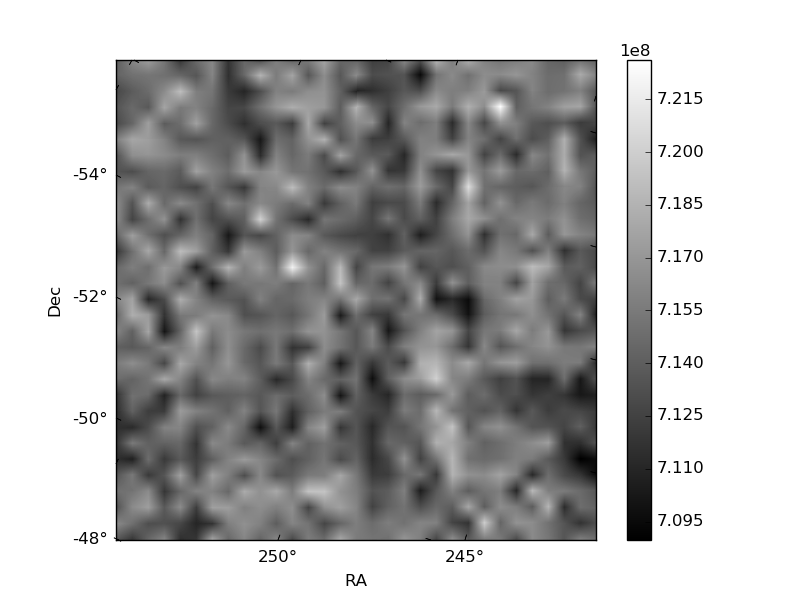
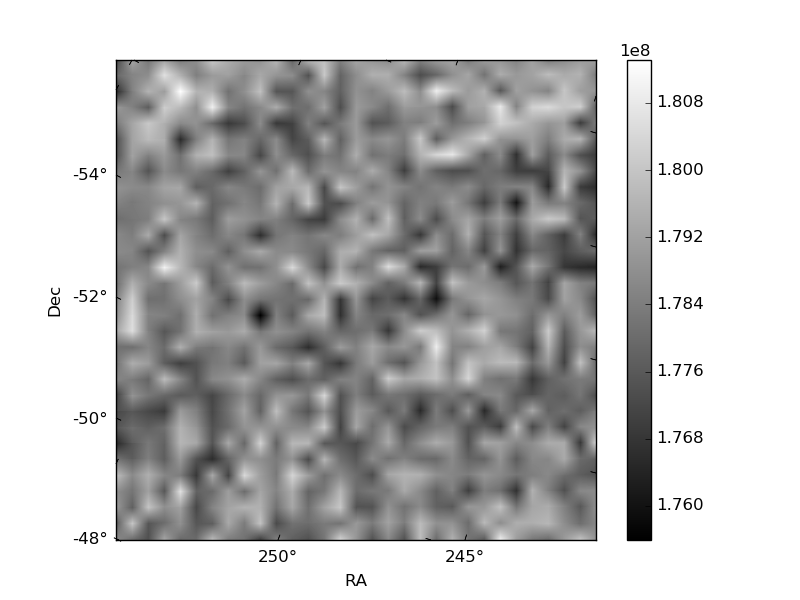
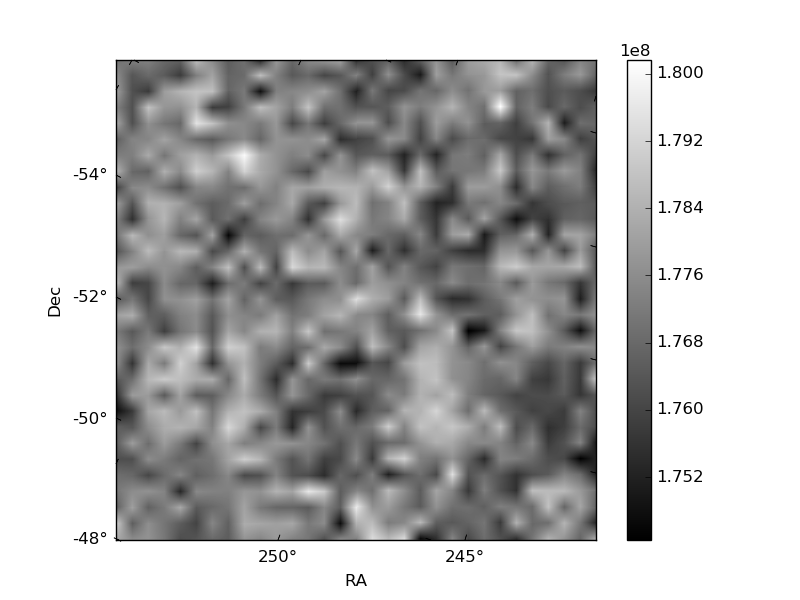
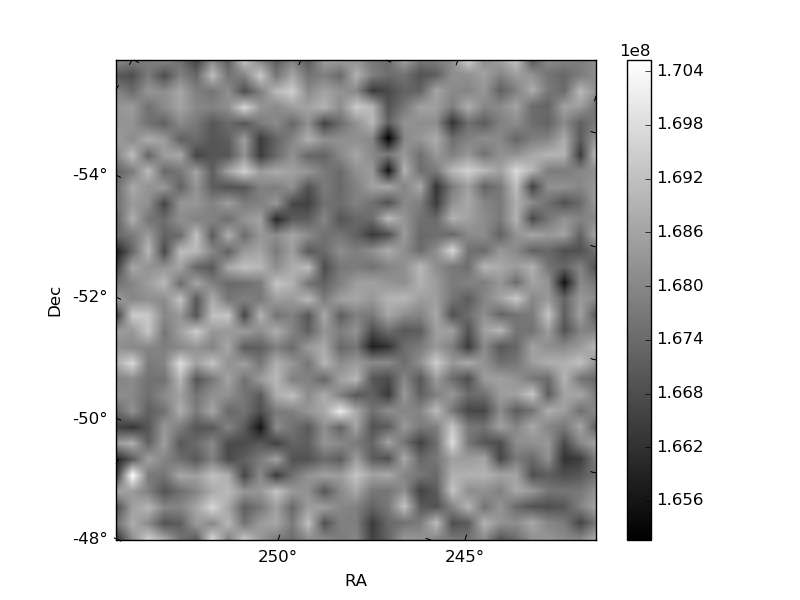
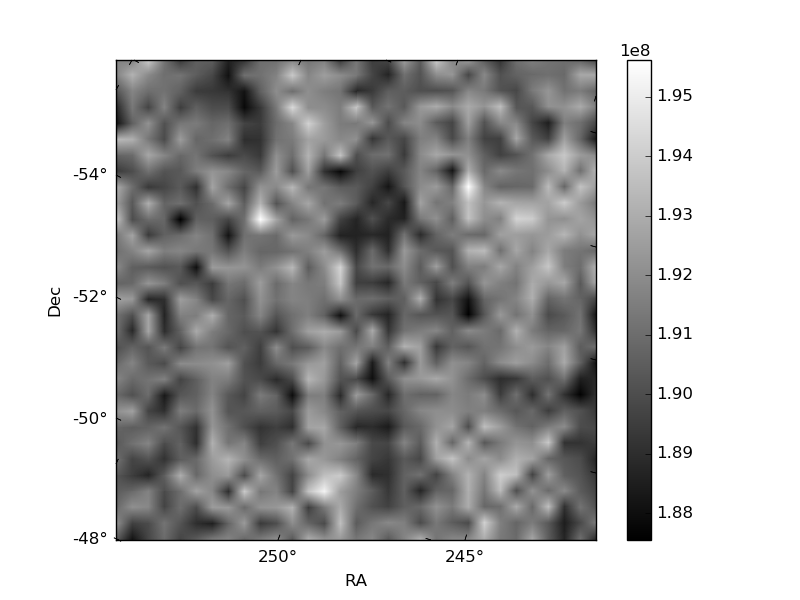
Histogram calculated using DETX and DETY for each event in the final _common_clean file
| Quadrant A | 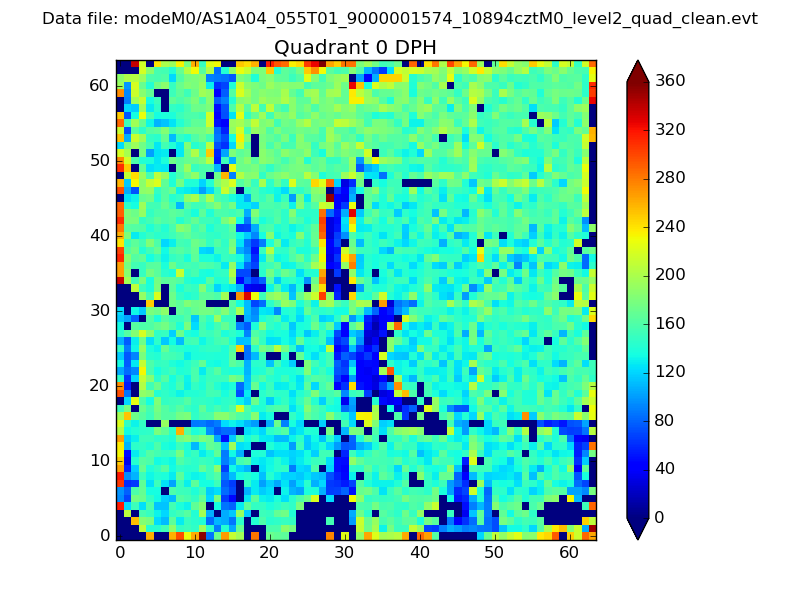 |
 |
Quadrant B |
|---|---|---|---|
| Quadrant D |  |
 |
Quadrant C |
| Plot type | Count rate plots | Images |
|---|---|---|
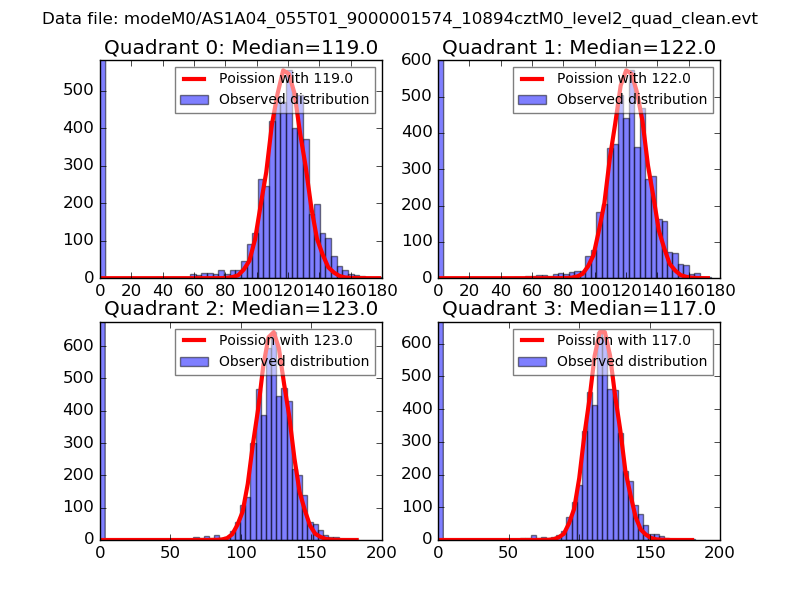
| Comparison with Poisson distribution Blue bars denote a histogram of data divided into 1 sec bins. Red curve is a Poisson curve with rate = median count rate of data. |
 |
 |
| Quadrant-wise count rates Data is divided into 100 sec bins |
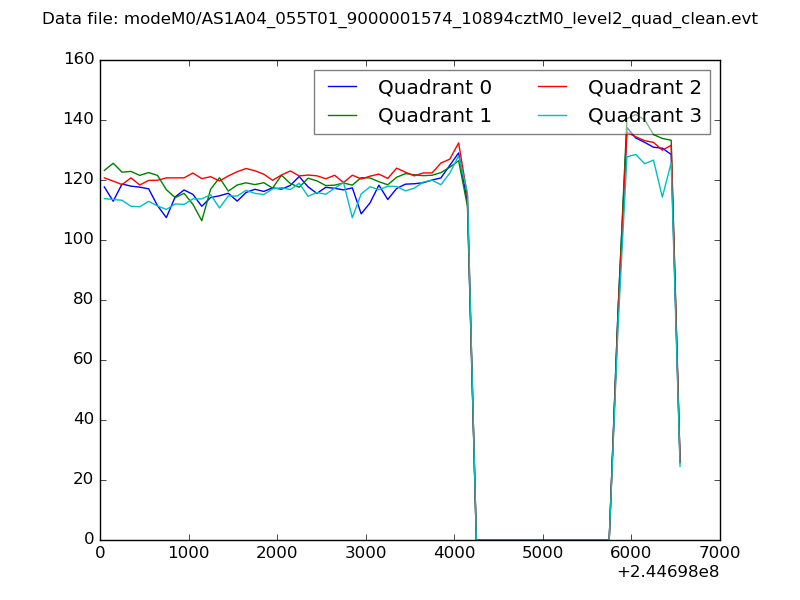 |
|
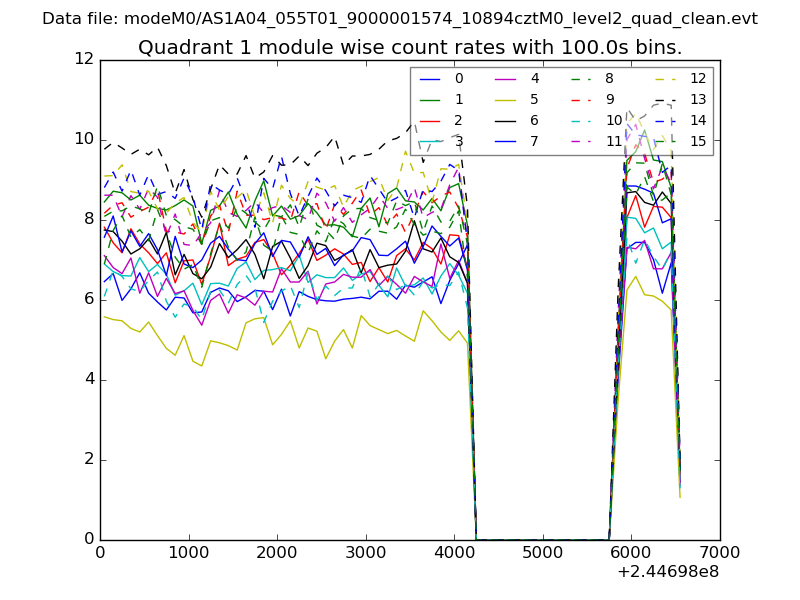
| Module-wise count rates for Quadrant A Data is divided into 100 sec bins |
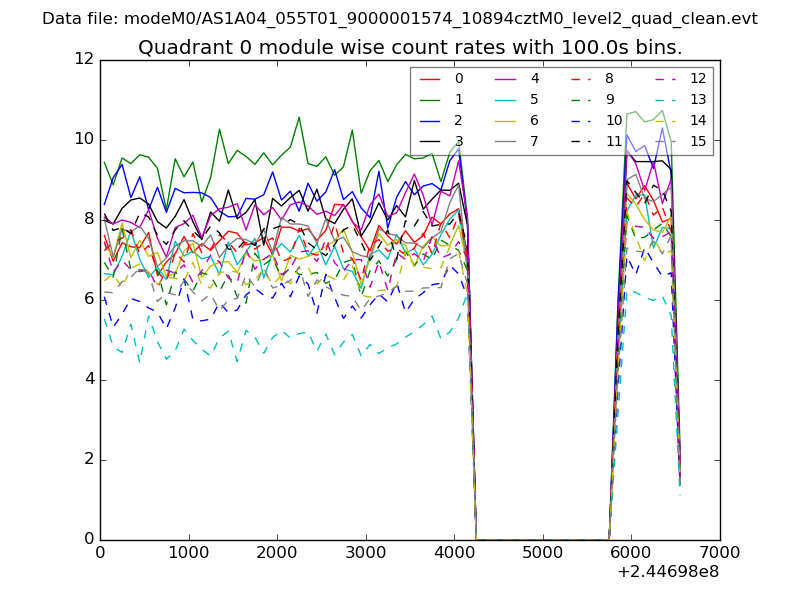 |
 |
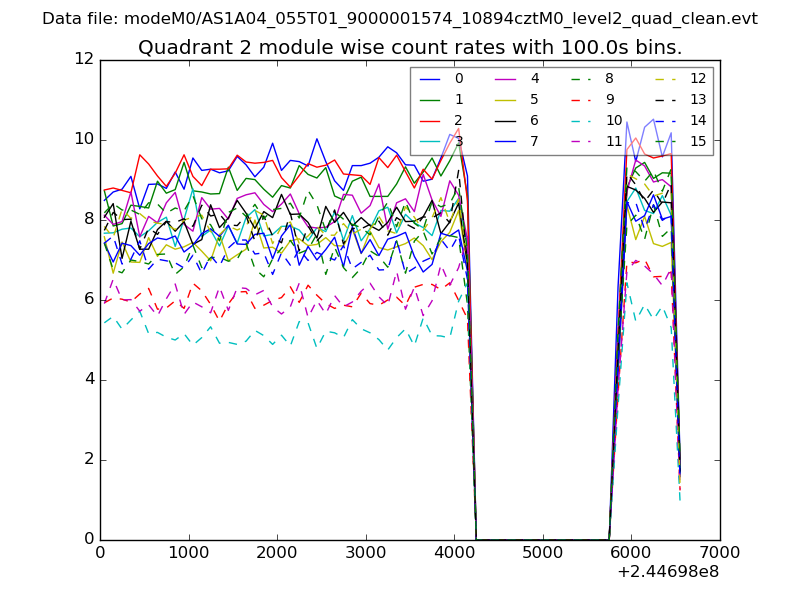
| Module-wise count rates for Quadrant B Data is divided into 100 sec bins |
 |
 |
| Module-wise count rates for Quadrant C Data is divided into 100 sec bins |
 |
 |
| Module-wise count rates for Quadrant D Data is divided into 100 sec bins |
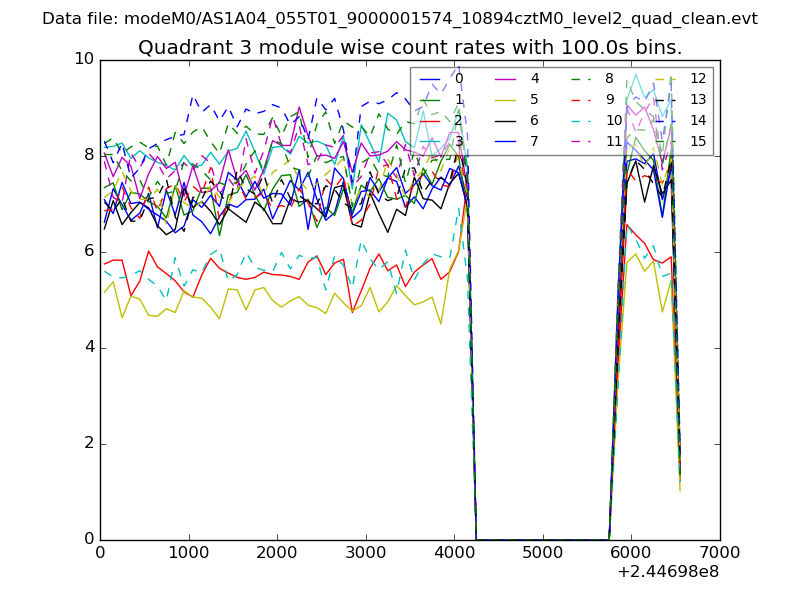 |
 |
| Parameter | Plot |
|---|---|
| CZT HV Monitor | 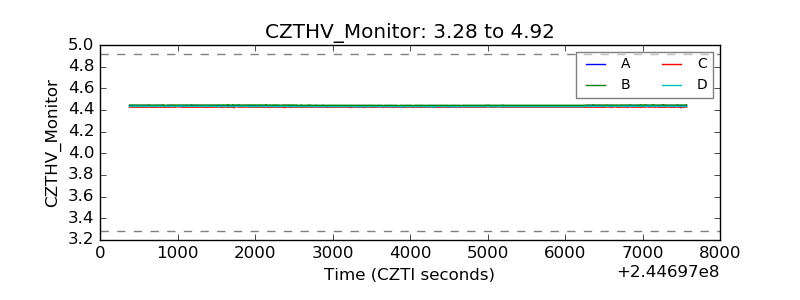 |
| D_VDD | 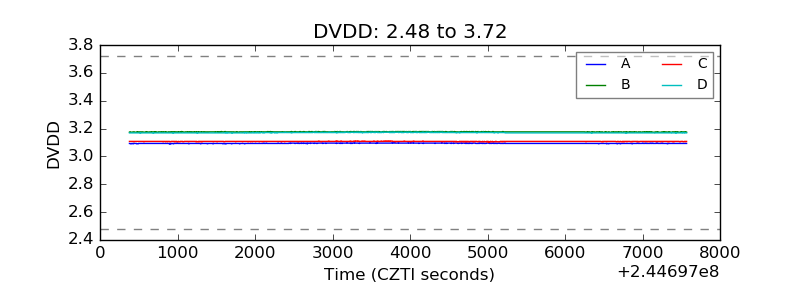 |
| Temperature 1 |  |
| Veto HV Monitor | 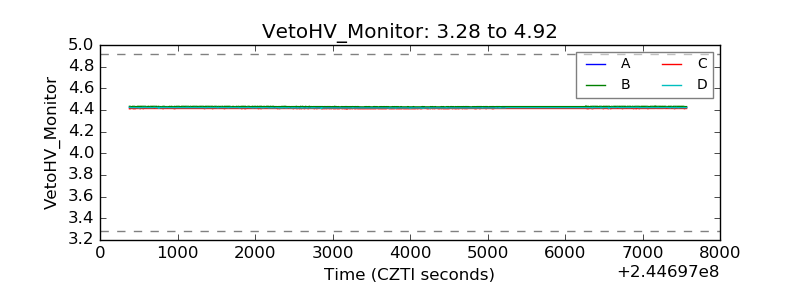 |
| Veto LLD | 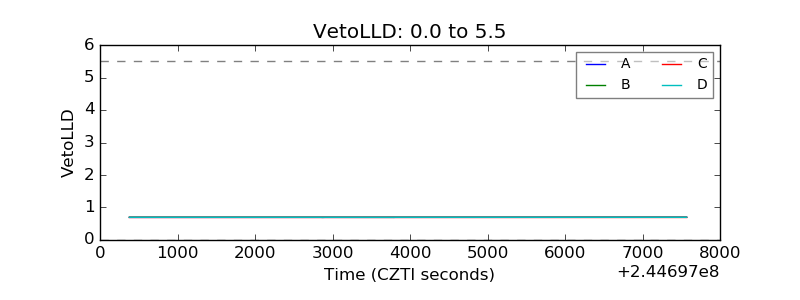 |
| Alpha Counter | 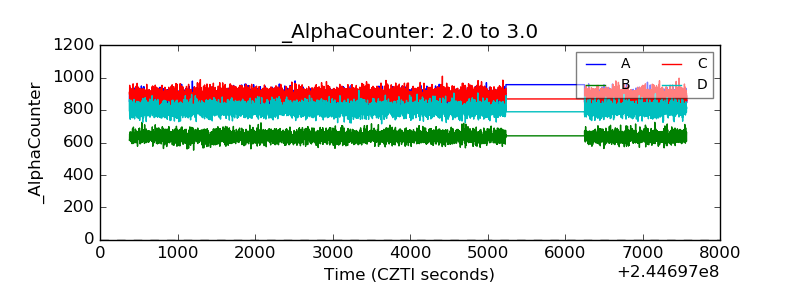 |
| _CPM_Rate | 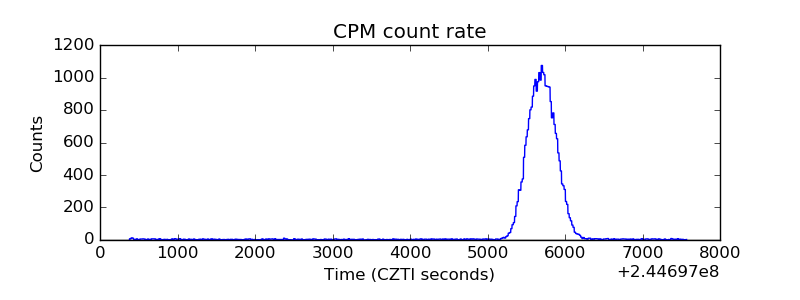 |
| CZT Counter | 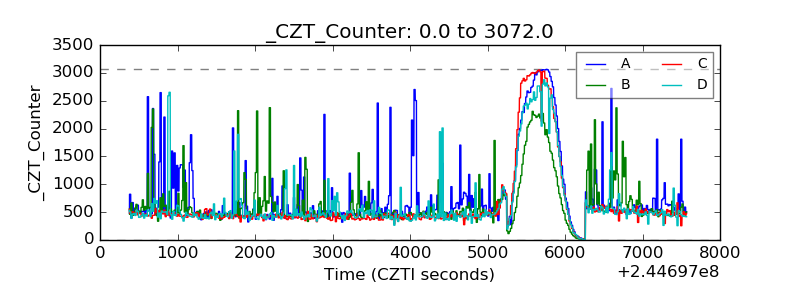 |
| +2.5 Volts monitor |  |
| +5 Volts monitor |  |
| _ROLL_ROT | 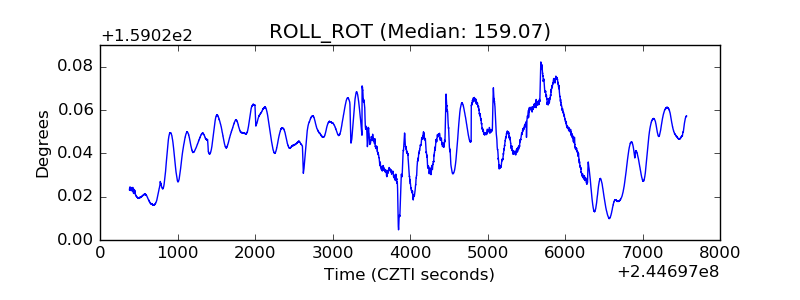 |
| _Roll_DEC | 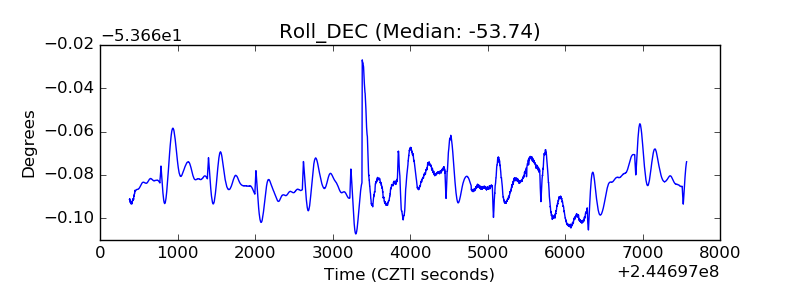 |
| _Roll_RA | 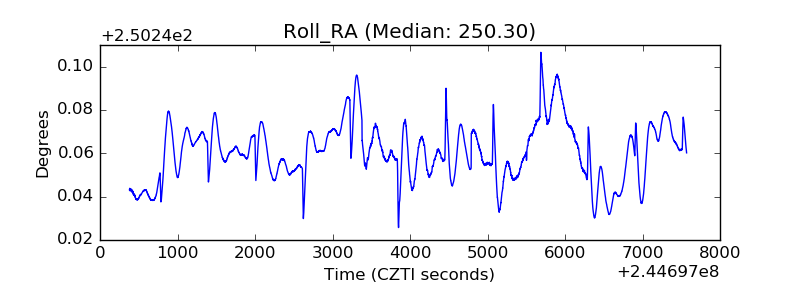 |
| Veto Counter | 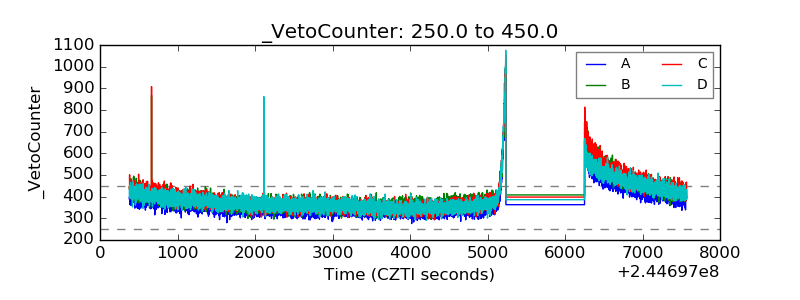 |