| Param | Original file | Final file |
|---|---|---|
| Filename | modeM0/AS1A04_055T01_9000001574_10896cztM0_level2.evt | modeM0/AS1A04_055T01_9000001574_10896cztM0_level2_quad_clean.evt |
| Size (bytes) | 566,749,440 | 102,479,040 |
| Size | 540.5 MB | 97.7 MB |
| Events in quadrant A | 5,822,446 | 613,915 |
| Events in quadrant B | 4,356,707 | 686,583 |
| Events in quadrant C | 3,053,406 | 696,461 |
| Events in quadrant D | 3,495,705 | 657,795 |
| Mode M0 | |||
|---|---|---|---|
| Quadrant | BADHDUFLAG | Total packets | Discarded packets |
| A | 0 | 21584 | 3 |
| B | 0 | 17263 | 2 |
| C | 0 | 13390 | 2 |
| D | 0 | 14658 | 2 |
| Mode M9 | |||
|---|---|---|---|
| Quadrant | BADHDUFLAG | Total packets | Discarded packets |
| A | 0 | 14 | 0 |
| B | 0 | 14 | 0 |
| C | 0 | 14 | 0 |
| D | 0 | 15 | 0 |
| Mode SS | |||
|---|---|---|---|
| Quadrant | BADHDUFLAG | Total packets | Discarded packets |
| A | 0 | 130 | 0 |
| B | 0 | 130 | 0 |
| C | 0 | 130 | 0 |
| D | 0 | 130 | 0 |
| Quadrant | Total seconds | Saturated seconds | Saturation percentage |
|---|---|---|---|
| A | 6427 | 1054 | 16.399564% |
| B | 6427 | 370 | 5.756963% |
| C | 6427 | 73 | 1.135833% |
| D | 6427 | 133 | 2.069395% |
Noise dominated data is calculated using 1-second bins in cleaned event files. If a bin has >2000 counts, and if more than 50% of those come from <1% of pixels, then it is considered to be noise-dominated and hence unusable.
| Quadrant | # 1 sec bins | Bins with >0 counts | Bins with >2000 counts | High rate bins dominated by noise | Noise dominated (total time) | Noise dominated (detector-on time) | Marked lightcurve |
|---|---|---|---|---|---|---|---|
| A | 7532 | 6427 | 692 | 692 | 9.19% | 10.77% | 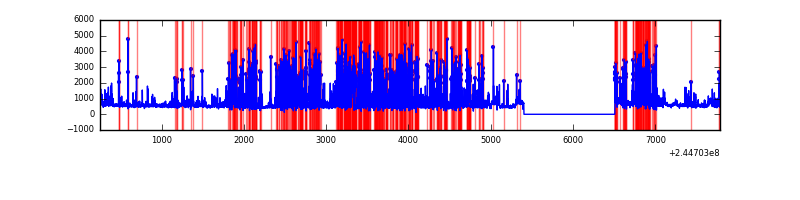 |
| B | 7532 | 6427 | 163 | 163 | 2.16% | 2.54% | 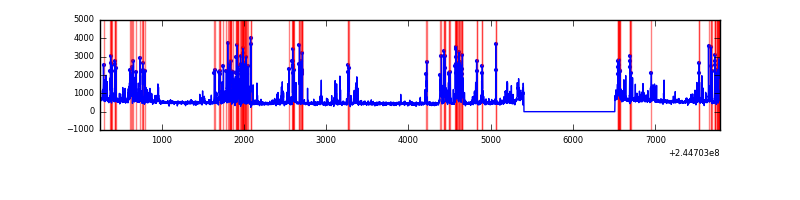 |
| C | 7532 | 6427 | 0 | 0 | 0.00% | 0.00% | 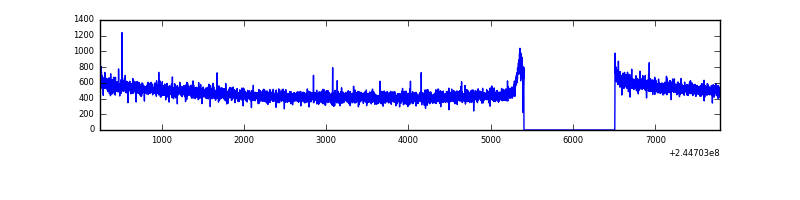 |
| D | 7532 | 6427 | 43 | 43 | 0.57% | 0.67% | 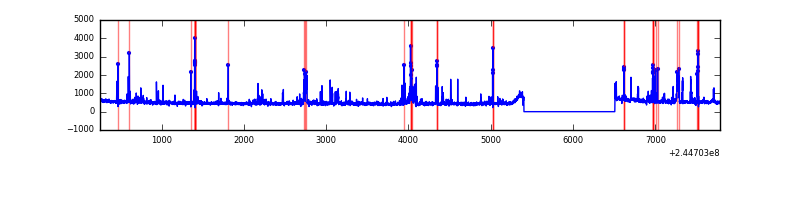 |
Top three noisy pixels from each quadrant. If the there are fewer than three noisy pixels in the level2.evt file, extra rows are filled as -1
| Pixel properties | Quadrant properties | ||||||
|---|---|---|---|---|---|---|---|
| Quadrant | DetID | PixID | Counts | Sigma | Mean | Median | Sigma |
| A | 8 | 5 | 2957971 | 19975.15 | 736 | 722 | 148.0 |
| A | 8 | 6 | 9291 | 57.88 | 736 | 722 | 148.0 |
| A | 1 | 162 | 9277 | 57.79 | 736 | 722 | 148.0 |
| B | 4 | 239 | 1218240 | 8209.96 | 784 | 766 | 148.3 |
| B | 0 | 214 | 28731 | 188.58 | 784 | 766 | 148.3 |
| B | 0 | 219 | 25417 | 166.23 | 784 | 766 | 148.3 |
| C | 13 | 61 | 5815 | 28.15 | 780 | 784 | 178.7 |
| C | 14 | 234 | 3409 | 14.69 | 780 | 784 | 178.7 |
| C | 8 | 222 | 2932 | 12.02 | 780 | 784 | 178.7 |
| D | 1 | 52 | 207055 | 1122.4 | 775 | 753 | 183.8 |
| D | 9 | 85 | 148633 | 804.55 | 775 | 753 | 183.8 |
| D | 2 | 14 | 40157 | 214.38 | 775 | 753 | 183.8 |
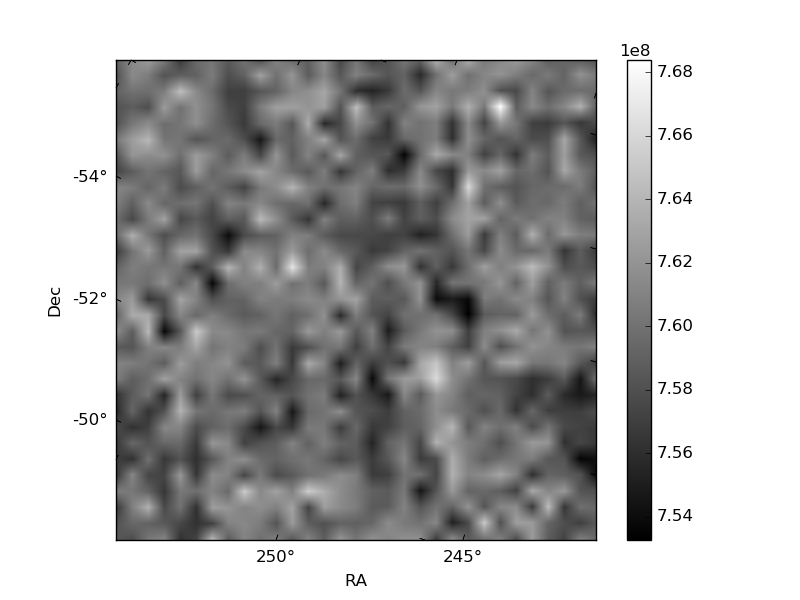
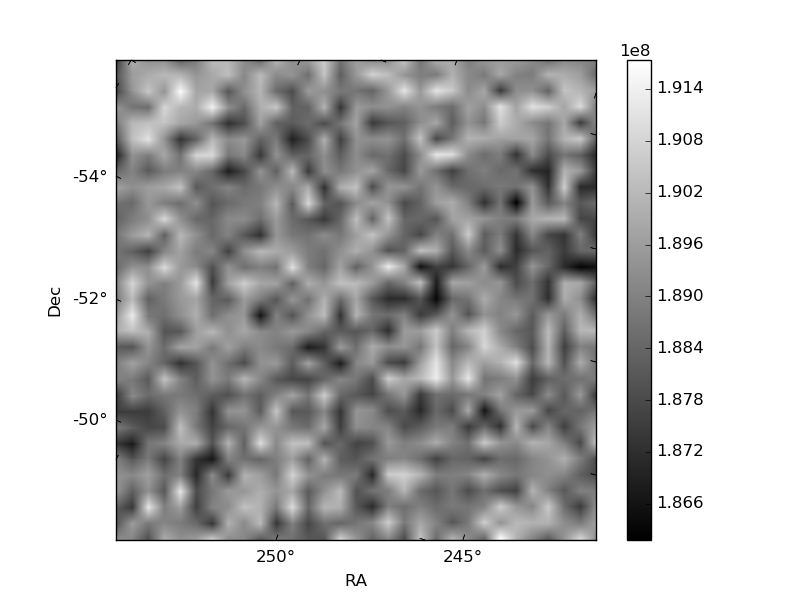
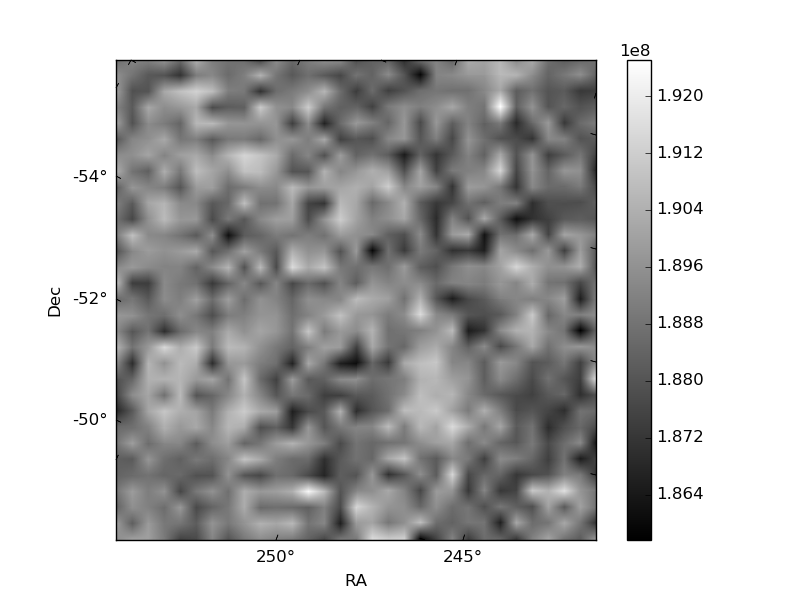
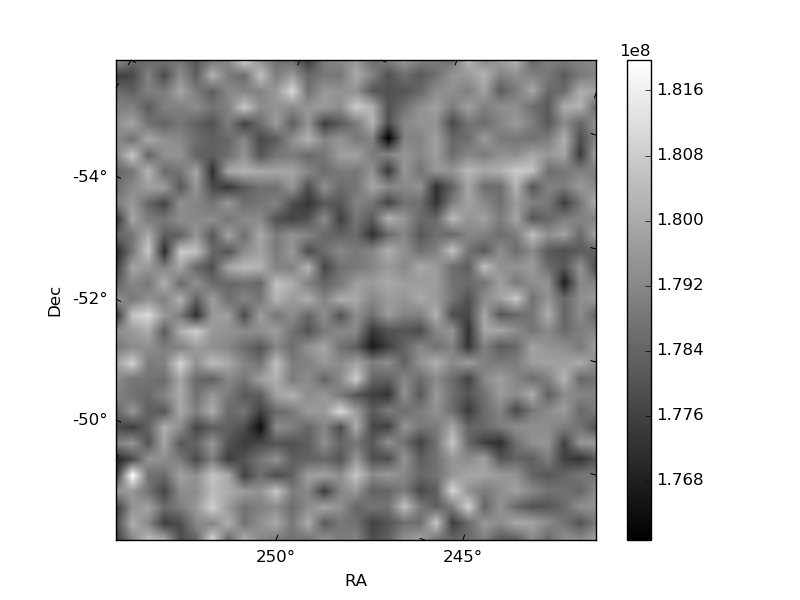
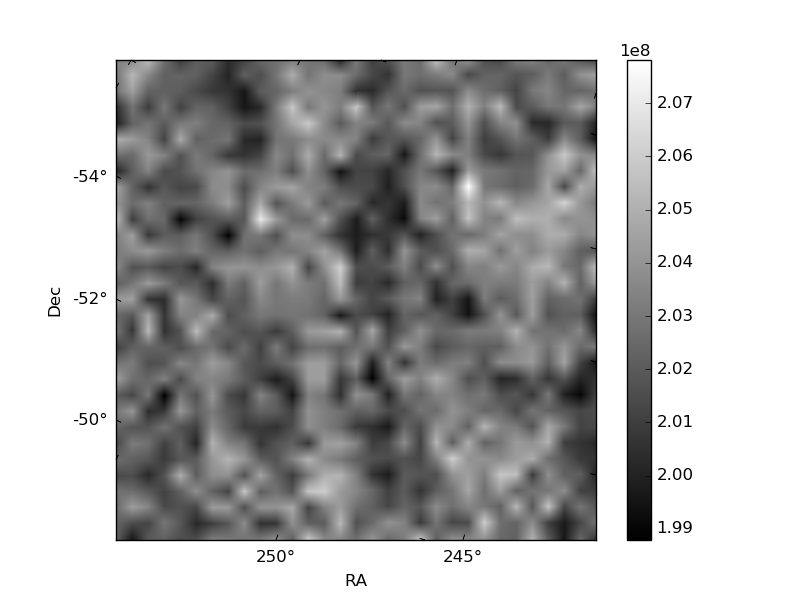
Histogram calculated using DETX and DETY for each event in the final _common_clean file
| Quadrant A | 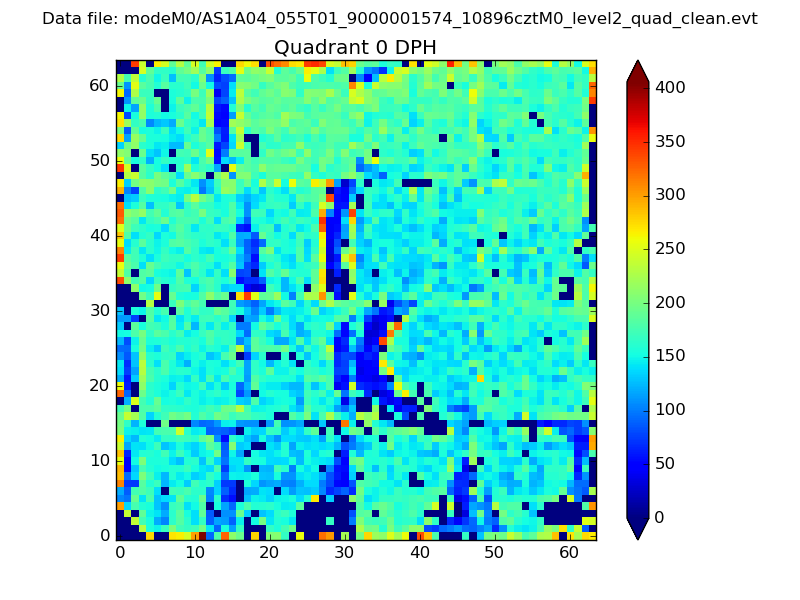 |
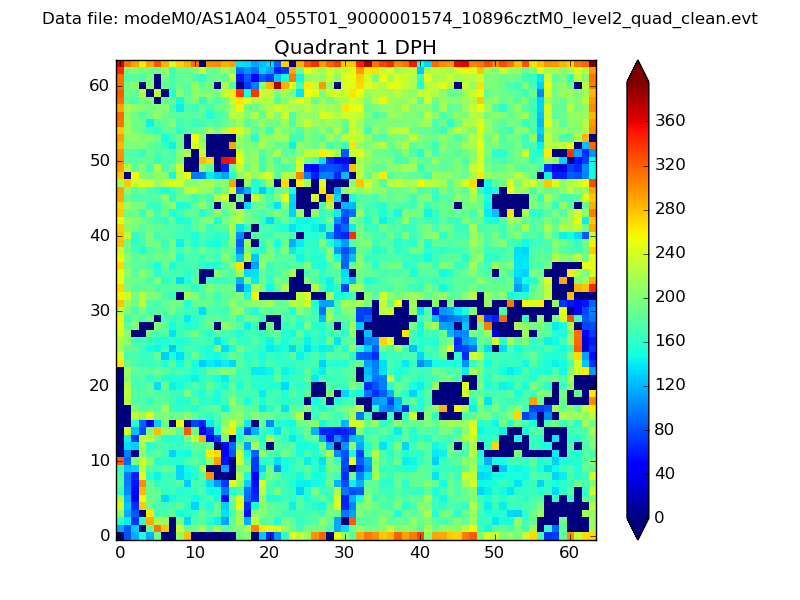 |
Quadrant B |
|---|---|---|---|
| Quadrant D | 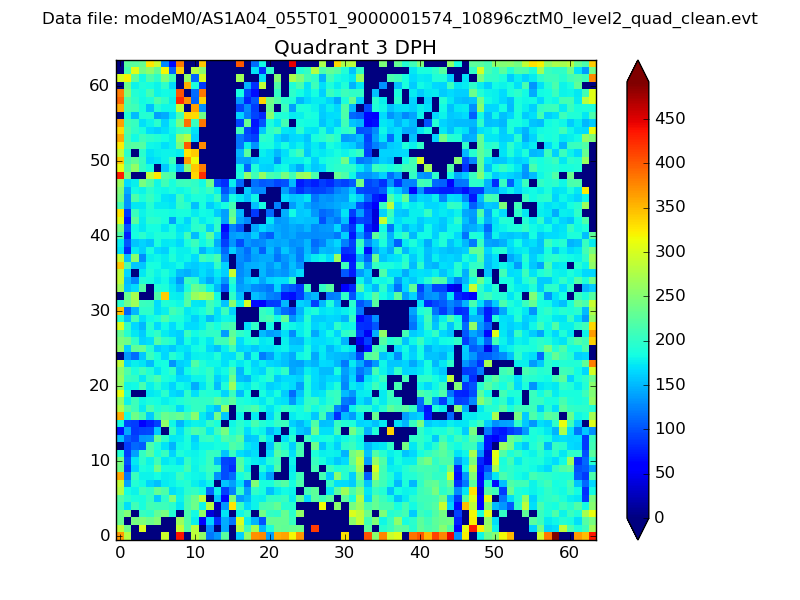 |
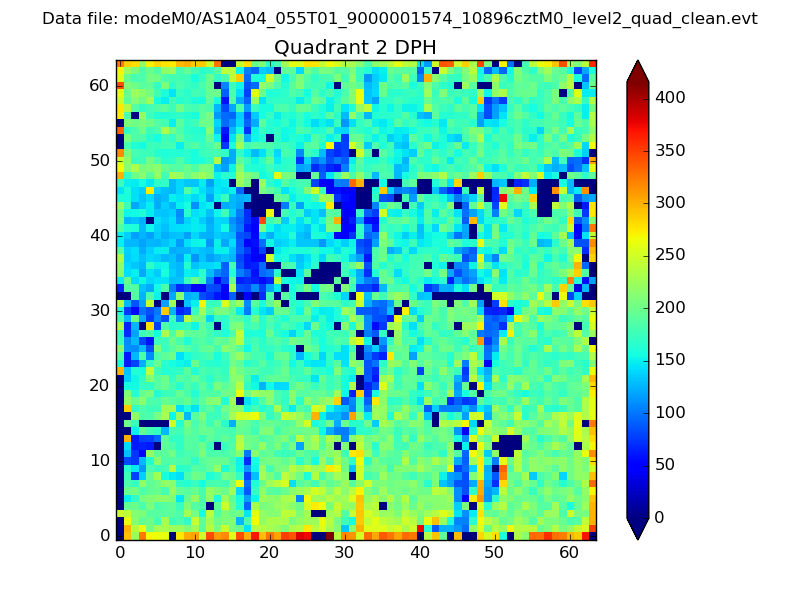 |
Quadrant C |
| Plot type | Count rate plots | Images |
|---|---|---|
| Comparison with Poisson distribution Blue bars denote a histogram of data divided into 1 sec bins. Red curve is a Poisson curve with rate = median count rate of data. |
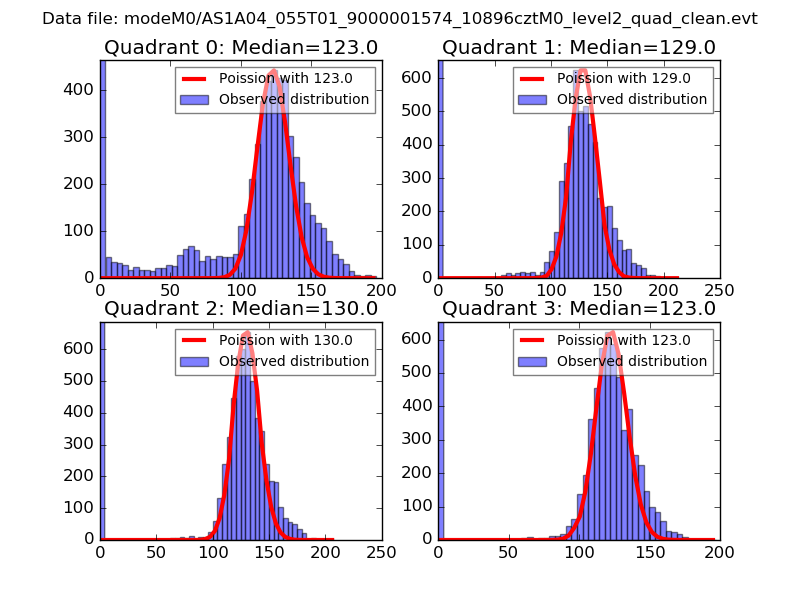 |
 |
| Quadrant-wise count rates Data is divided into 100 sec bins |
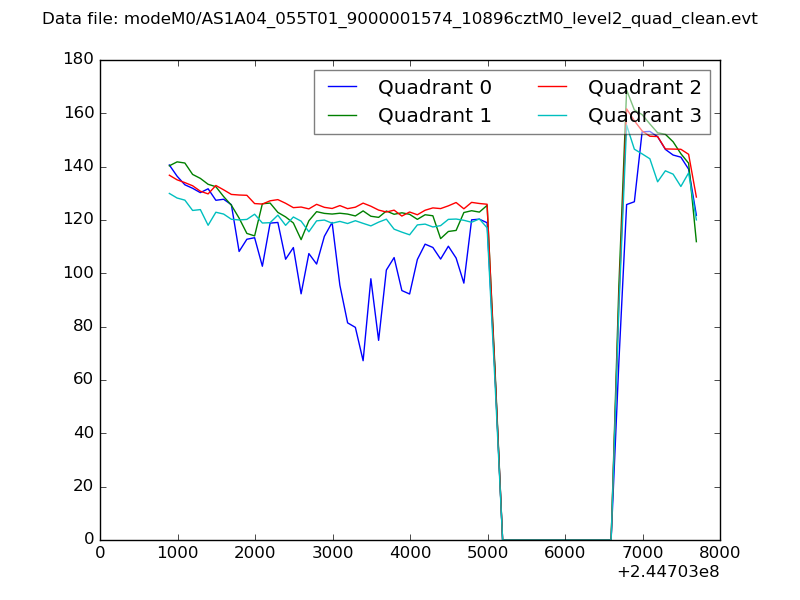 |
|
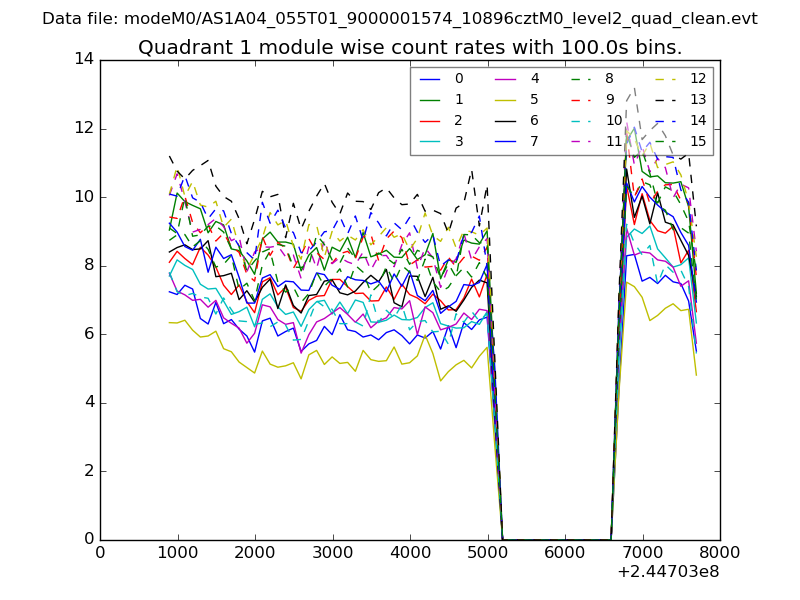
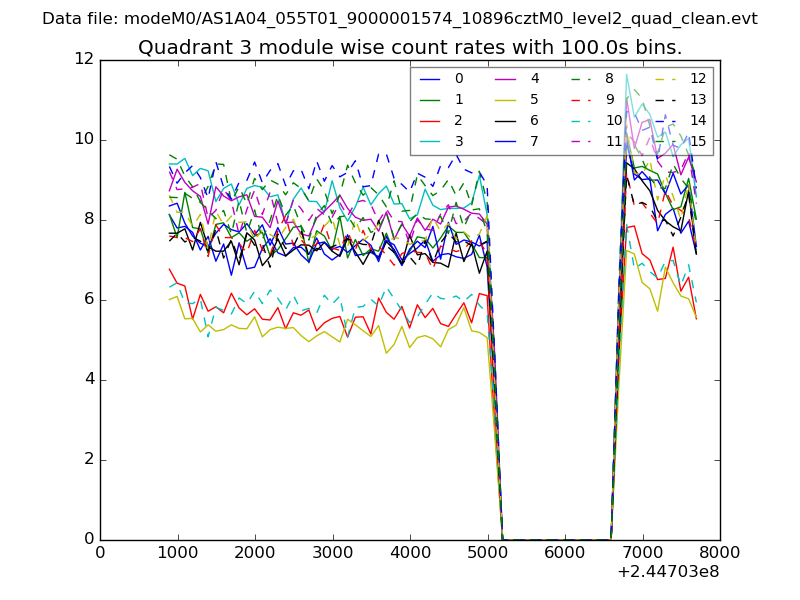
| Module-wise count rates for Quadrant A Data is divided into 100 sec bins |
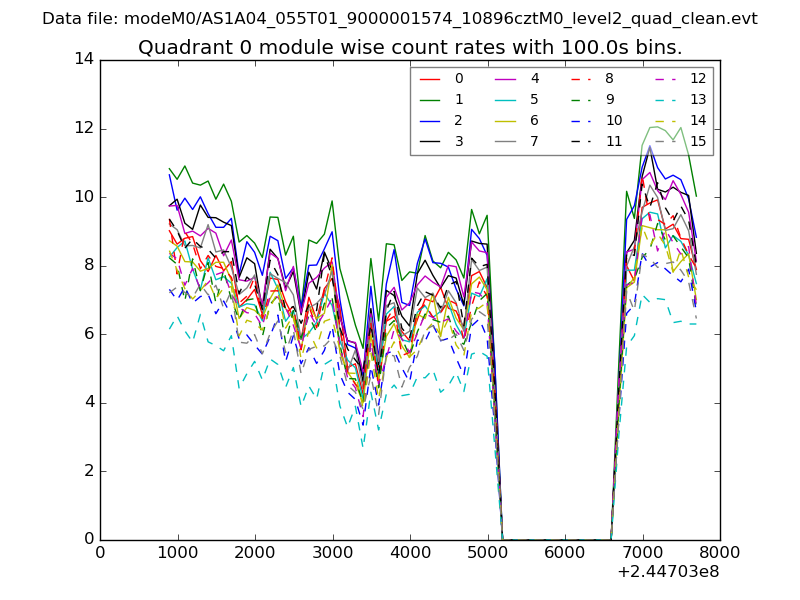 |
 |
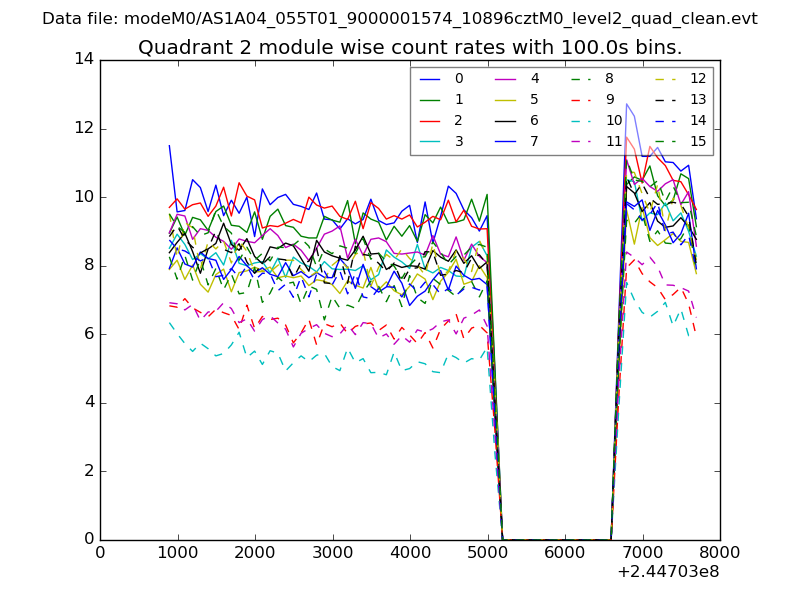
| Module-wise count rates for Quadrant B Data is divided into 100 sec bins |
 |
 |
| Module-wise count rates for Quadrant C Data is divided into 100 sec bins |
 |
 |
| Module-wise count rates for Quadrant D Data is divided into 100 sec bins |
 |
 |
| Parameter | Plot |
|---|---|
| CZT HV Monitor | 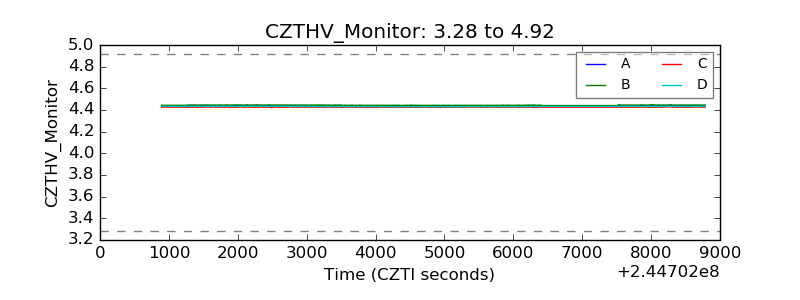 |
| D_VDD | 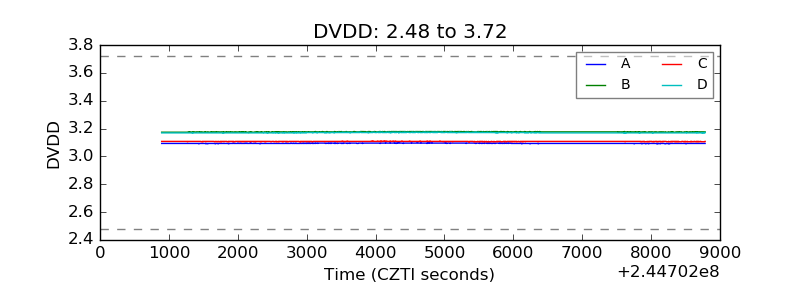 |
| Temperature 1 | 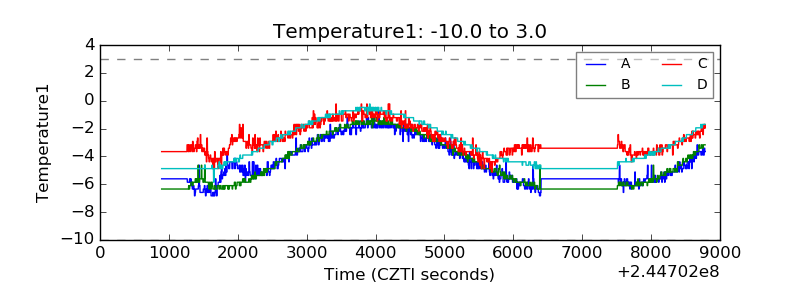 |
| Veto HV Monitor | 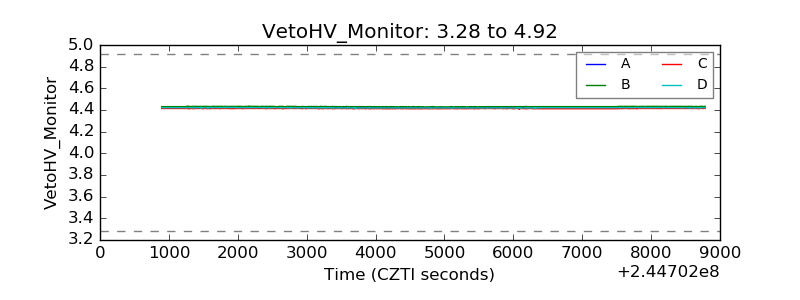 |
| Veto LLD | 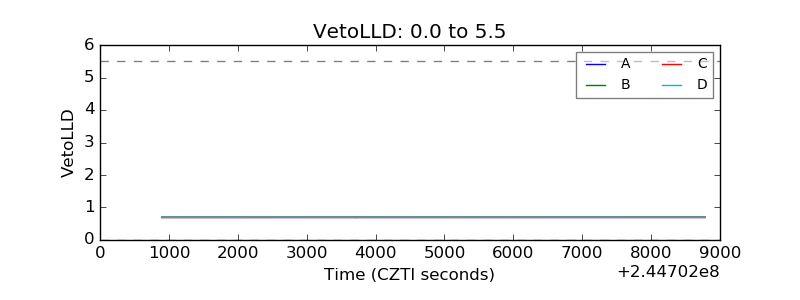 |
| Alpha Counter | 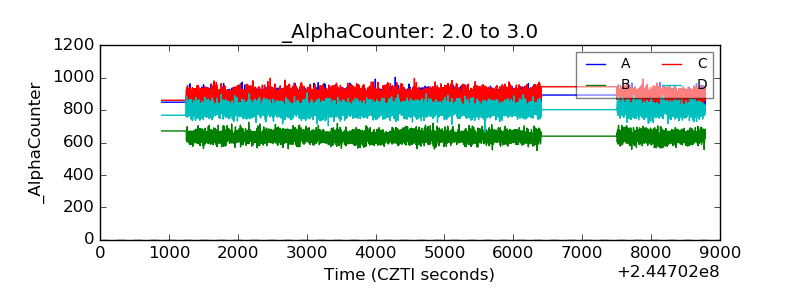 |
| _CPM_Rate | 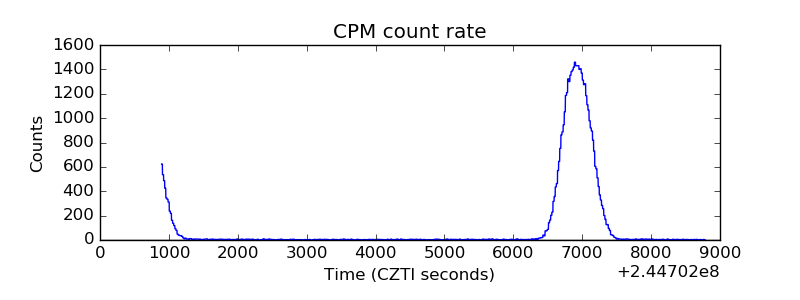 |
| CZT Counter | 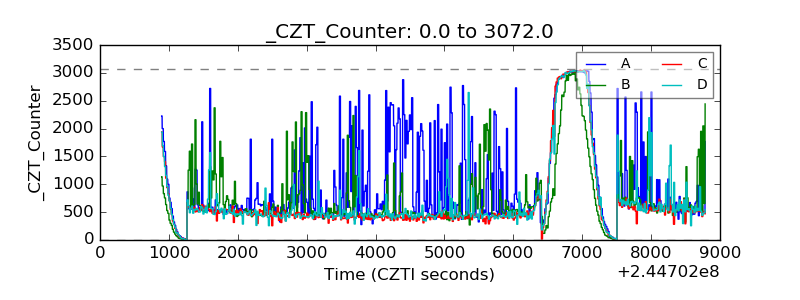 |
| +2.5 Volts monitor | 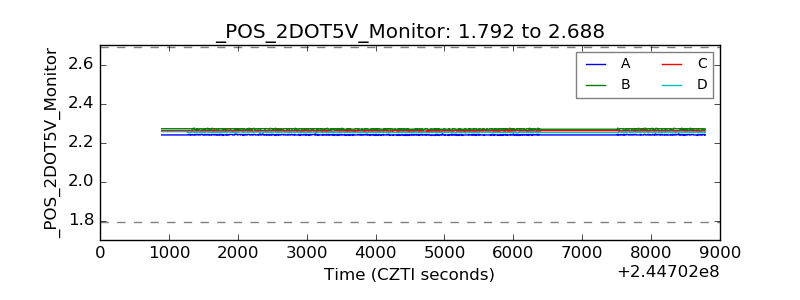 |
| +5 Volts monitor | 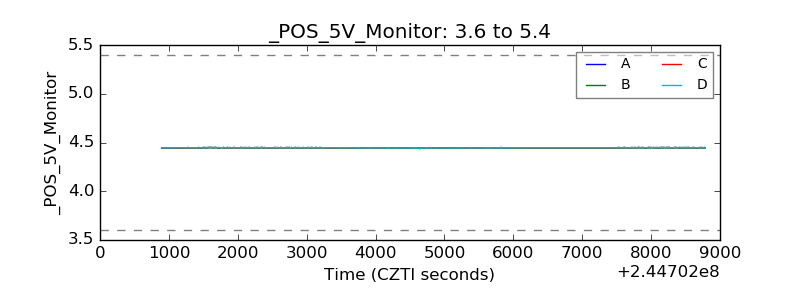 |
| _ROLL_ROT | 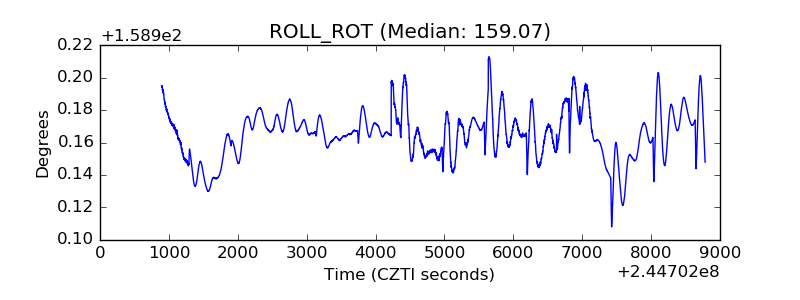 |
| _Roll_DEC | 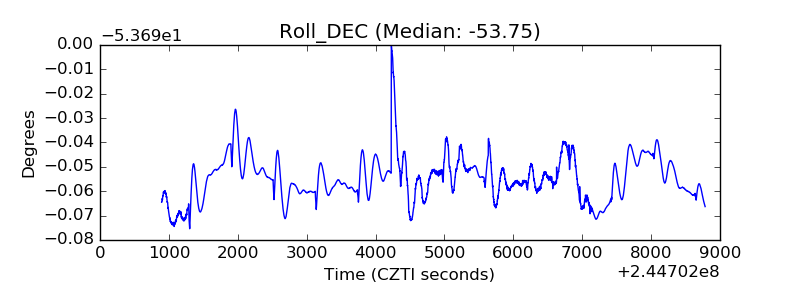 |
| _Roll_RA | 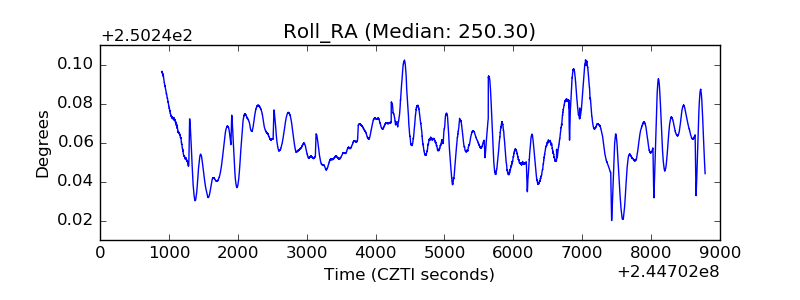 |
| Veto Counter | 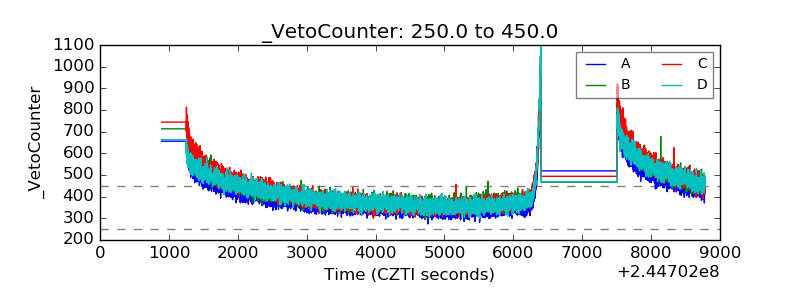 |