| Param | Original file | Final file |
|---|---|---|
| Filename | modeM0/AS1A04_055T01_9000001574_10898cztM0_level2.evt | modeM0/AS1A04_055T01_9000001574_10898cztM0_level2_quad_clean.evt |
| Size (bytes) | 268,646,400 | 53,340,480 |
| Size | 256.2 MB | 50.9 MB |
| Events in quadrant A | 2,899,250 | 324,870 |
| Events in quadrant B | 2,369,979 | 363,211 |
| Events in quadrant C | 1,288,541 | 381,403 |
| Events in quadrant D | 1,403,572 | 362,434 |
| Mode M0 | |||
|---|---|---|---|
| Quadrant | BADHDUFLAG | Total packets | Discarded packets |
| A | 0 | 10316 | 1 |
| B | 0 | 8847 | 1 |
| C | 0 | 5481 | 1 |
| D | 0 | 5779 | 1 |
| Mode M9 | |||
|---|---|---|---|
| Quadrant | BADHDUFLAG | Total packets | Discarded packets |
| A | 1 | 273359709408 | 0 |
| B | 1 | -1 | -1 |
| C | 1 | -1 | -1 |
| D | 1 | -1 | -1 |
| Mode SS | |||
|---|---|---|---|
| Quadrant | BADHDUFLAG | Total packets | Discarded packets |
| A | 0 | 50 | 0 |
| B | 0 | 50 | 0 |
| C | 0 | 50 | 0 |
| D | 0 | 50 | 0 |
| Quadrant | Total seconds | Saturated seconds | Saturation percentage |
|---|---|---|---|
| A | 2552 | 610 | 23.902821% |
| B | 2552 | 305 | 11.951411% |
| C | 2552 | 7 | 0.274295% |
| D | 2552 | 25 | 0.979624% |
Noise dominated data is calculated using 1-second bins in cleaned event files. If a bin has >2000 counts, and if more than 50% of those come from <1% of pixels, then it is considered to be noise-dominated and hence unusable.
| Quadrant | # 1 sec bins | Bins with >0 counts | Bins with >2000 counts | High rate bins dominated by noise | Noise dominated (total time) | Noise dominated (detector-on time) | Marked lightcurve |
|---|---|---|---|---|---|---|---|
| A | 2551 | 2551 | 488 | 488 | 19.13% | 19.13% | 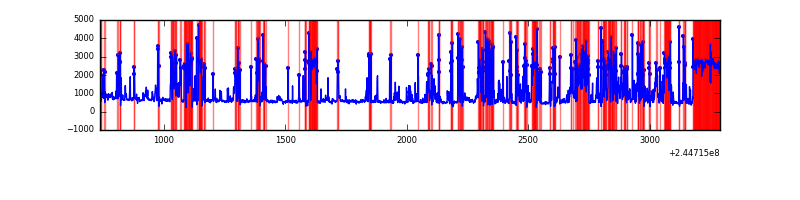 |
| B | 2552 | 2552 | 205 | 205 | 8.03% | 8.03% | 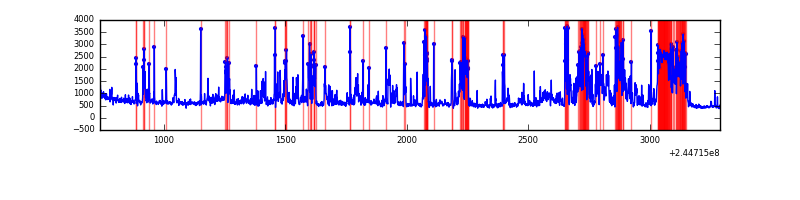 |
| C | 2552 | 2552 | 1 | 1 | 0.04% | 0.04% | 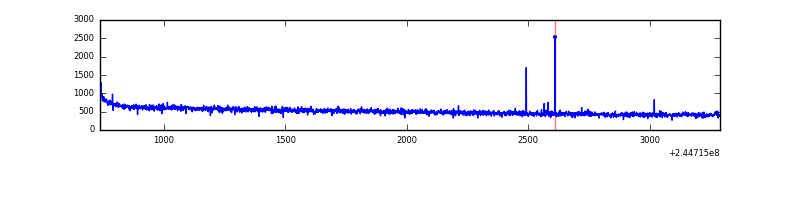 |
| D | 2552 | 2552 | 8 | 8 | 0.31% | 0.31% | 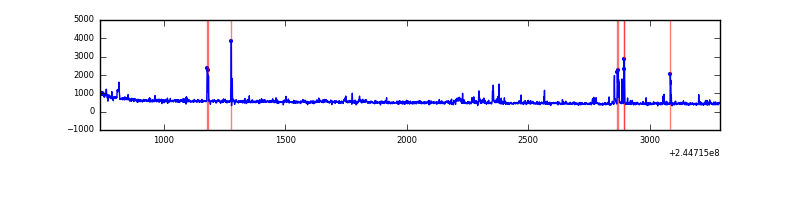 |
Top three noisy pixels from each quadrant. If the there are fewer than three noisy pixels in the level2.evt file, extra rows are filled as -1
| Pixel properties | Quadrant properties | ||||||
|---|---|---|---|---|---|---|---|
| Quadrant | DetID | PixID | Counts | Sigma | Mean | Median | Sigma |
| A | 8 | 5 | 1704097 | 27421.43 | 298 | 293 | 62.1 |
| A | 14 | 254 | 39336 | 628.37 | 298 | 293 | 62.1 |
| A | 0 | 226 | 2771 | 39.88 | 298 | 293 | 62.1 |
| B | 4 | 239 | 894999 | 14602.93 | 321 | 314 | 61.3 |
| B | 4 | 81 | 70021 | 1137.75 | 321 | 314 | 61.3 |
| B | 0 | 214 | 60204 | 977.52 | 321 | 314 | 61.3 |
| C | 14 | 234 | 6151 | 77.74 | 328 | 330 | 74.9 |
| C | 13 | 61 | 2468 | 28.55 | 328 | 330 | 74.9 |
| C | 8 | 222 | 1941 | 21.52 | 328 | 330 | 74.9 |
| D | 9 | 85 | 27065 | 336.25 | 333 | 324 | 79.5 |
| D | 7 | 71 | 26452 | 328.54 | 333 | 324 | 79.5 |
| D | 13 | 104 | 15384 | 189.37 | 333 | 324 | 79.5 |
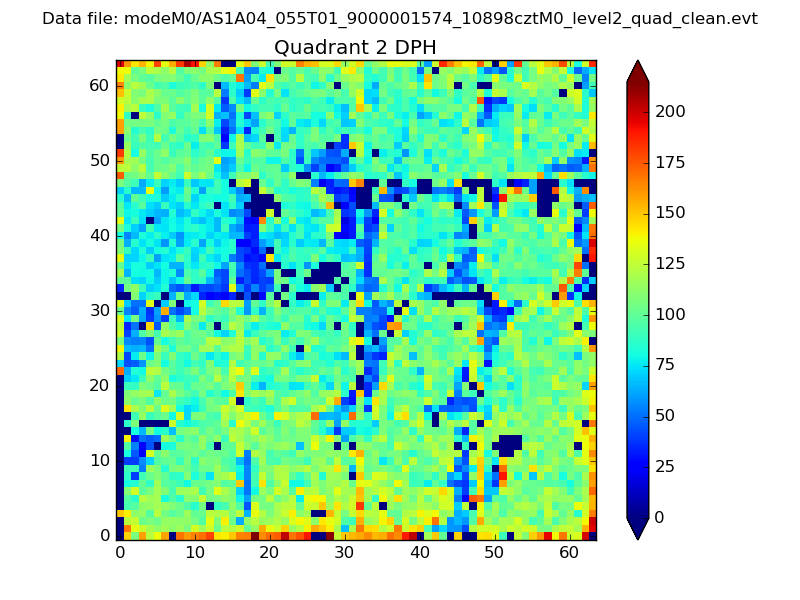
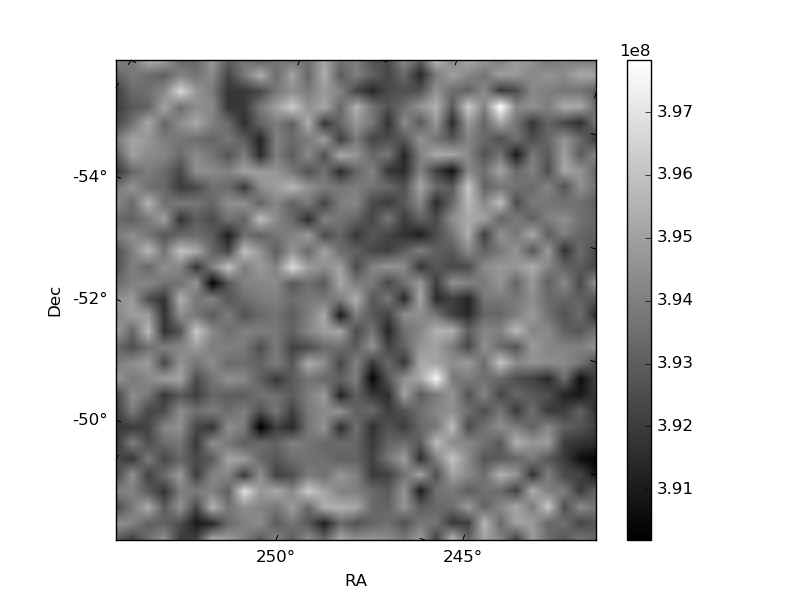
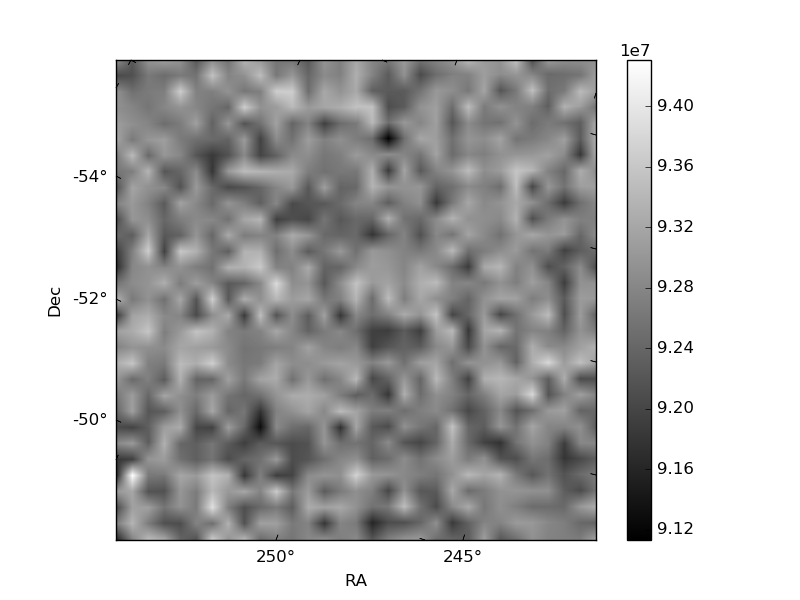
Histogram calculated using DETX and DETY for each event in the final _common_clean file
| Quadrant A | 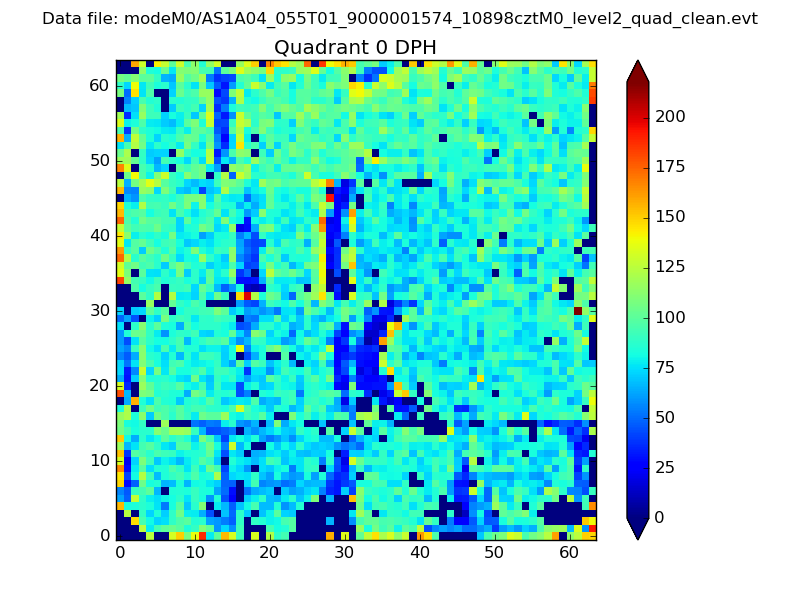 |
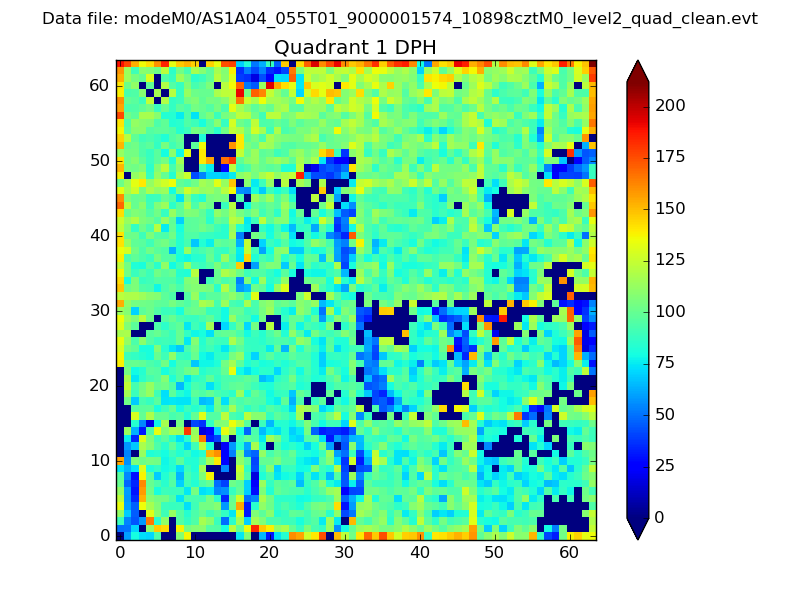 |
Quadrant B |
|---|---|---|---|
| Quadrant D | 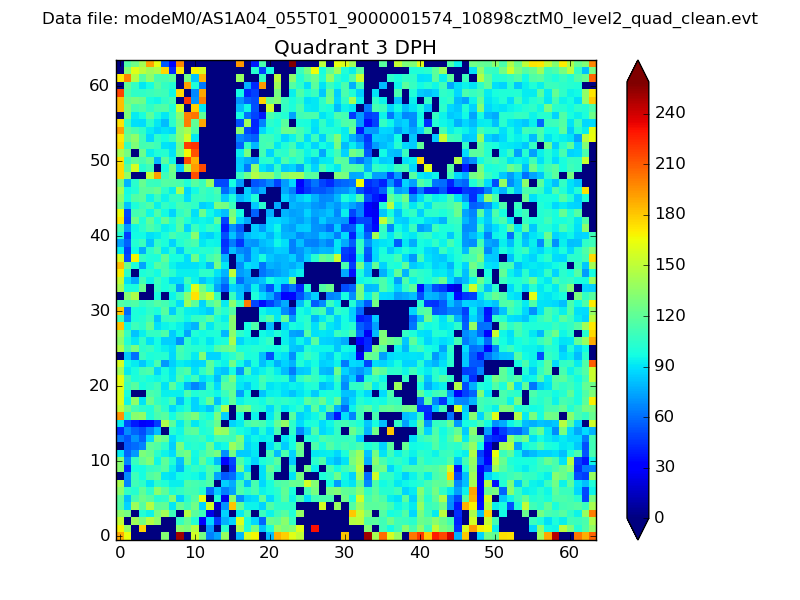 |
 |
Quadrant C |
| Plot type | Count rate plots | Images |
|---|---|---|
| Comparison with Poisson distribution Blue bars denote a histogram of data divided into 1 sec bins. Red curve is a Poisson curve with rate = median count rate of data. |
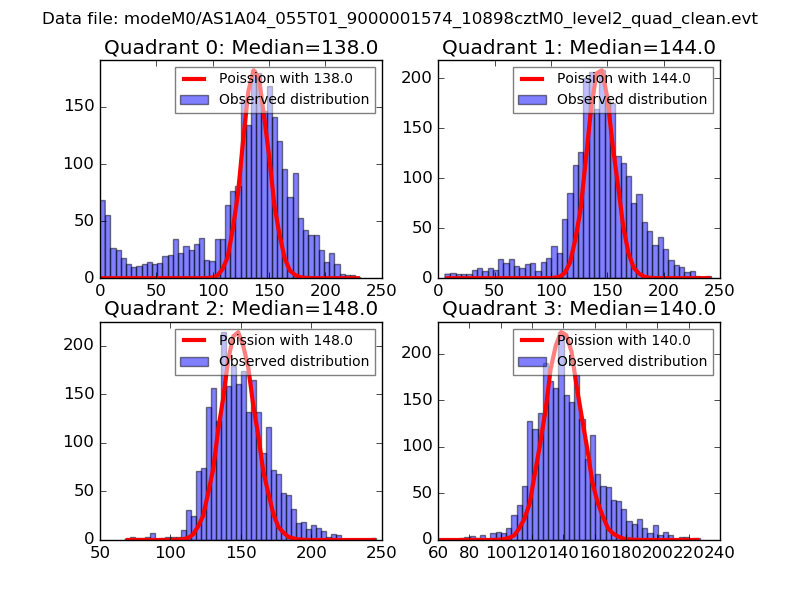 |
 |
| Quadrant-wise count rates Data is divided into 100 sec bins |
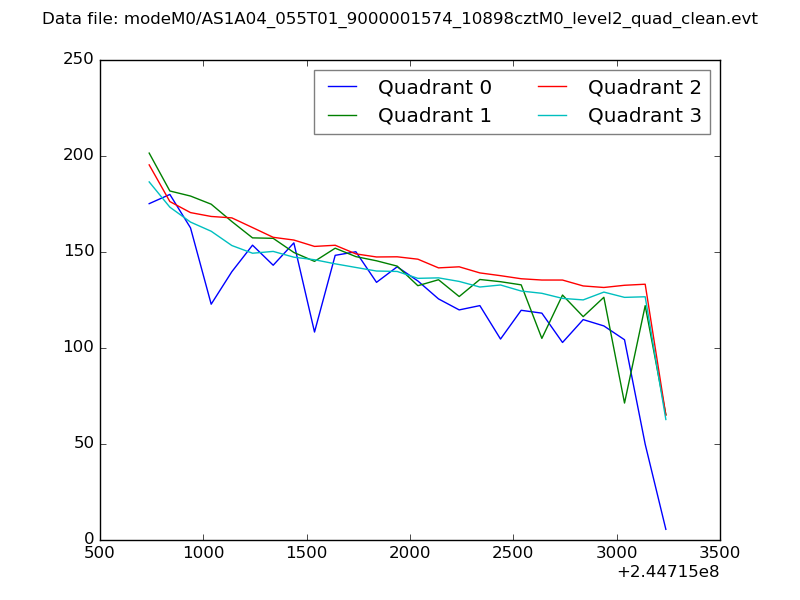 |
|
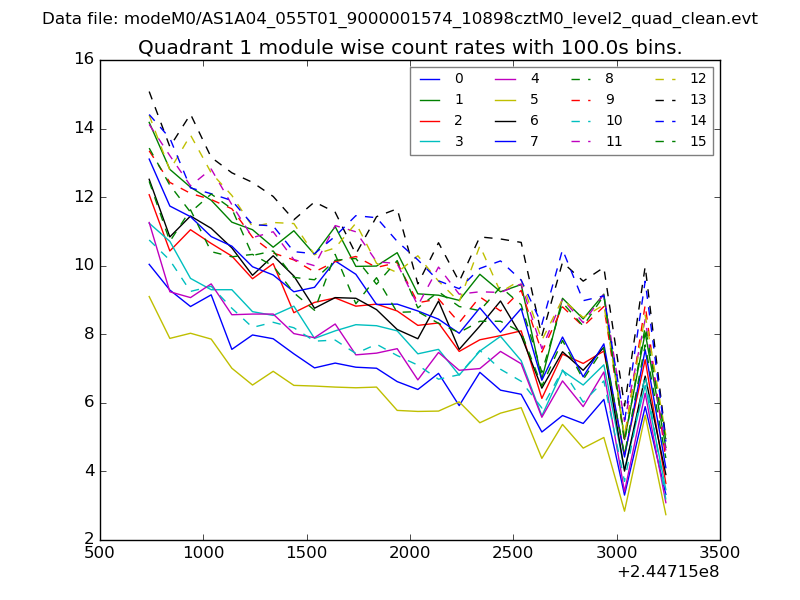
| Module-wise count rates for Quadrant A Data is divided into 100 sec bins |
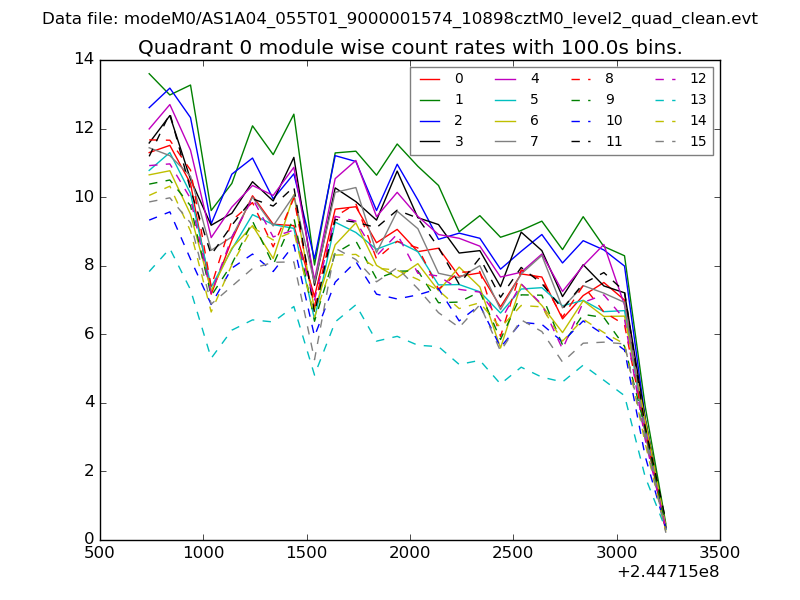 |
 |
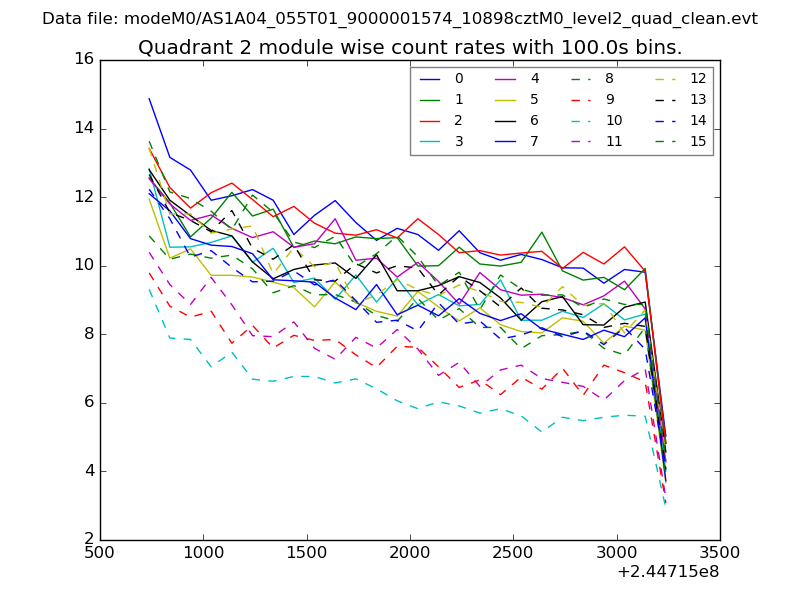
| Module-wise count rates for Quadrant B Data is divided into 100 sec bins |
 |
 |
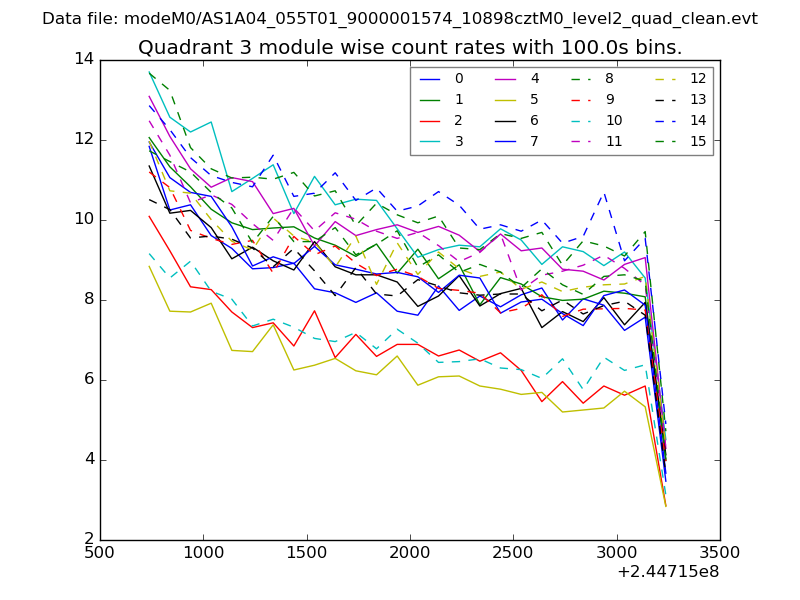
| Module-wise count rates for Quadrant C Data is divided into 100 sec bins |
 |
 |
| Module-wise count rates for Quadrant D Data is divided into 100 sec bins |
 |
 |
| Parameter | Plot |
|---|---|
| CZT HV Monitor | 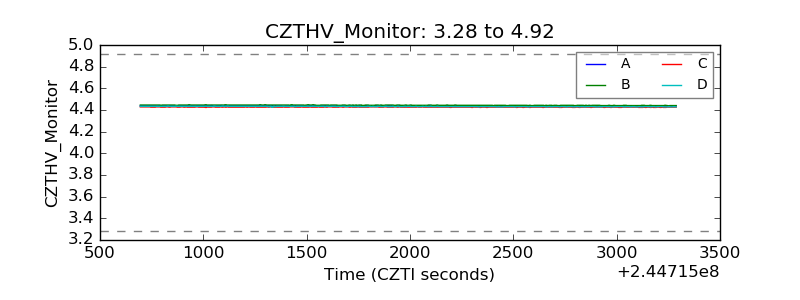 |
| D_VDD |  |
| Temperature 1 | 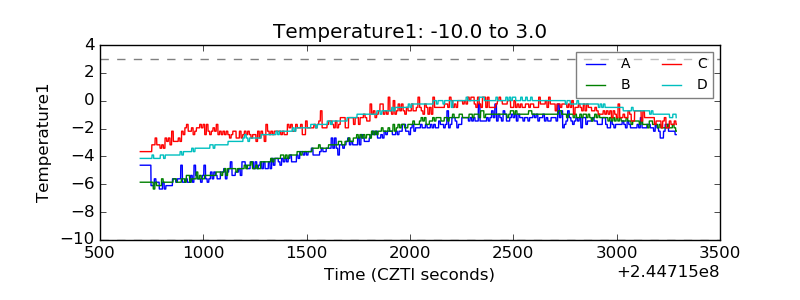 |
| Veto HV Monitor | 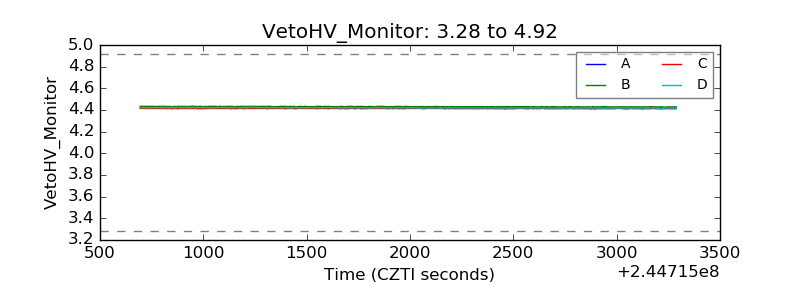 |
| Veto LLD | 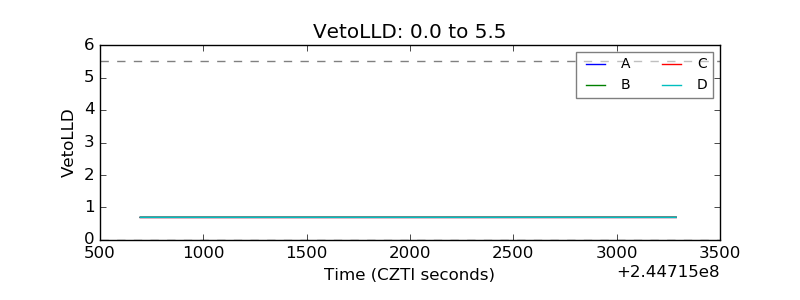 |
| Alpha Counter | 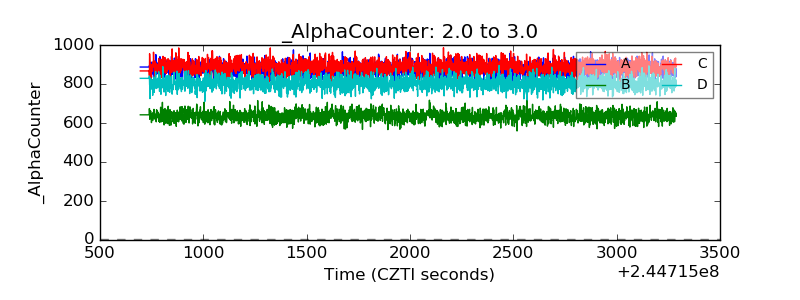 |
| _CPM_Rate | 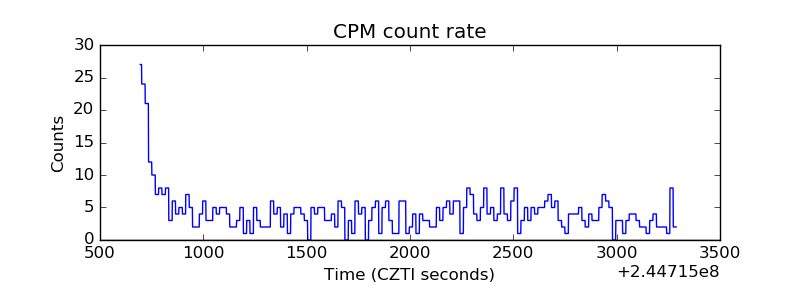 |
| CZT Counter | 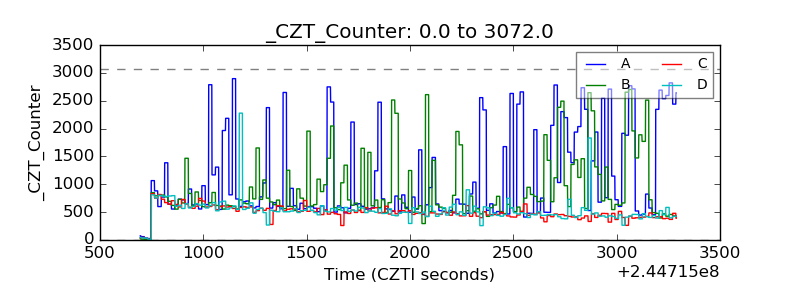 |
| +2.5 Volts monitor |  |
| +5 Volts monitor |  |
| _ROLL_ROT | 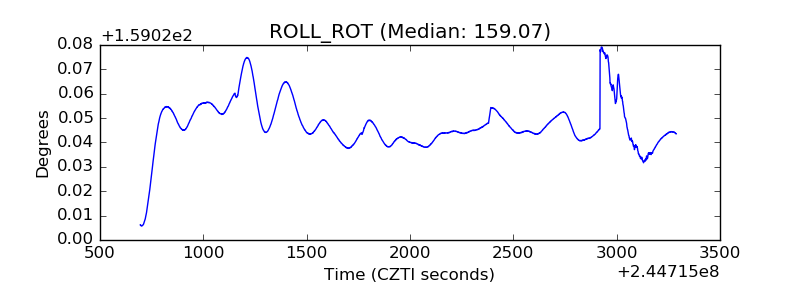 |
| _Roll_DEC | 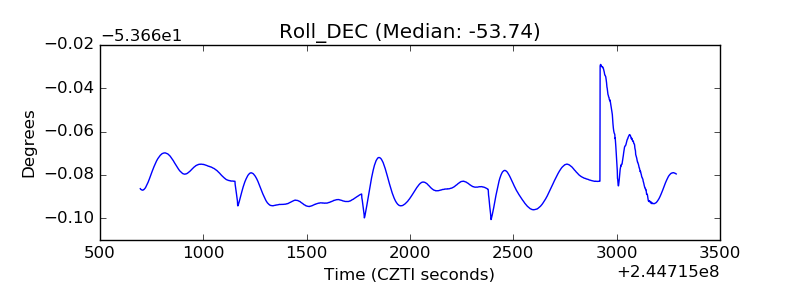 |
| _Roll_RA | 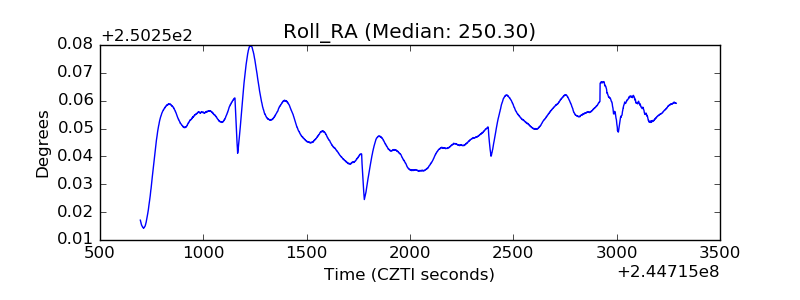 |
| Veto Counter | 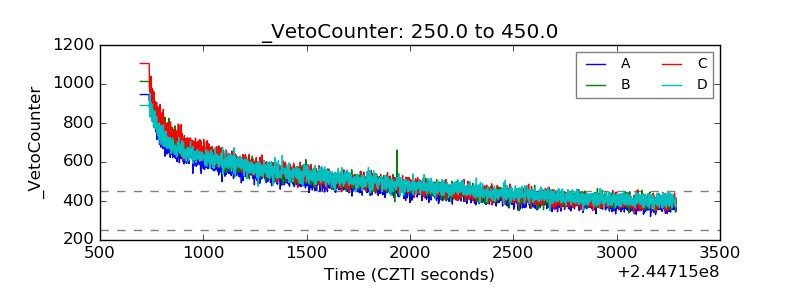 |