| Param | Original file | Final file |
|---|---|---|
| Filename | modeM0/AS1A04_055T02_9000001576cztM0_level2.fits | modeM0/AS1A04_055T02_9000001576cztM0_level2_quad_clean.evt |
| Size (bytes) | 843,744,960 | 824,662,080 |
| Size | 804.7 MB | 786.5 MB |
| Events in quadrant A | 5,037,360 | 4,862,356 |
| Events in quadrant B | 4,872,572 | 4,841,357 |
| Events in quadrant C | 5,127,862 | 4,881,079 |
| Events in quadrant D | 4,347,822 | 4,228,551 |
| Mode M9 | |||
|---|---|---|---|
| Quadrant | BADHDUFLAG | Total packets | Discarded packets |
| A | 0 | 155 | 0 |
| B | 0 | 155 | 0 |
| C | 0 | 155 | 0 |
| D | 0 | 155 | 0 |
| Mode SS | |||
|---|---|---|---|
| Quadrant | BADHDUFLAG | Total packets | Discarded packets |
| A | 0 | 1832 | 0 |
| B | 0 | 1832 | 0 |
| C | 0 | 1832 | 0 |
| D | 0 | 1832 | 0 |
| Mode M0 | |||
|---|---|---|---|
| Quadrant | BADHDUFLAG | Total packets | Discarded packets |
| A | 0 | 249335 | 0 |
| B | 0 | 249006 | 0 |
| C | 0 | 185013 | 0 |
| D | 0 | 234407 | 0 |
| Quadrant | Total seconds | Saturated seconds | Saturation percentage |
|---|---|---|---|
| A | 89874 | 6181 | 6.877406% |
| B | 89875 | 6221 | 6.921836% |
| C | 89875 | 658 | 0.732128% |
| D | 89874 | 4527 | 5.037052% |
Noise dominated data is calculated using 1-second bins in cleaned event files. If a bin has >2000 counts, and if more than 50% of those come from <1% of pixels, then it is considered to be noise-dominated and hence unusable.
| Quadrant | # 1 sec bins | Bins with >0 counts | Bins with >2000 counts | High rate bins dominated by noise | Noise dominated (total time) | Noise dominated (detector-on time) | Marked lightcurve |
|---|---|---|---|---|---|---|---|
| A | 105410 | 89785 | 0 | 0 | 0.00% | 0.00% | 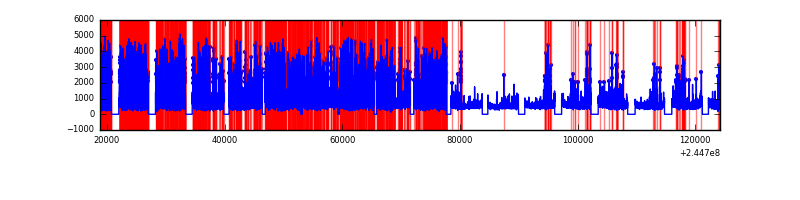 |
| B | 105410 | 89859 | 0 | 0 | 0.00% | 0.00% |  |
| C | 105410 | 89872 | 0 | 0 | 0.00% | 0.00% |  |
| D | 105410 | 89798 | 0 | 0 | 0.00% | 0.00% |  |
Top three noisy pixels from each quadrant. If the there are fewer than three noisy pixels in the level2.evt file, extra rows are filled as -1
| Pixel properties | Quadrant properties | ||||||
|---|---|---|---|---|---|---|---|
| Quadrant | DetID | PixID | Counts | Sigma | Mean | Median | Sigma |
| A | 0 | 29 | 4813 | 10.96 | 1315 | 1236 | 326.4 |
| A | 7 | 110 | 4198 | 9.08 | 1315 | 1236 | 326.4 |
| A | 0 | 30 | 3813 | 7.9 | 1315 | 1236 | 326.4 |
| B | 2 | 9 | 4154 | 11.63 | 1288 | 1231 | 251.4 |
| B | 3 | 17 | 3232 | 7.96 | 1288 | 1231 | 251.4 |
| B | 14 | 254 | 3229 | 7.95 | 1288 | 1231 | 251.4 |
| C | 1 | 81 | 3824 | 7.31 | 1353 | 1257 | 350.9 |
| C | 1 | 80 | 3766 | 7.15 | 1353 | 1257 | 350.9 |
| C | 12 | 241 | 3553 | 6.54 | 1353 | 1257 | 350.9 |
| D | 6 | 231 | 3172 | 6.16 | 1243 | 1127 | 331.7 |
| D | 3 | 14 | 3171 | 6.16 | 1243 | 1127 | 331.7 |
| D | 7 | 5 | 3119 | 6.0 | 1243 | 1127 | 331.7 |
Histogram calculated using DETX and DETY for each event in the final _common_clean file
| Quadrant A |  |
 |
Quadrant B |
|---|---|---|---|
| Quadrant D |  |
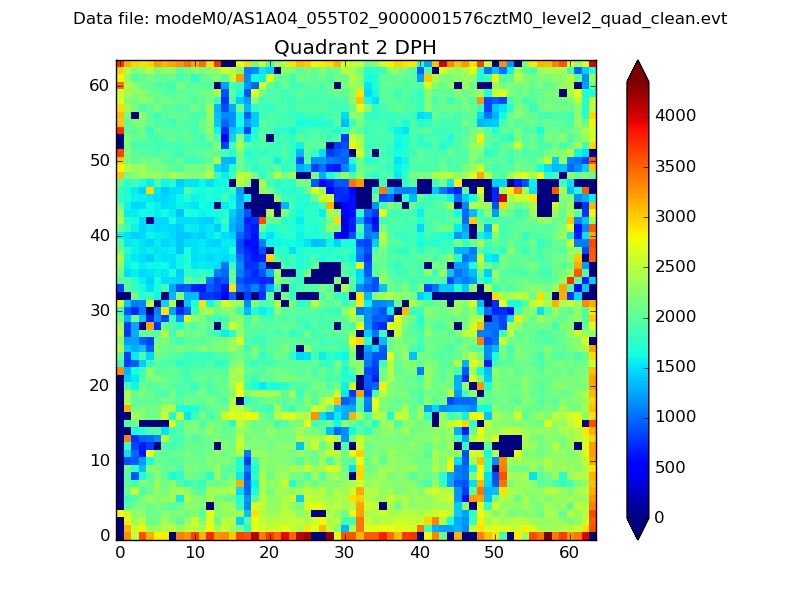 |
Quadrant C |
| Plot type | Count rate plots | Images |
|---|---|---|
| Comparison with Poisson distribution Blue bars denote a histogram of data divided into 1 sec bins. Red curve is a Poisson curve with rate = median count rate of data. |
 |
 |
| Quadrant-wise count rates Data is divided into 100 sec bins |
 |
|
| Module-wise count rates for Quadrant A Data is divided into 100 sec bins |
 |
 |
| Module-wise count rates for Quadrant B Data is divided into 100 sec bins |
 |
 |
| Module-wise count rates for Quadrant C Data is divided into 100 sec bins |
 |
 |
| Module-wise count rates for Quadrant D Data is divided into 100 sec bins |
 |
 |
| Parameter | Plot |
|---|---|
| CZT HV Monitor |  |
| D_VDD | 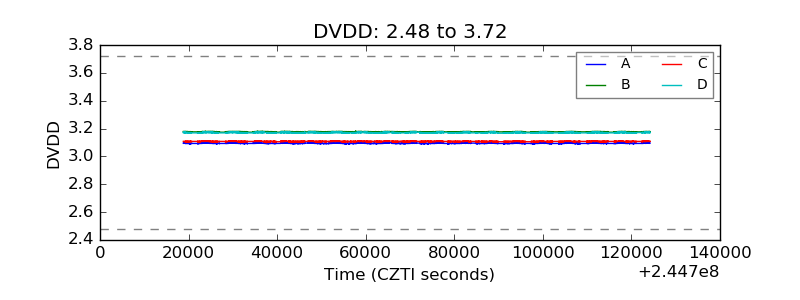 |
| Temperature 1 | 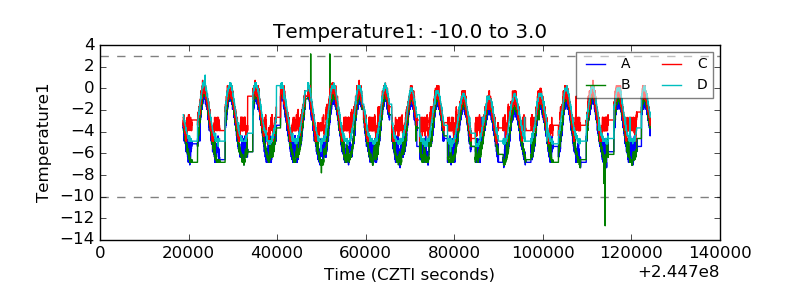 |
| Veto HV Monitor |  |
| Veto LLD |  |
| Alpha Counter | 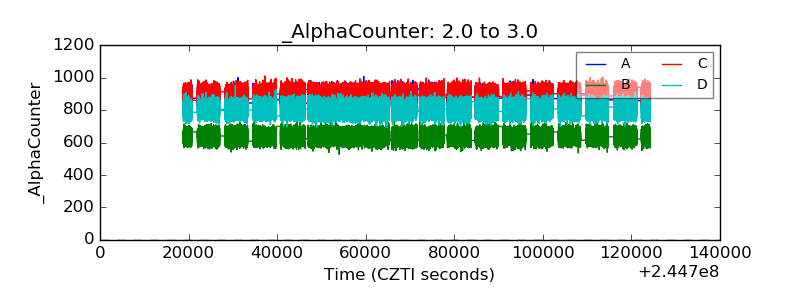 |
| _CPM_Rate |  |
| CZT Counter |  |
| +2.5 Volts monitor |  |
| +5 Volts monitor |  |
| _ROLL_ROT |  |
| _Roll_DEC |  |
| _Roll_RA |  |
| Veto Counter |  |