| Param | Original file | Final file |
|---|---|---|
| Filename | modeM0/AS1A04_055T02_9000001576_10898cztM0_level2.evt | modeM0/AS1A04_055T02_9000001576_10898cztM0_level2_quad_clean.evt |
| Size (bytes) | 321,431,040 | 50,074,560 |
| Size | 306.5 MB | 47.8 MB |
| Events in quadrant A | 3,461,184 | 302,159 |
| Events in quadrant B | 2,423,240 | 334,761 |
| Events in quadrant C | 1,608,476 | 333,685 |
| Events in quadrant D | 2,021,664 | 316,295 |
| Mode M9 | |||
|---|---|---|---|
| Quadrant | BADHDUFLAG | Total packets | Discarded packets |
| A | 0 | 13 | 0 |
| B | 0 | 13 | 0 |
| C | 0 | 13 | 0 |
| D | 0 | 13 | 0 |
| Mode SS | |||
|---|---|---|---|
| Quadrant | BADHDUFLAG | Total packets | Discarded packets |
| A | 0 | 66 | 0 |
| B | 0 | 66 | 0 |
| C | 0 | 66 | 0 |
| D | 0 | 66 | 0 |
| Mode M0 | |||
|---|---|---|---|
| Quadrant | BADHDUFLAG | Total packets | Discarded packets |
| A | 0 | 12502 | 2 |
| B | 0 | 9396 | 1 |
| C | 0 | 6882 | 1 |
| D | 0 | 8097 | 1 |
| Quadrant | Total seconds | Saturated seconds | Saturation percentage |
|---|---|---|---|
| A | 3223 | 745 | 23.115110% |
| B | 3223 | 241 | 7.477505% |
| C | 3223 | 64 | 1.985728% |
| D | 3223 | 126 | 3.909401% |
Noise dominated data is calculated using 1-second bins in cleaned event files. If a bin has >2000 counts, and if more than 50% of those come from <1% of pixels, then it is considered to be noise-dominated and hence unusable.
| Quadrant | # 1 sec bins | Bins with >0 counts | Bins with >2000 counts | High rate bins dominated by noise | Noise dominated (total time) | Noise dominated (detector-on time) | Marked lightcurve |
|---|---|---|---|---|---|---|---|
| A | 4488 | 3223 | 519 | 519 | 11.56% | 16.10% | 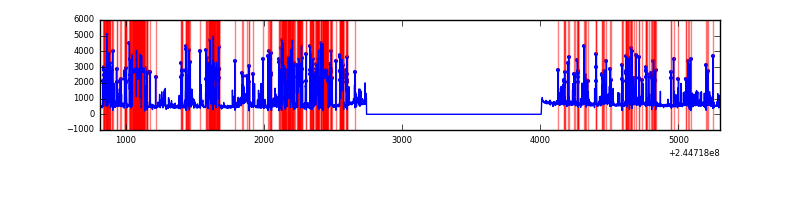 |
| B | 4488 | 3223 | 105 | 105 | 2.34% | 3.26% | 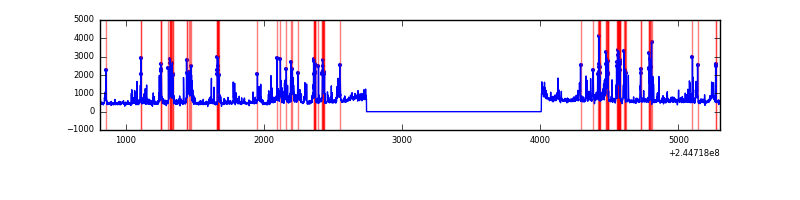 |
| C | 4488 | 3223 | 1 | 1 | 0.02% | 0.03% | 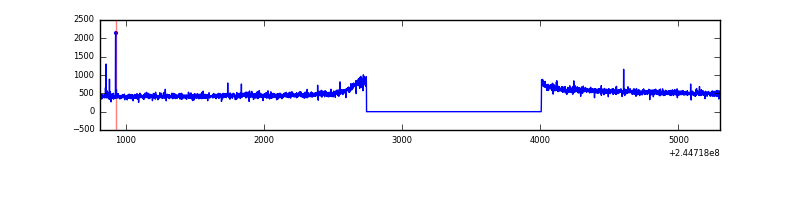 |
| D | 4488 | 3223 | 40 | 40 | 0.89% | 1.24% | 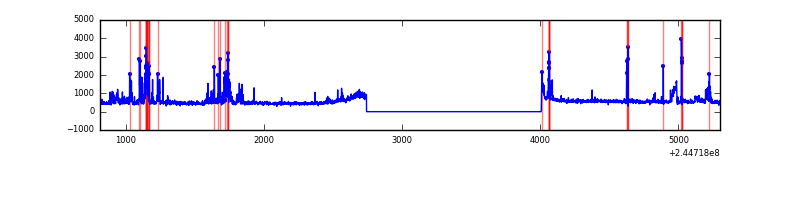 |
Top three noisy pixels from each quadrant. If the there are fewer than three noisy pixels in the level2.evt file, extra rows are filled as -1
| Pixel properties | Quadrant properties | ||||||
|---|---|---|---|---|---|---|---|
| Quadrant | DetID | PixID | Counts | Sigma | Mean | Median | Sigma |
| A | 8 | 5 | 1973287 | 24938.1 | 382 | 375 | 79.1 |
| A | 11 | 29 | 11375 | 139.04 | 382 | 375 | 79.1 |
| A | 0 | 226 | 3446 | 38.82 | 382 | 375 | 79.1 |
| B | 4 | 239 | 703235 | 8662.84 | 419 | 410 | 81.1 |
| B | 10 | 245 | 43206 | 527.49 | 419 | 410 | 81.1 |
| B | 0 | 219 | 20787 | 251.16 | 419 | 410 | 81.1 |
| C | 12 | 4 | 4263 | 40.58 | 410 | 412 | 94.9 |
| C | 14 | 234 | 4222 | 40.15 | 410 | 412 | 94.9 |
| C | 13 | 61 | 2989 | 27.16 | 410 | 412 | 94.9 |
| D | 5 | 97 | 199765 | 1992.14 | 410 | 397 | 100.1 |
| D | 13 | 152 | 76988 | 765.32 | 410 | 397 | 100.1 |
| D | 9 | 85 | 39877 | 394.5 | 410 | 397 | 100.1 |
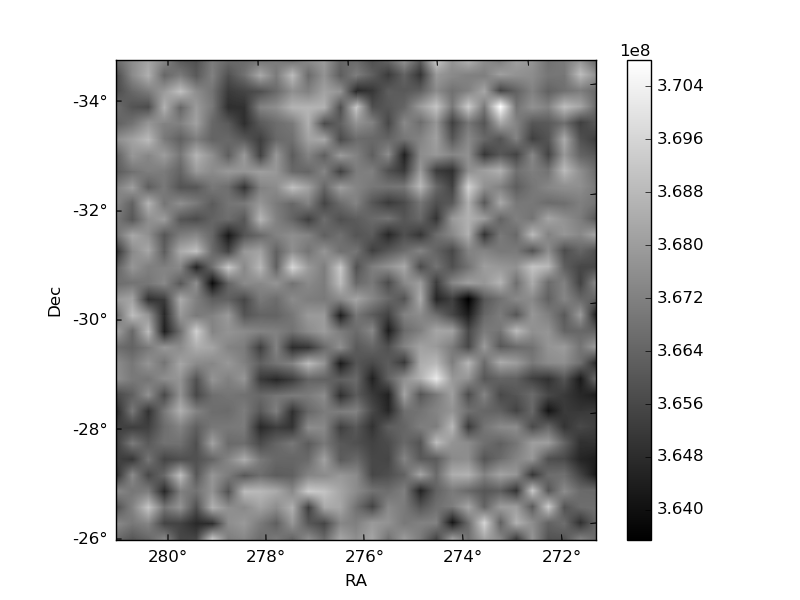
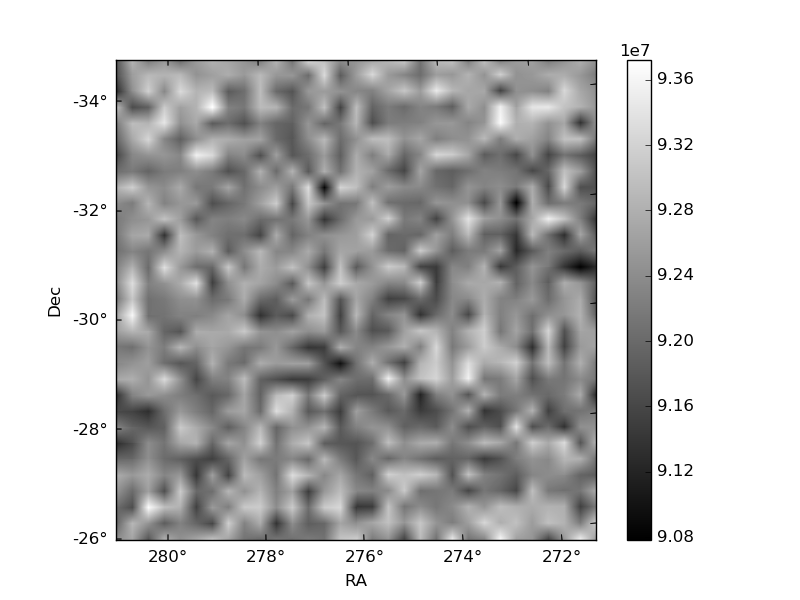
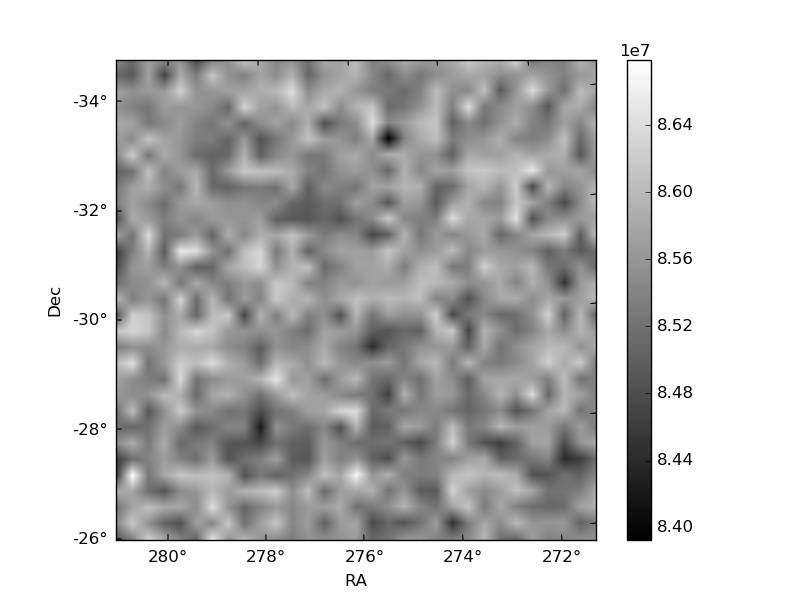
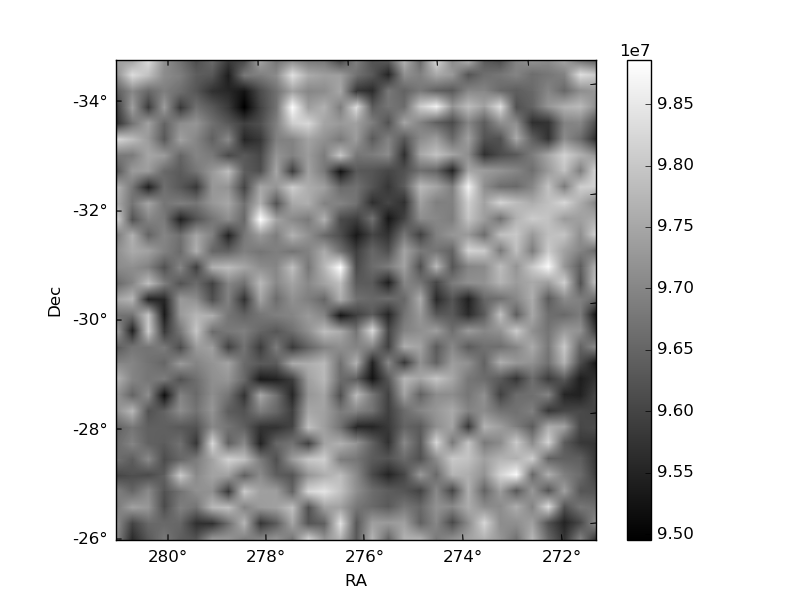
Histogram calculated using DETX and DETY for each event in the final _common_clean file
| Quadrant A | 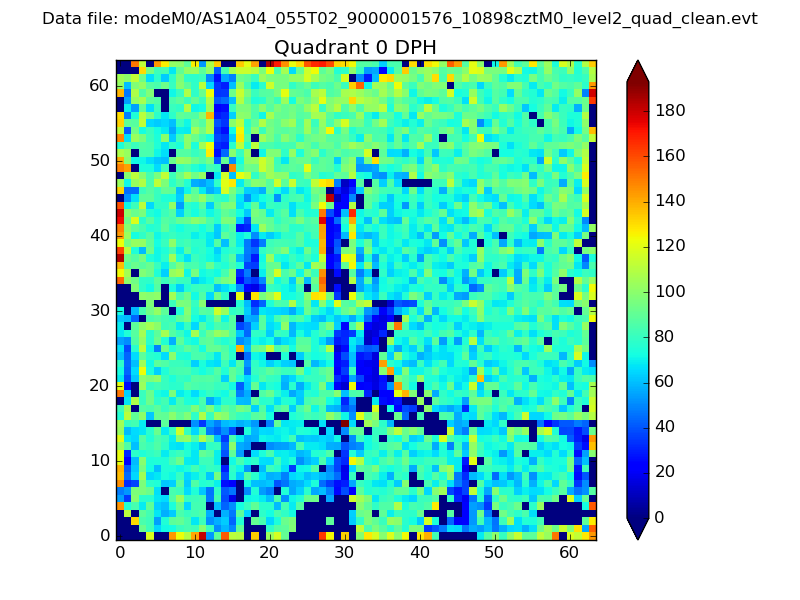 |
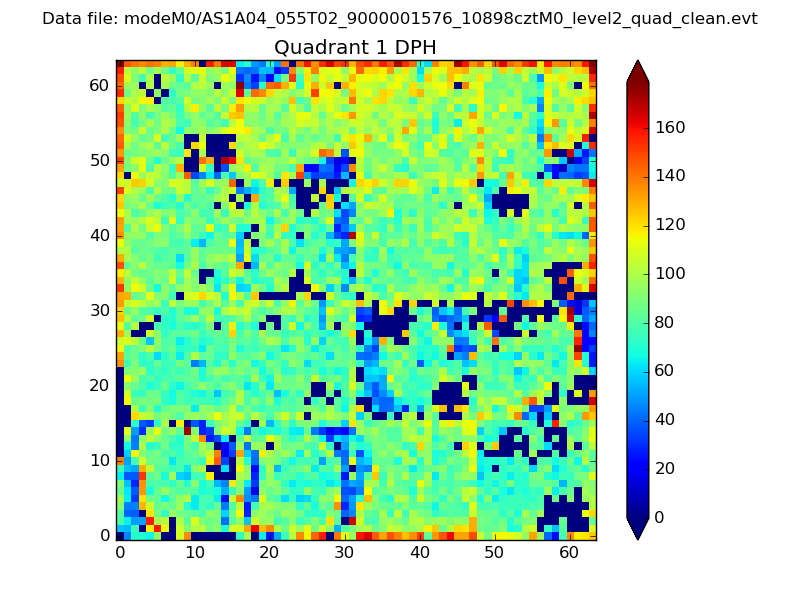 |
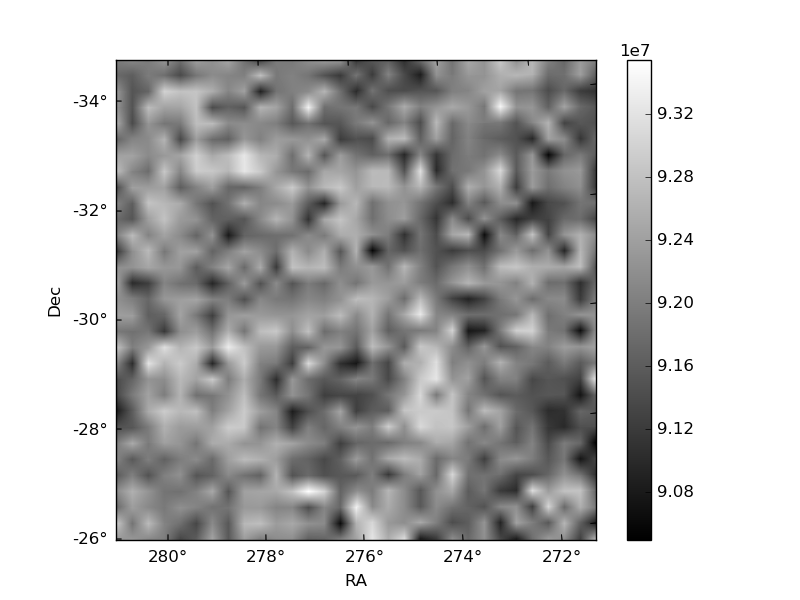
Quadrant B |
|---|---|---|---|
| Quadrant D | 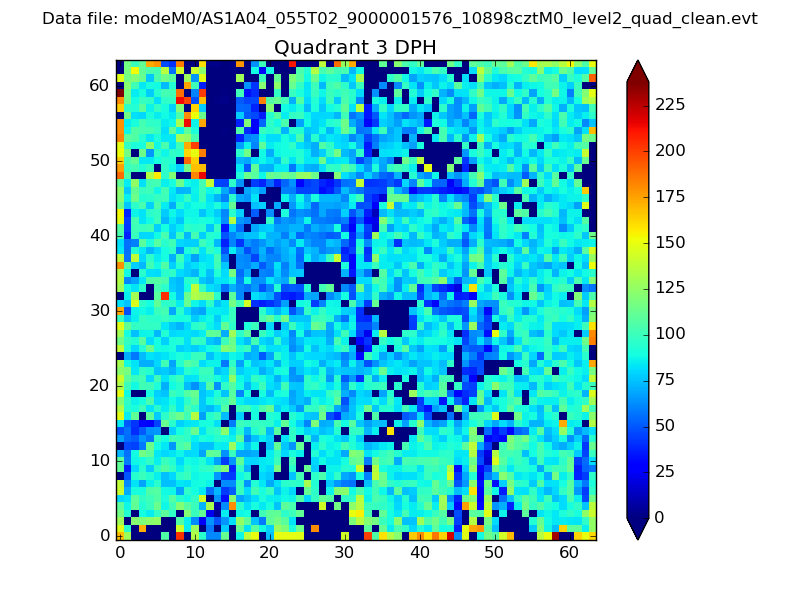 |
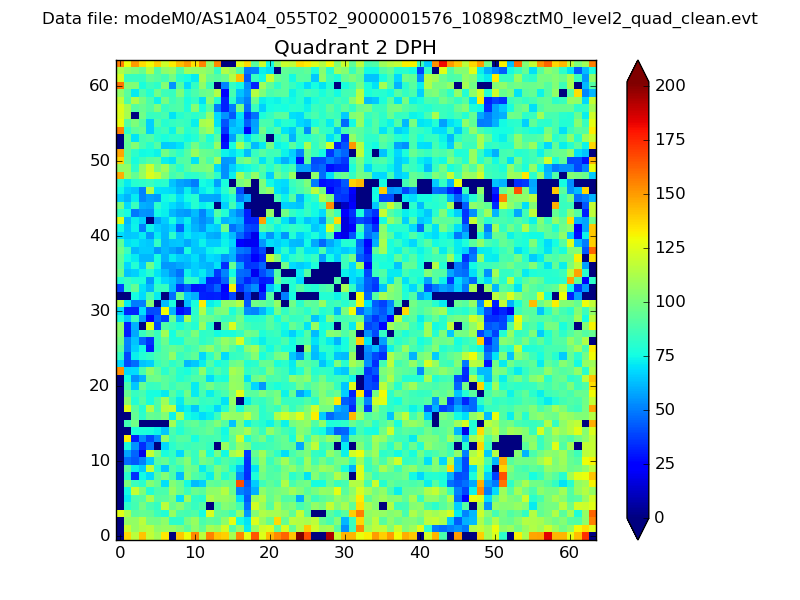 |
Quadrant C |
| Plot type | Count rate plots | Images |
|---|---|---|
| Comparison with Poisson distribution Blue bars denote a histogram of data divided into 1 sec bins. Red curve is a Poisson curve with rate = median count rate of data. |
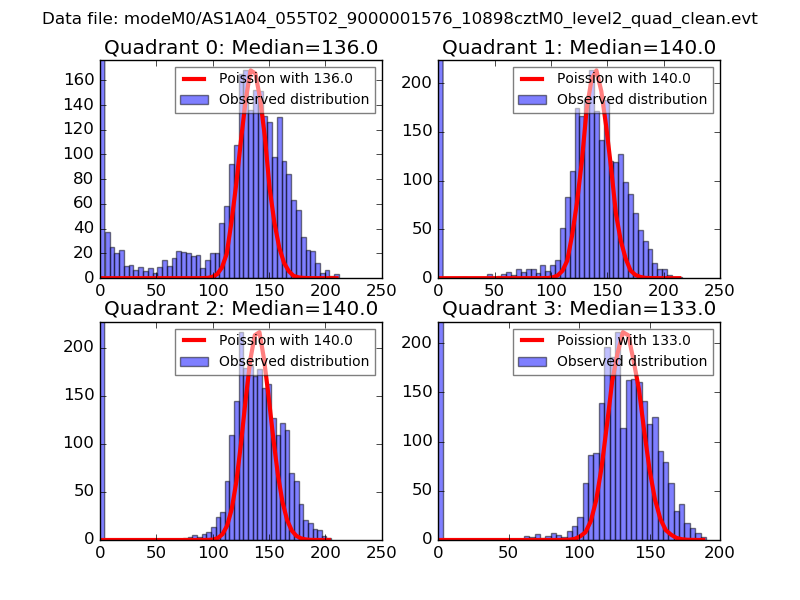 |
 |
| Quadrant-wise count rates Data is divided into 100 sec bins |
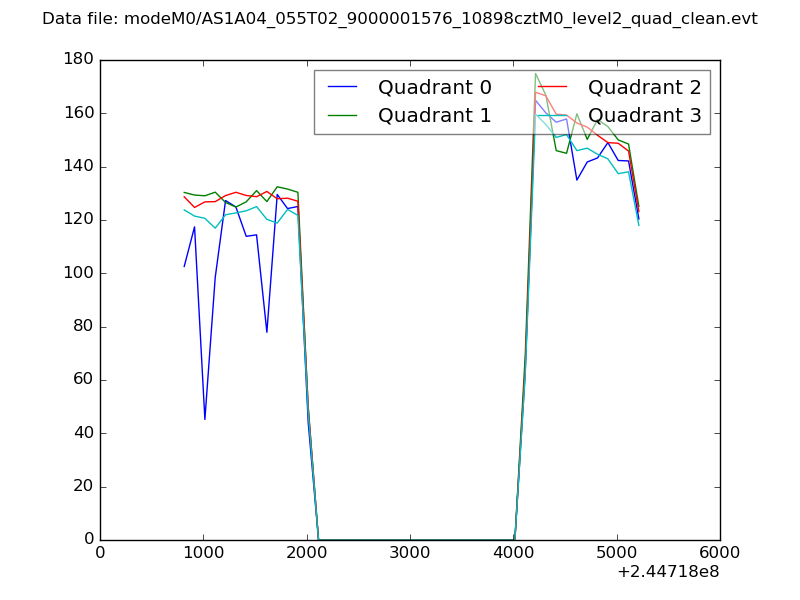 |
|
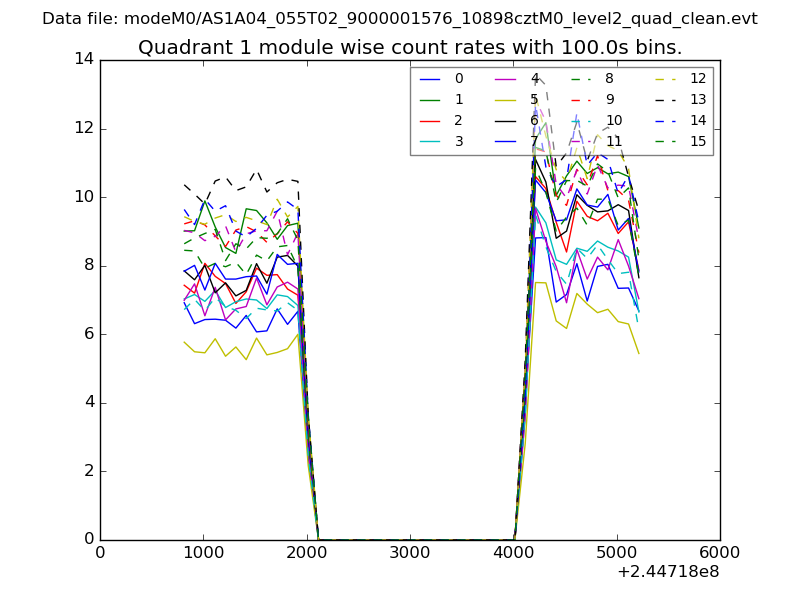
| Module-wise count rates for Quadrant A Data is divided into 100 sec bins |
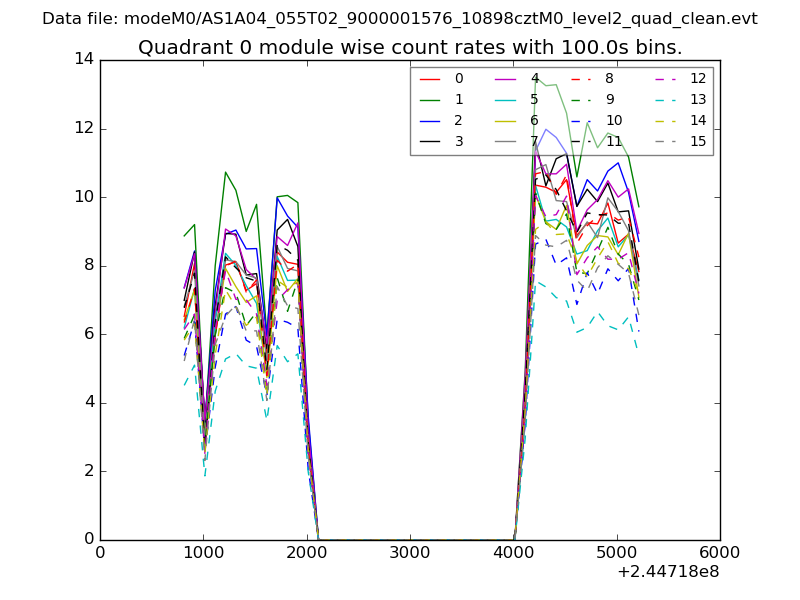 |
 |
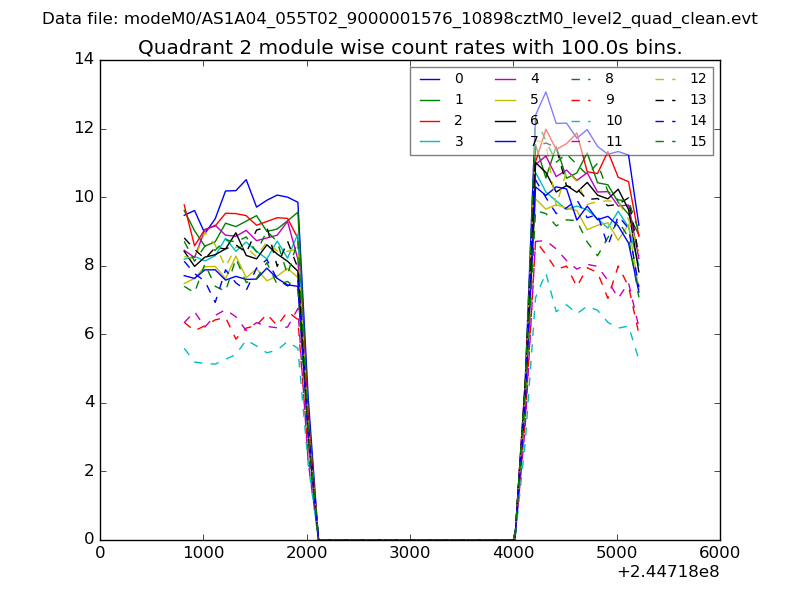
| Module-wise count rates for Quadrant B Data is divided into 100 sec bins |
 |
 |
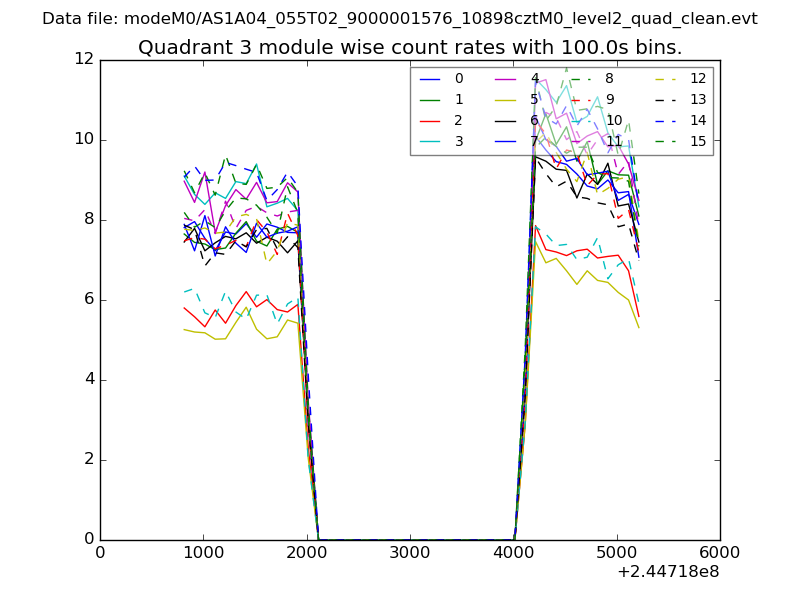
| Module-wise count rates for Quadrant C Data is divided into 100 sec bins |
 |
 |
| Module-wise count rates for Quadrant D Data is divided into 100 sec bins |
 |
 |
| Parameter | Plot |
|---|---|
| CZT HV Monitor | 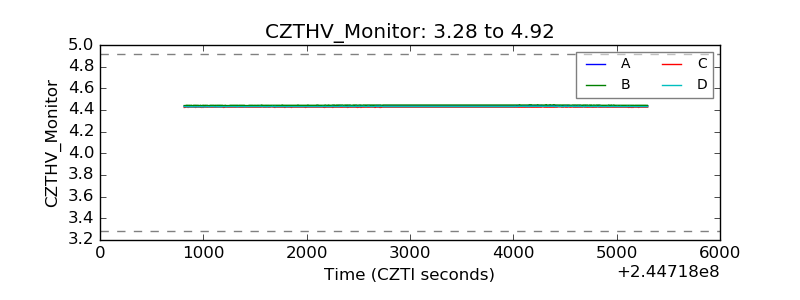 |
| D_VDD | 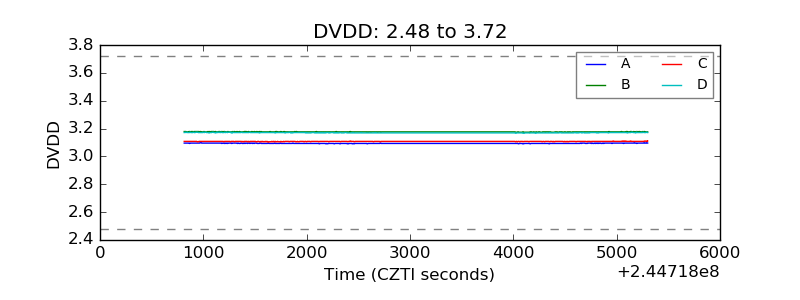 |
| Temperature 1 | 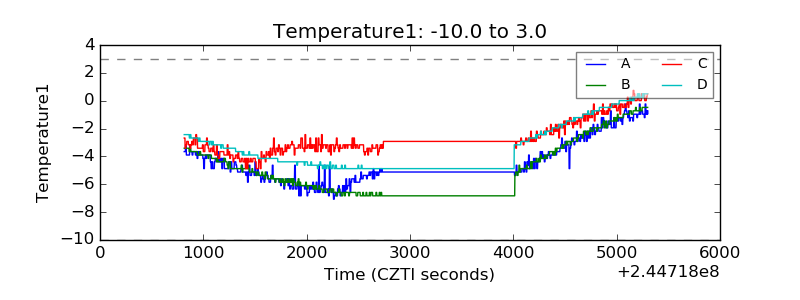 |
| Veto HV Monitor | 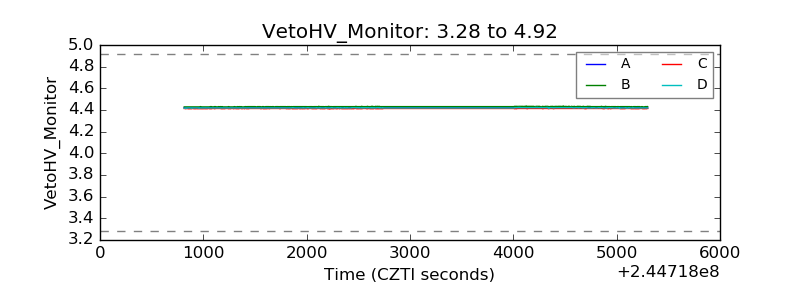 |
| Veto LLD | 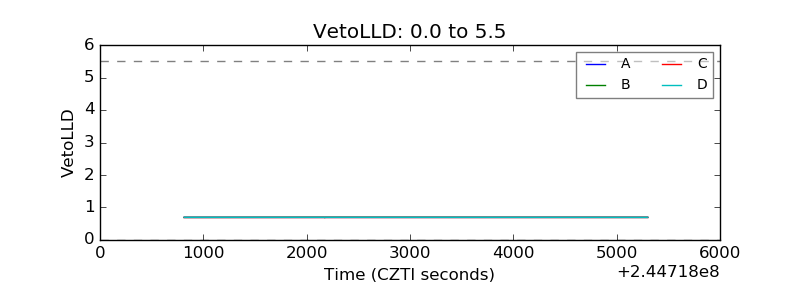 |
| Alpha Counter | 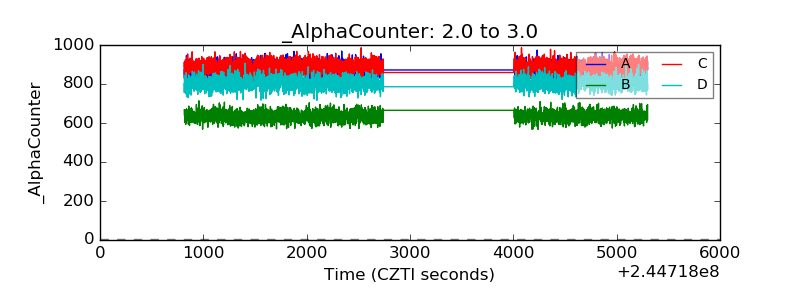 |
| _CPM_Rate | 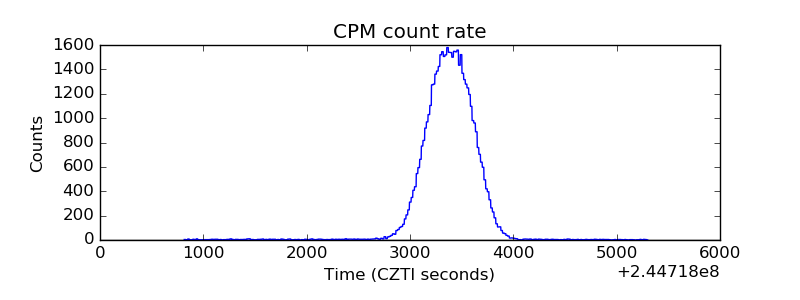 |
| CZT Counter | 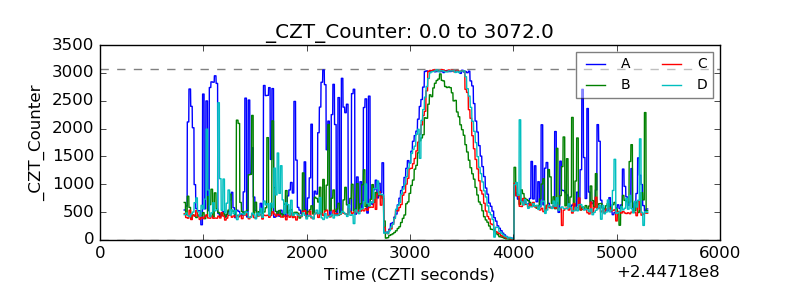 |
| +2.5 Volts monitor |  |
| +5 Volts monitor | 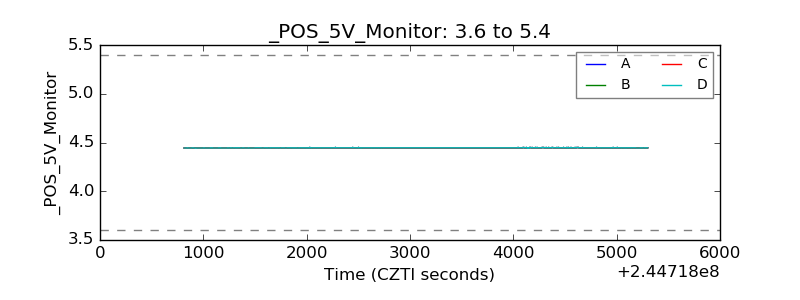 |
| _ROLL_ROT | 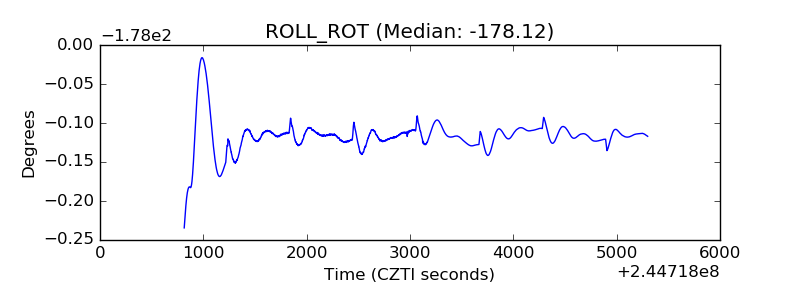 |
| _Roll_DEC | 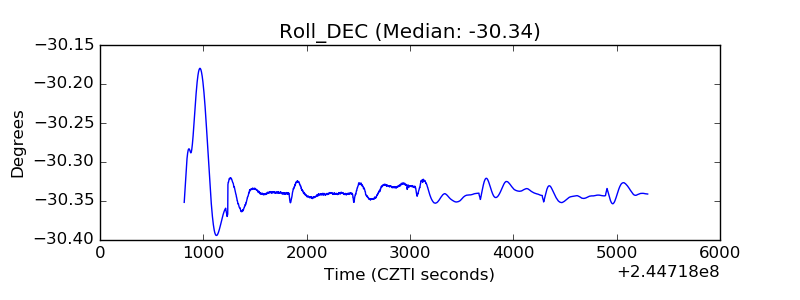 |
| _Roll_RA | 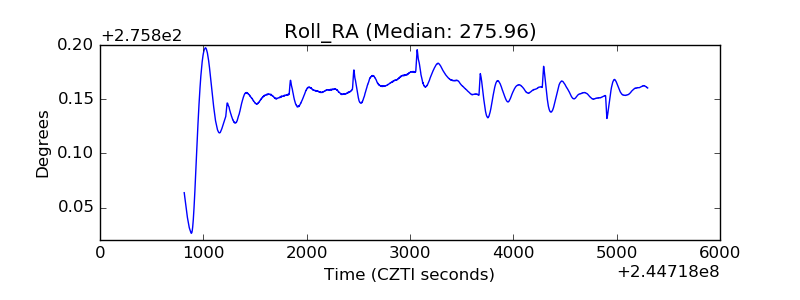 |
| Veto Counter | 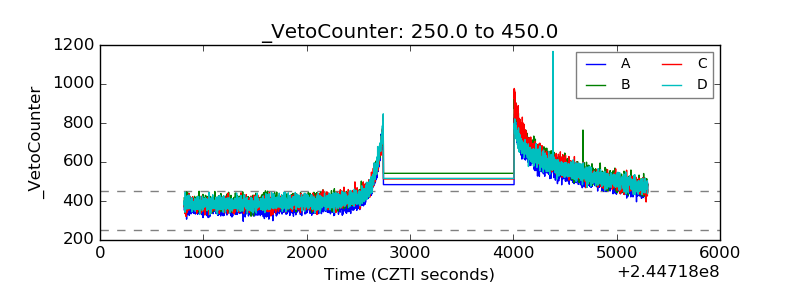 |