| Param | Original file | Final file |
|---|---|---|
| Filename | modeM0/AS1A04_055T02_9000001576_10899cztM0_level2.evt | modeM0/AS1A04_055T02_9000001576_10899cztM0_level2_quad_clean.evt |
| Size (bytes) | 779,506,560 | 107,542,080 |
| Size | 743.4 MB | 102.6 MB |
| Events in quadrant A | 6,735,468 | 683,716 |
| Events in quadrant B | 5,734,426 | 714,890 |
| Events in quadrant C | 3,080,373 | 744,358 |
| Events in quadrant D | 7,623,676 | 664,254 |
| Mode M9 | |||
|---|---|---|---|
| Quadrant | BADHDUFLAG | Total packets | Discarded packets |
| A | 0 | 12 | 0 |
| B | 0 | 12 | 0 |
| C | 0 | 12 | 0 |
| D | 0 | 12 | 0 |
| Mode SS | |||
|---|---|---|---|
| Quadrant | BADHDUFLAG | Total packets | Discarded packets |
| A | 0 | 132 | 0 |
| B | 0 | 132 | 0 |
| C | 0 | 132 | 0 |
| D | 0 | 132 | 0 |
| Mode M0 | |||
|---|---|---|---|
| Quadrant | BADHDUFLAG | Total packets | Discarded packets |
| A | 0 | 24368 | 2 |
| B | 0 | 21434 | 1 |
| C | 0 | 13380 | 1 |
| D | 0 | 26908 | 1 |
| Quadrant | Total seconds | Saturated seconds | Saturation percentage |
|---|---|---|---|
| A | 6426 | 1323 | 20.588235% |
| B | 6426 | 807 | 12.558357% |
| C | 6426 | 72 | 1.120448% |
| D | 6426 | 968 | 15.063803% |
Noise dominated data is calculated using 1-second bins in cleaned event files. If a bin has >2000 counts, and if more than 50% of those come from <1% of pixels, then it is considered to be noise-dominated and hence unusable.
| Quadrant | # 1 sec bins | Bins with >0 counts | Bins with >2000 counts | High rate bins dominated by noise | Noise dominated (total time) | Noise dominated (detector-on time) | Marked lightcurve |
|---|---|---|---|---|---|---|---|
| A | 7666 | 6426 | 880 | 880 | 11.48% | 13.69% | 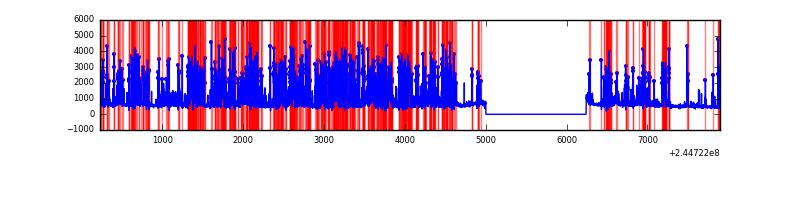 |
| B | 7666 | 6426 | 527 | 527 | 6.87% | 8.20% | 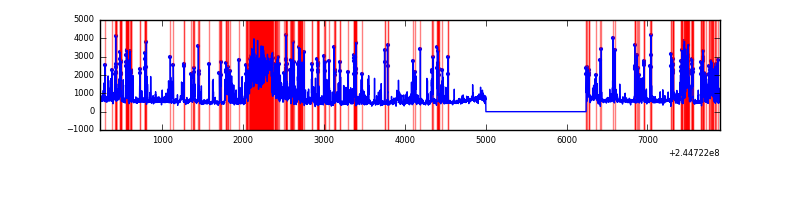 |
| C | 7666 | 6427 | 0 | 0 | 0.00% | 0.00% | 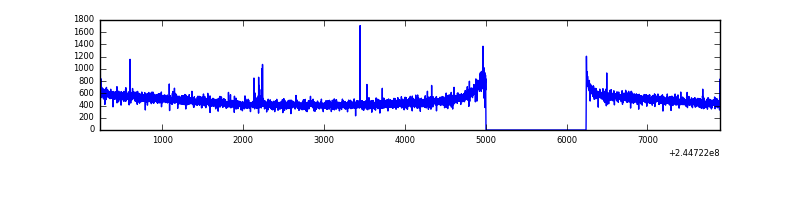 |
| D | 7666 | 6427 | 1061 | 1061 | 13.84% | 16.51% | 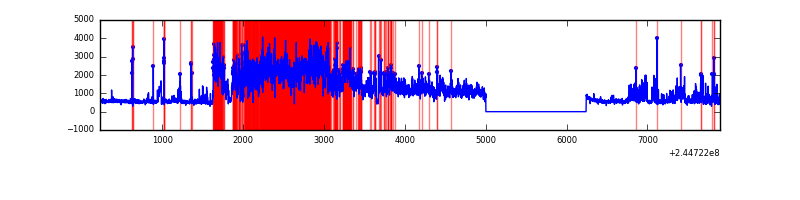 |
Top three noisy pixels from each quadrant. If the there are fewer than three noisy pixels in the level2.evt file, extra rows are filled as -1
| Pixel properties | Quadrant properties | ||||||
|---|---|---|---|---|---|---|---|
| Quadrant | DetID | PixID | Counts | Sigma | Mean | Median | Sigma |
| A | 8 | 5 | 3741036 | 24084.93 | 764 | 748 | 155.3 |
| A | 15 | 223 | 18749 | 115.91 | 764 | 748 | 155.3 |
| A | 8 | 6 | 12756 | 77.32 | 764 | 748 | 155.3 |
| B | 4 | 239 | 2124738 | 14267.21 | 788 | 773 | 148.9 |
| B | 10 | 245 | 394881 | 2647.32 | 788 | 773 | 148.9 |
| B | 0 | 219 | 73529 | 488.72 | 788 | 773 | 148.9 |
| C | 14 | 234 | 9006 | 45.58 | 786 | 791 | 180.2 |
| C | 13 | 61 | 5849 | 28.07 | 786 | 791 | 180.2 |
| C | 8 | 222 | 3595 | 15.56 | 786 | 791 | 180.2 |
| D | 13 | 152 | 3820201 | 20532.97 | 766 | 744 | 186.0 |
| D | 5 | 222 | 409404 | 2196.91 | 766 | 744 | 186.0 |
| D | 10 | 199 | 135936 | 726.78 | 766 | 744 | 186.0 |
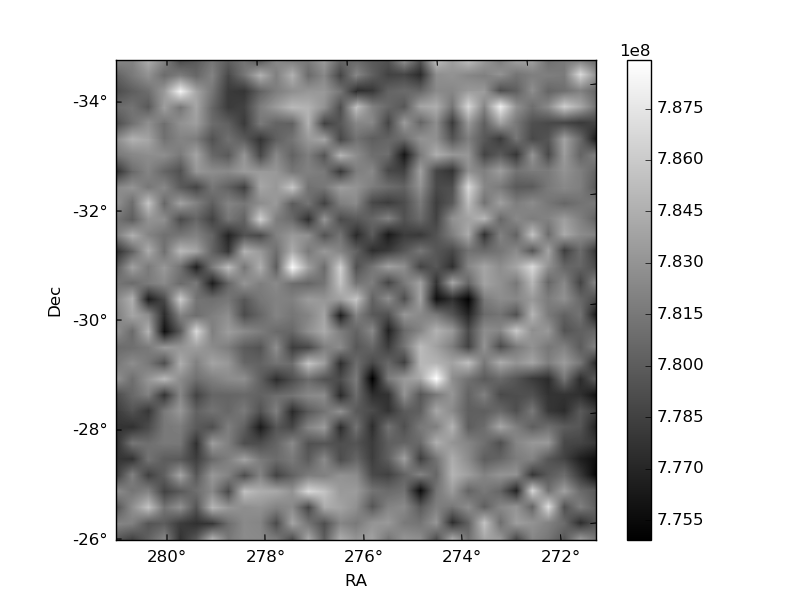
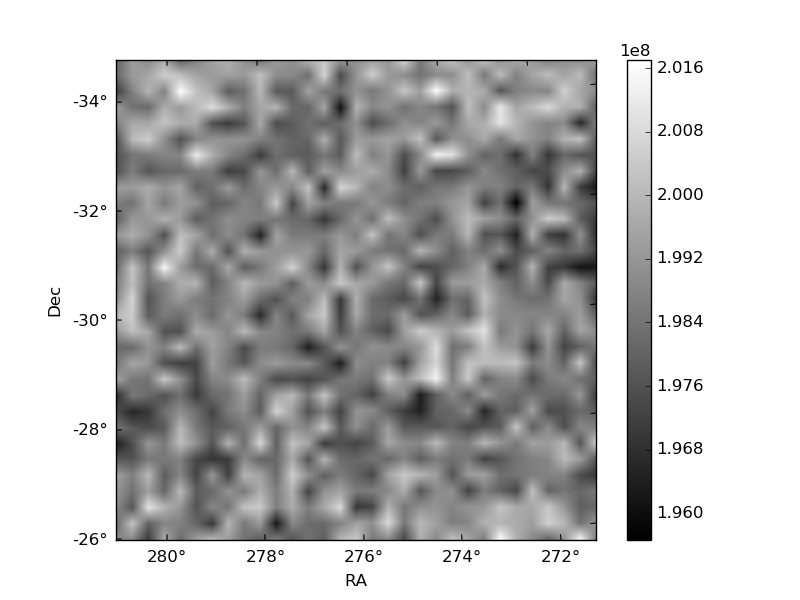
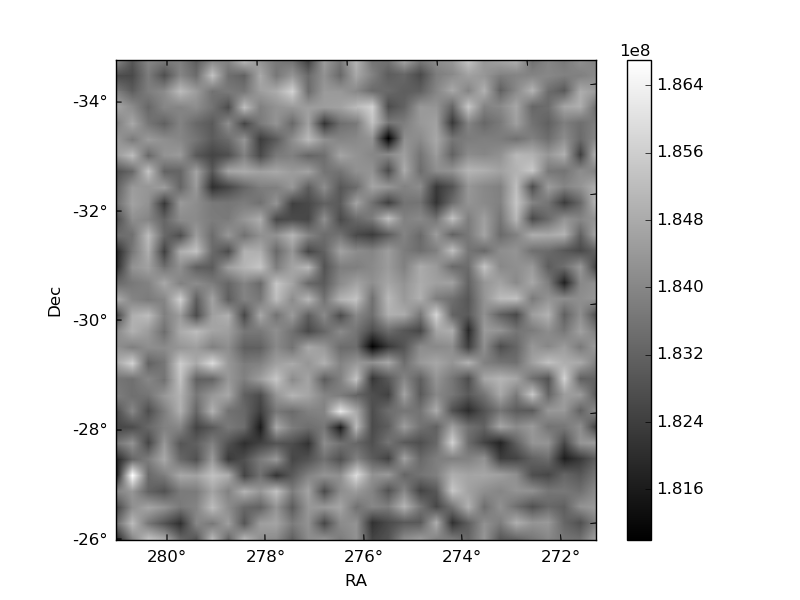
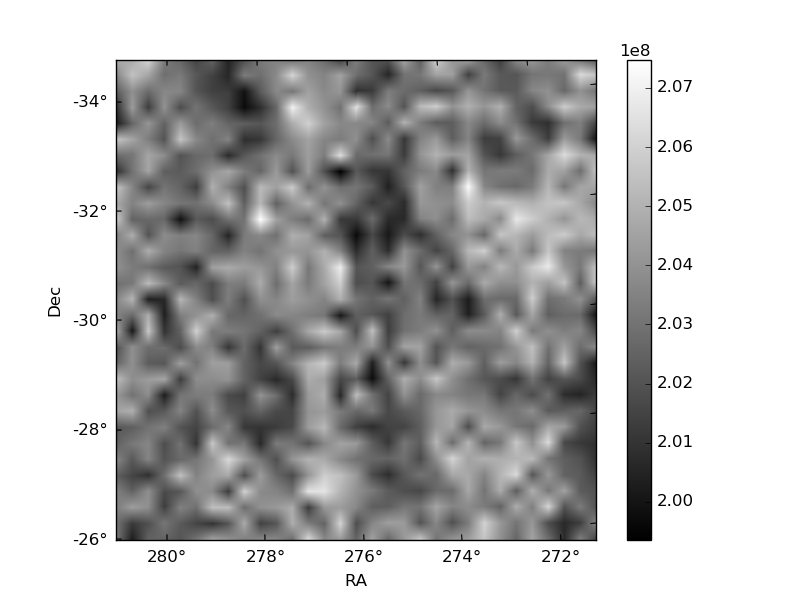
Histogram calculated using DETX and DETY for each event in the final _common_clean file
| Quadrant A | 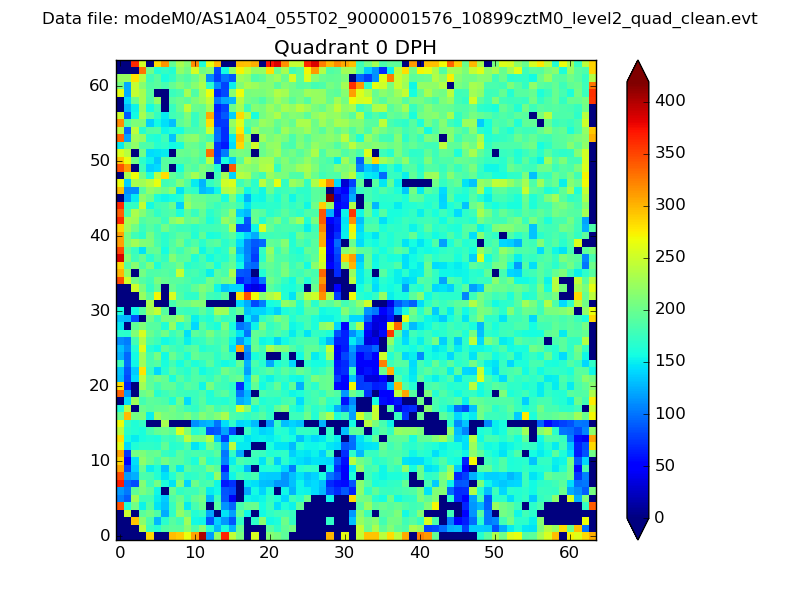 |
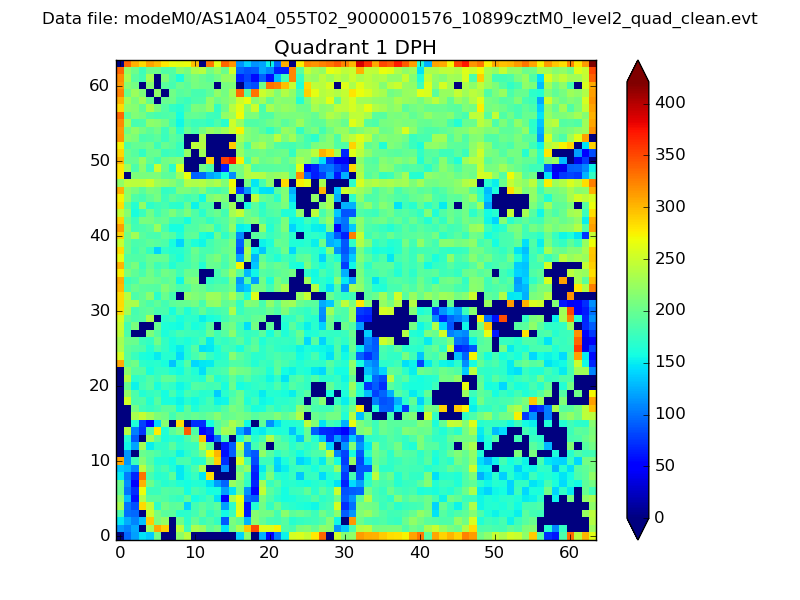 |
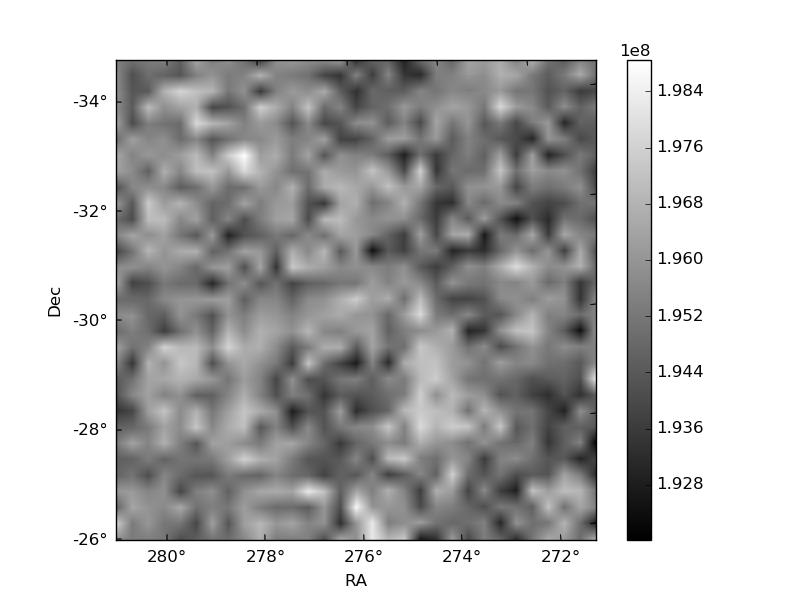
Quadrant B |
|---|---|---|---|
| Quadrant D | 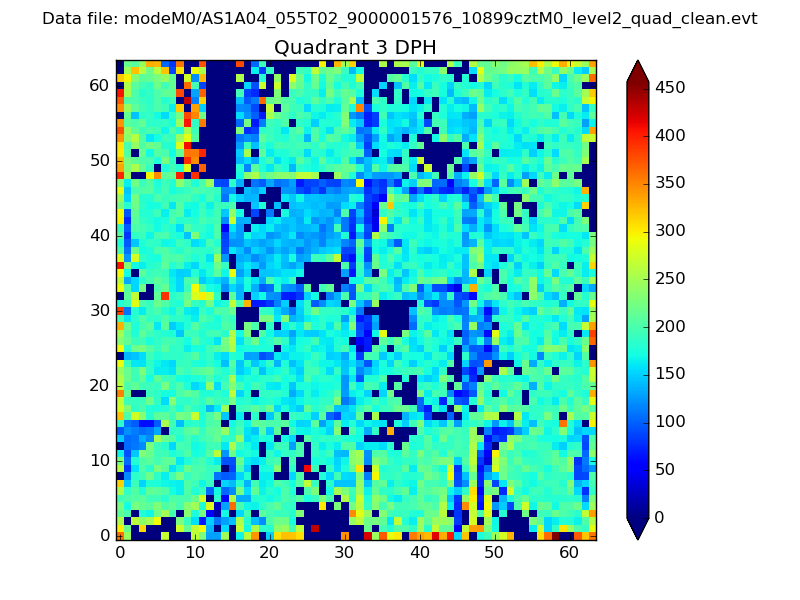 |
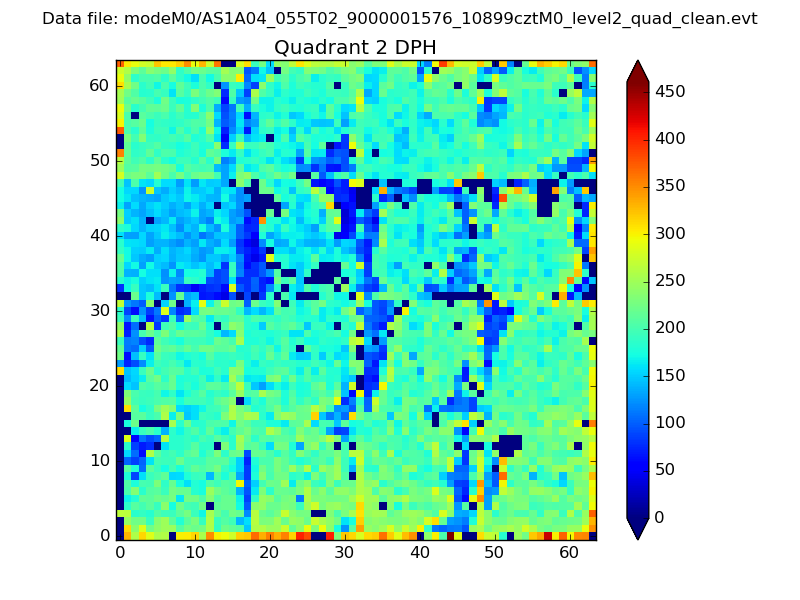 |
Quadrant C |
| Plot type | Count rate plots | Images |
|---|---|---|
| Comparison with Poisson distribution Blue bars denote a histogram of data divided into 1 sec bins. Red curve is a Poisson curve with rate = median count rate of data. |
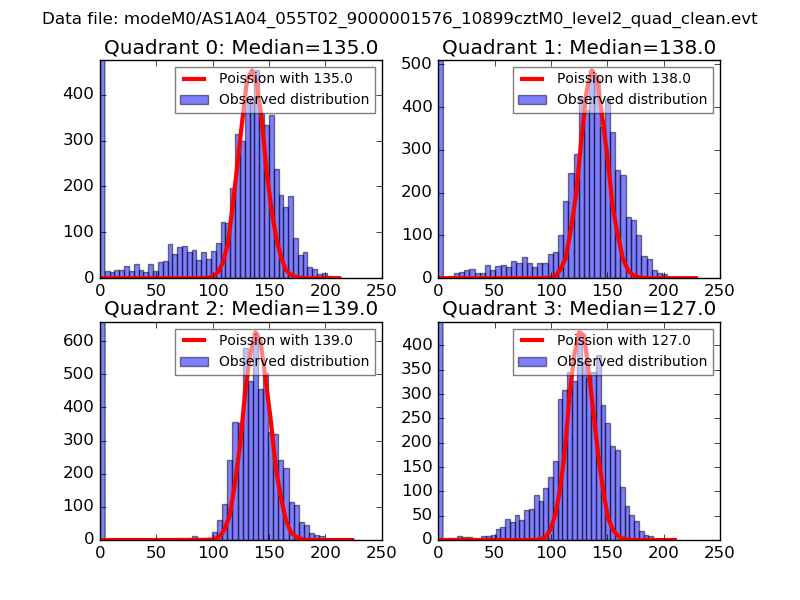 |
 |
| Quadrant-wise count rates Data is divided into 100 sec bins |
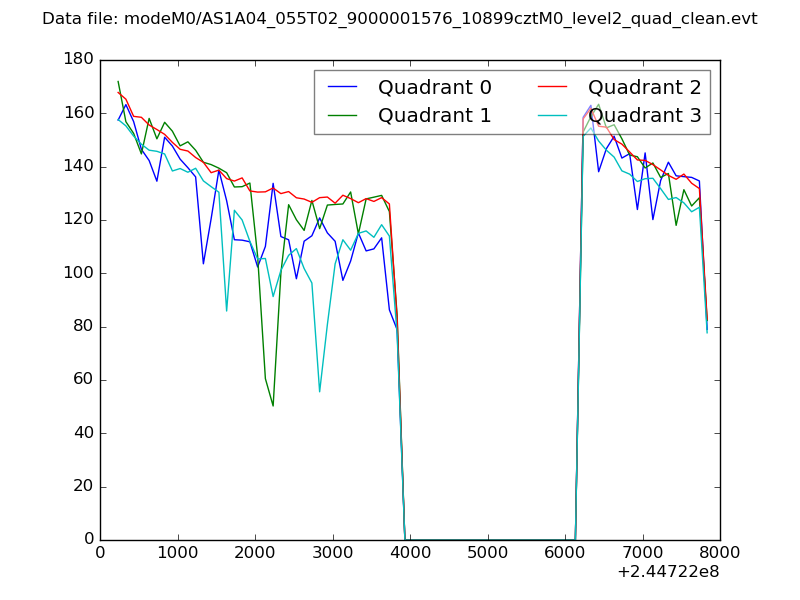 |
|
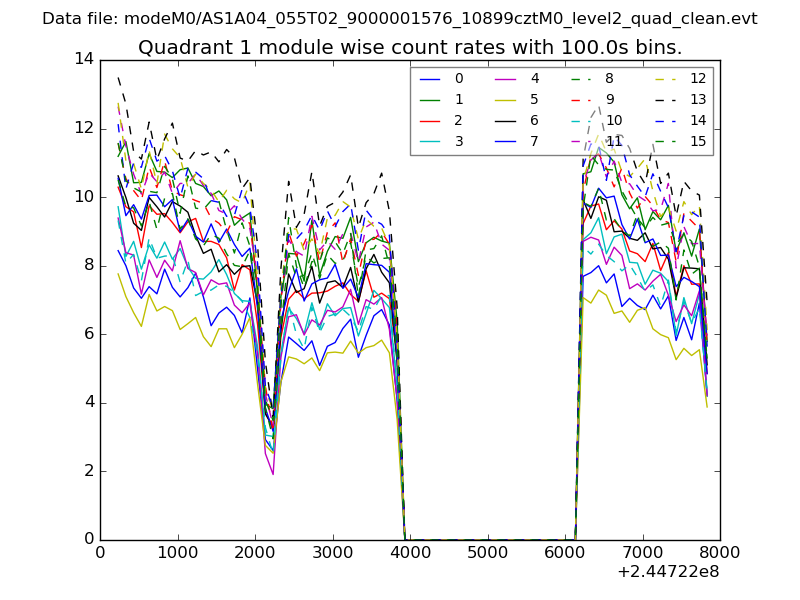
| Module-wise count rates for Quadrant A Data is divided into 100 sec bins |
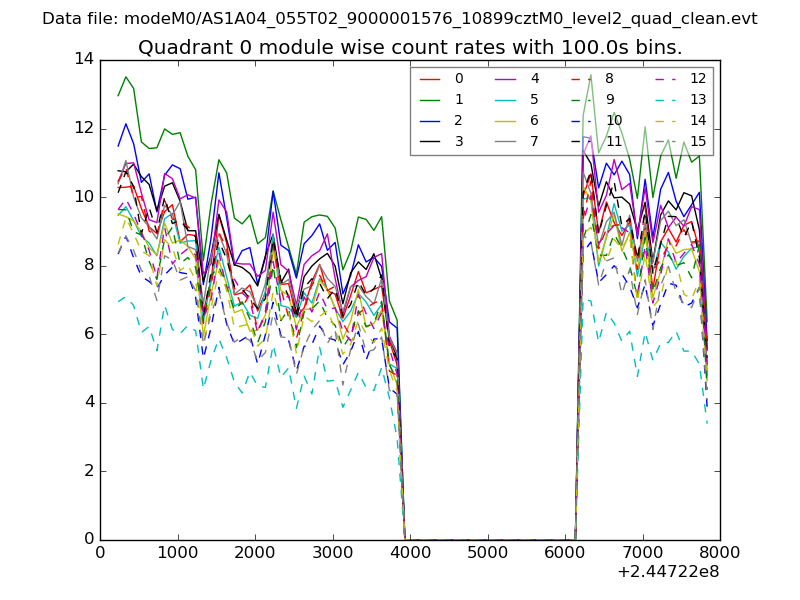 |
 |
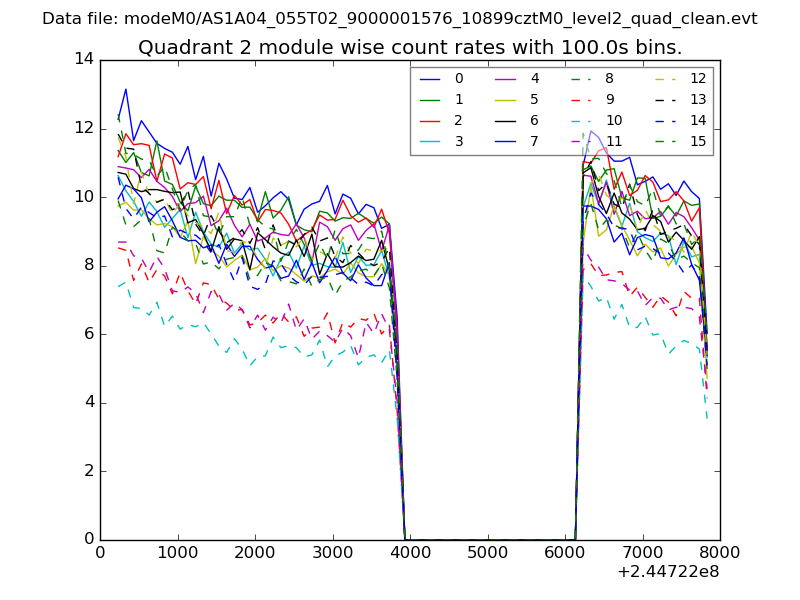
| Module-wise count rates for Quadrant B Data is divided into 100 sec bins |
 |
 |
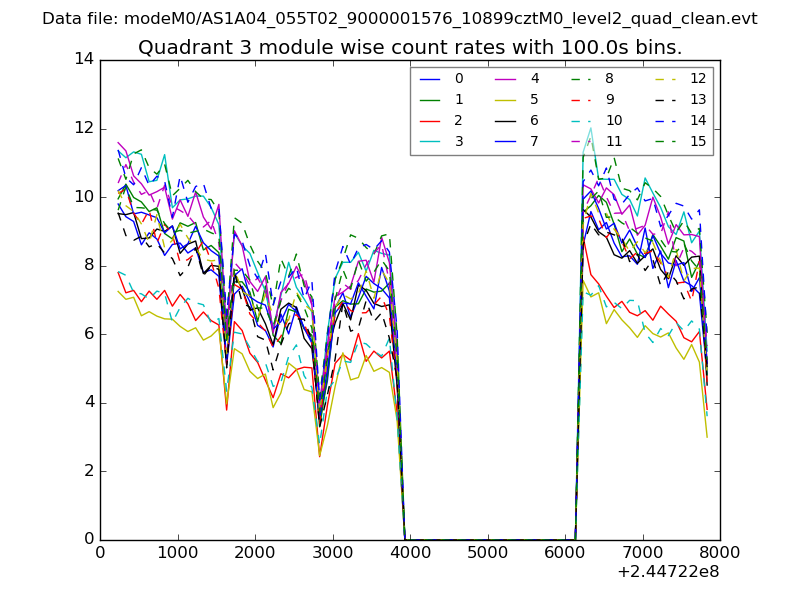
| Module-wise count rates for Quadrant C Data is divided into 100 sec bins |
 |
 |
| Module-wise count rates for Quadrant D Data is divided into 100 sec bins |
 |
 |
| Parameter | Plot |
|---|---|
| CZT HV Monitor | 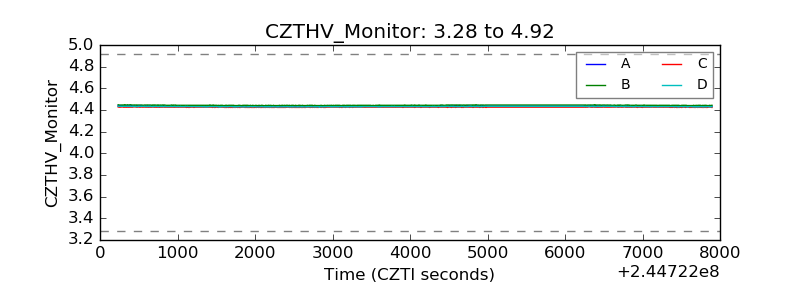 |
| D_VDD | 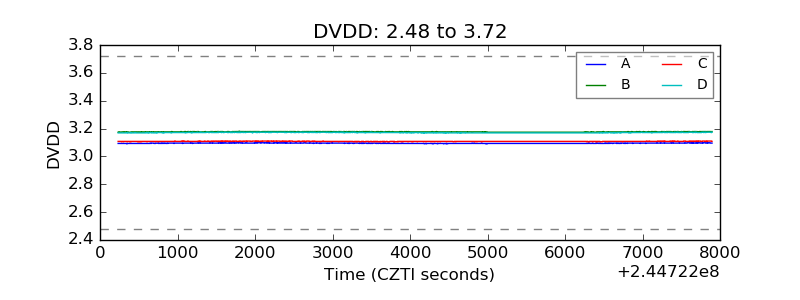 |
| Temperature 1 |  |
| Veto HV Monitor | 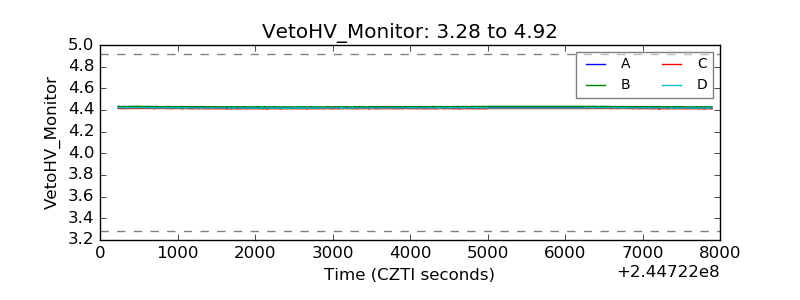 |
| Veto LLD | 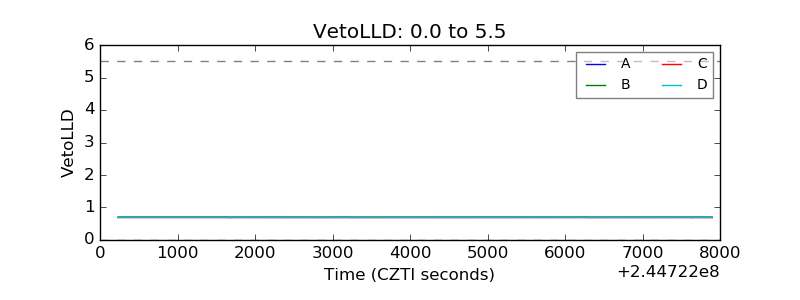 |
| Alpha Counter | 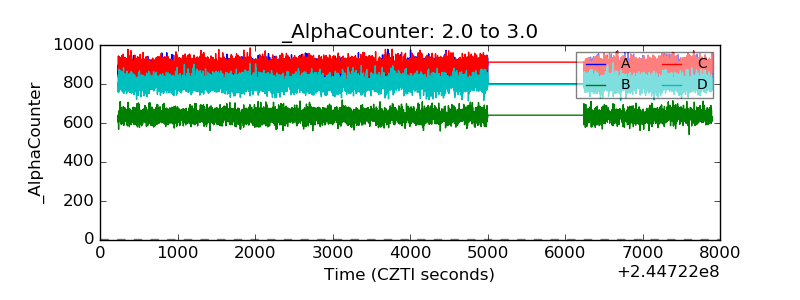 |
| _CPM_Rate | 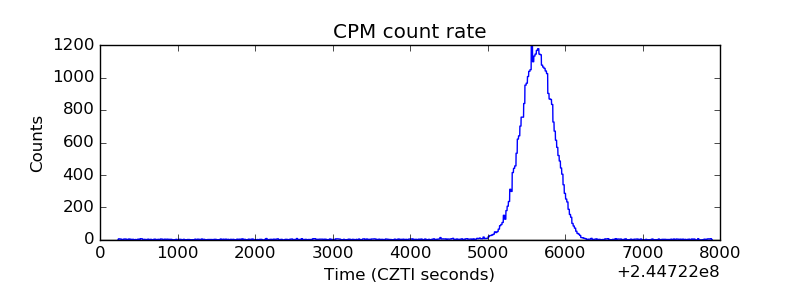 |
| CZT Counter | 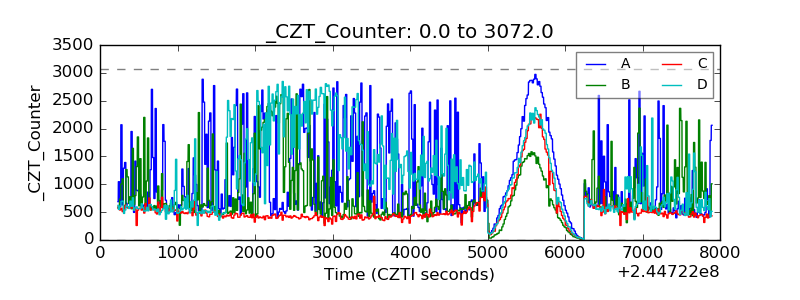 |
| +2.5 Volts monitor |  |
| +5 Volts monitor |  |
| _ROLL_ROT | 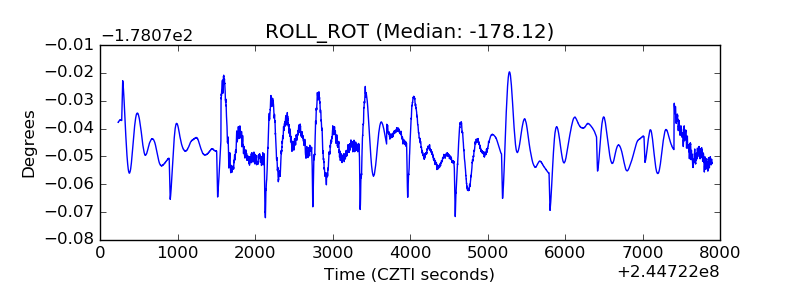 |
| _Roll_DEC | 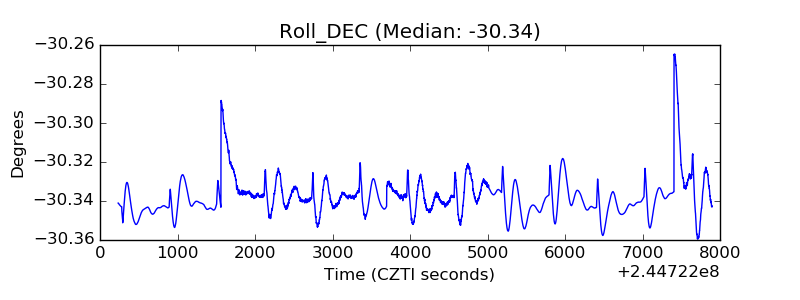 |
| _Roll_RA | 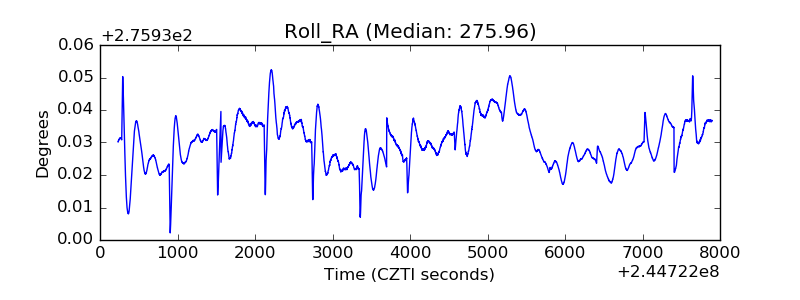 |
| Veto Counter | 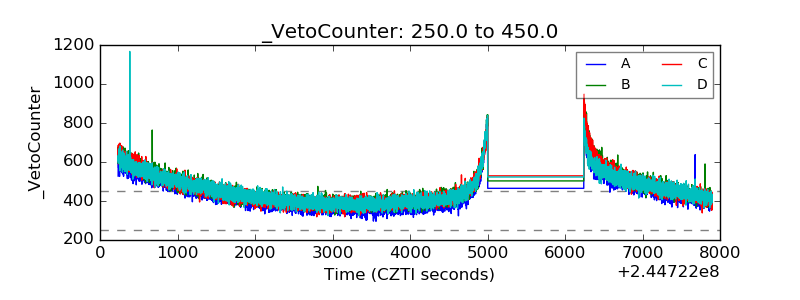 |