| Param | Original file | Final file |
|---|---|---|
| Filename | modeM0/AS1A04_055T02_9000001576_10900cztM0_level2.evt | modeM0/AS1A04_055T02_9000001576_10900cztM0_level2_quad_clean.evt |
| Size (bytes) | 555,278,400 | 88,839,360 |
| Size | 529.6 MB | 84.7 MB |
| Events in quadrant A | 4,738,408 | 571,717 |
| Events in quadrant B | 5,362,201 | 557,549 |
| Events in quadrant C | 2,787,670 | 584,304 |
| Events in quadrant D | 3,517,467 | 553,342 |
| Mode M9 | |||
|---|---|---|---|
| Quadrant | BADHDUFLAG | Total packets | Discarded packets |
| A | 0 | 11 | 0 |
| B | 0 | 11 | 0 |
| C | 0 | 11 | 0 |
| D | 0 | 11 | 0 |
| Mode SS | |||
|---|---|---|---|
| Quadrant | BADHDUFLAG | Total packets | Discarded packets |
| A | 0 | 124 | 0 |
| B | 0 | 124 | 0 |
| C | 0 | 124 | 0 |
| D | 0 | 124 | 0 |
| Mode M0 | |||
|---|---|---|---|
| Quadrant | BADHDUFLAG | Total packets | Discarded packets |
| A | 0 | 18102 | 2 |
| B | 0 | 19875 | 1 |
| C | 0 | 12499 | 1 |
| D | 0 | 14556 | 1 |
| Quadrant | Total seconds | Saturated seconds | Saturation percentage |
|---|---|---|---|
| A | 6054 | 589 | 9.729105% |
| B | 6054 | 846 | 13.974232% |
| C | 6054 | 52 | 0.858936% |
| D | 6054 | 171 | 2.824579% |
Noise dominated data is calculated using 1-second bins in cleaned event files. If a bin has >2000 counts, and if more than 50% of those come from <1% of pixels, then it is considered to be noise-dominated and hence unusable.
| Quadrant | # 1 sec bins | Bins with >0 counts | Bins with >2000 counts | High rate bins dominated by noise | Noise dominated (total time) | Noise dominated (detector-on time) | Marked lightcurve |
|---|---|---|---|---|---|---|---|
| A | 7199 | 6054 | 354 | 354 | 4.92% | 5.85% | 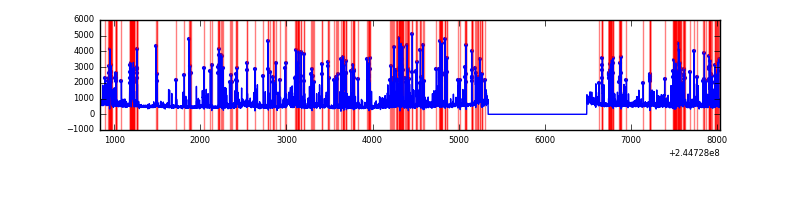 |
| B | 7199 | 6055 | 561 | 561 | 7.79% | 9.27% | 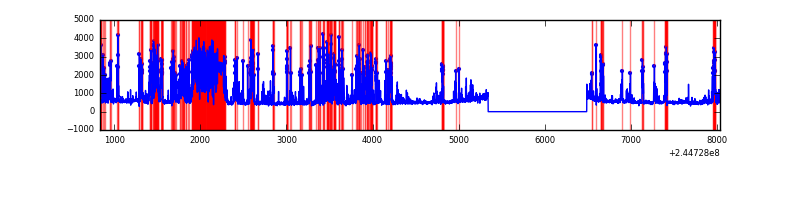 |
| C | 7199 | 6055 | 2 | 2 | 0.03% | 0.03% |  |
| D | 7199 | 6055 | 60 | 60 | 0.83% | 0.99% | 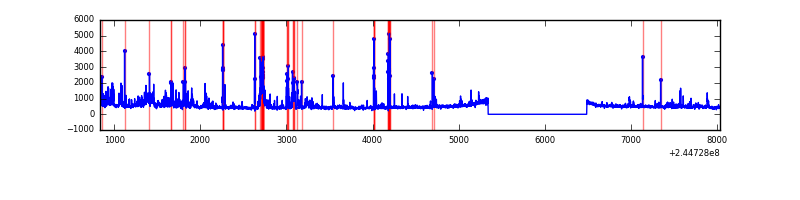 |
Top three noisy pixels from each quadrant. If the there are fewer than three noisy pixels in the level2.evt file, extra rows are filled as -1
| Pixel properties | Quadrant properties | ||||||
|---|---|---|---|---|---|---|---|
| Quadrant | DetID | PixID | Counts | Sigma | Mean | Median | Sigma |
| A | 8 | 5 | 1914319 | 13055.91 | 720 | 708 | 146.6 |
| A | 13 | 14 | 15532 | 101.14 | 720 | 708 | 146.6 |
| A | 8 | 6 | 9649 | 61.0 | 720 | 708 | 146.6 |
| B | 4 | 239 | 2155413 | 15895.31 | 713 | 698 | 135.6 |
| B | 10 | 245 | 258114 | 1898.96 | 713 | 698 | 135.6 |
| B | 0 | 231 | 54304 | 395.45 | 713 | 698 | 135.6 |
| C | 14 | 234 | 7889 | 43.89 | 710 | 714 | 163.5 |
| C | 13 | 61 | 5347 | 28.34 | 710 | 714 | 163.5 |
| C | 8 | 222 | 5004 | 26.24 | 710 | 714 | 163.5 |
| D | 5 | 222 | 306664 | 1776.76 | 709 | 690 | 172.2 |
| D | 10 | 199 | 150916 | 872.35 | 709 | 690 | 172.2 |
| D | 1 | 52 | 62997 | 361.81 | 709 | 690 | 172.2 |
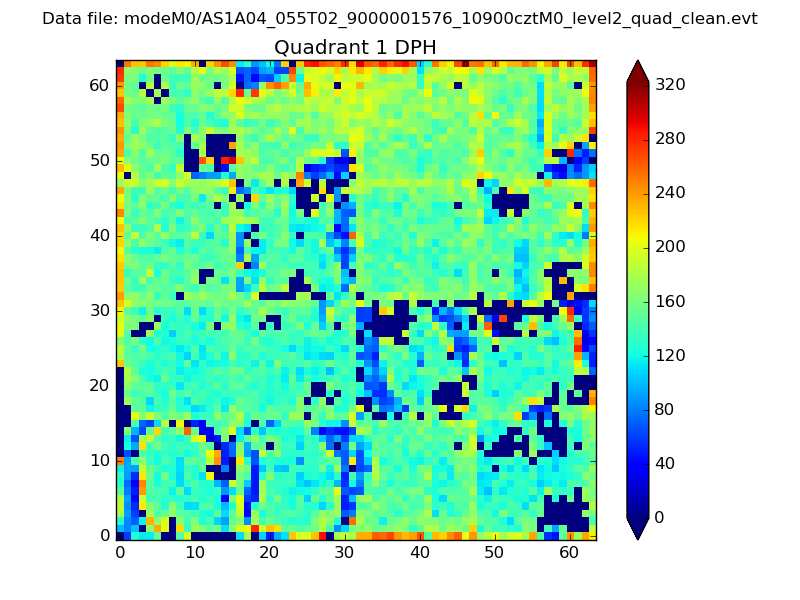
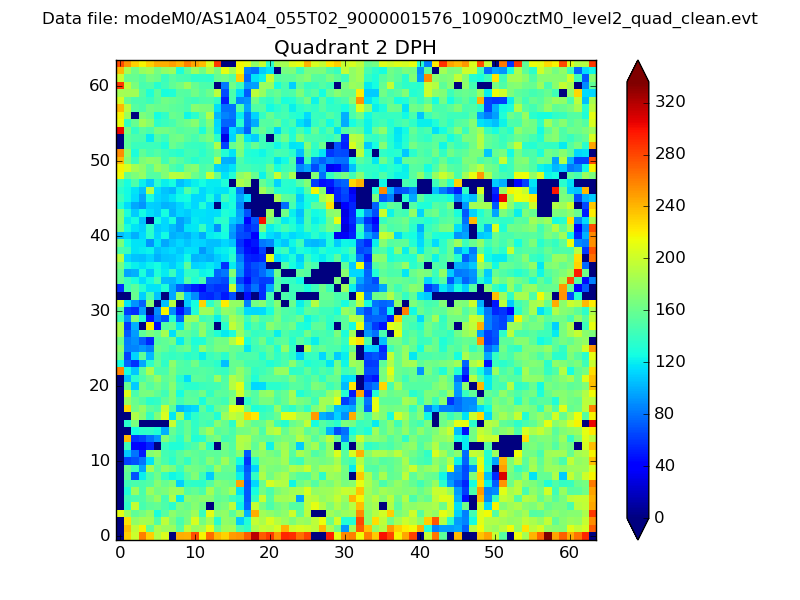
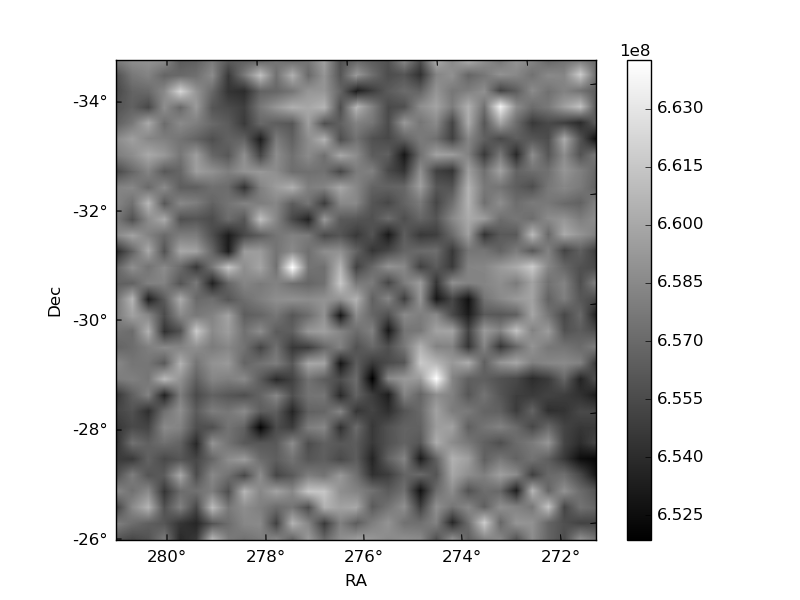
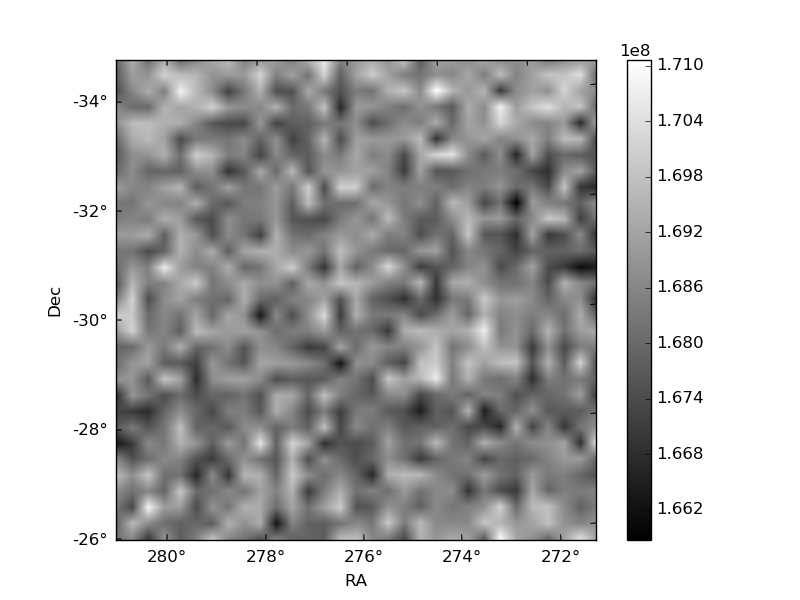
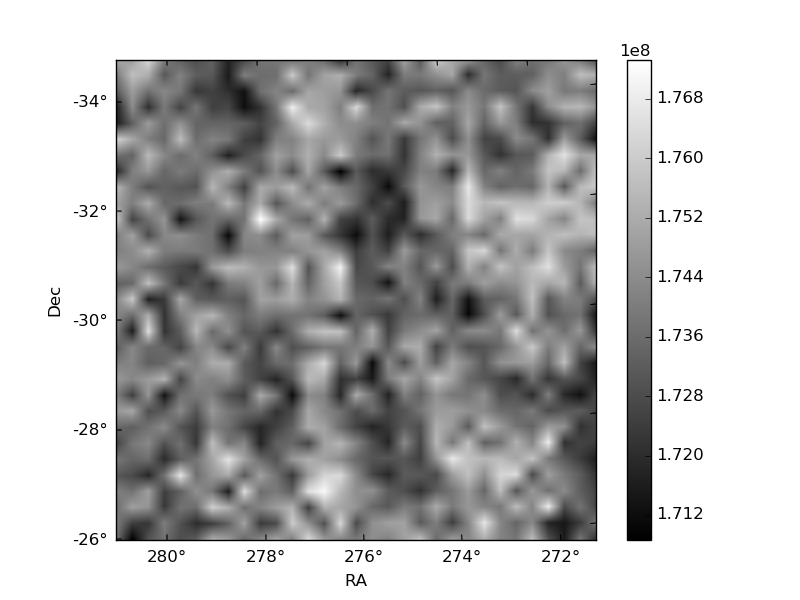
Histogram calculated using DETX and DETY for each event in the final _common_clean file
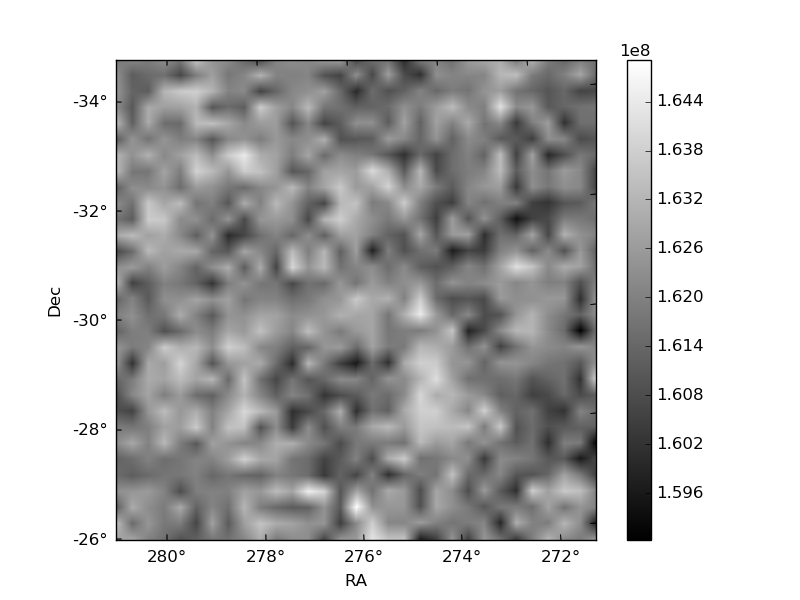
| Quadrant A | 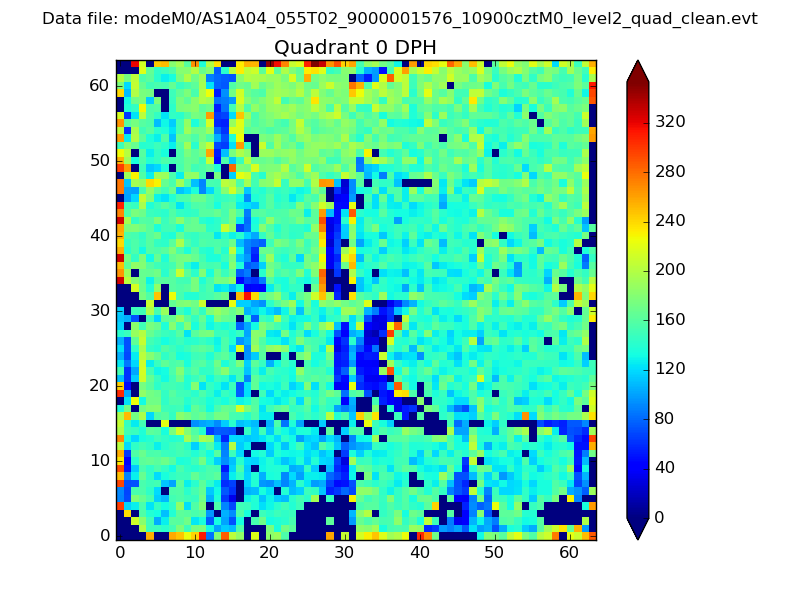 |
 |
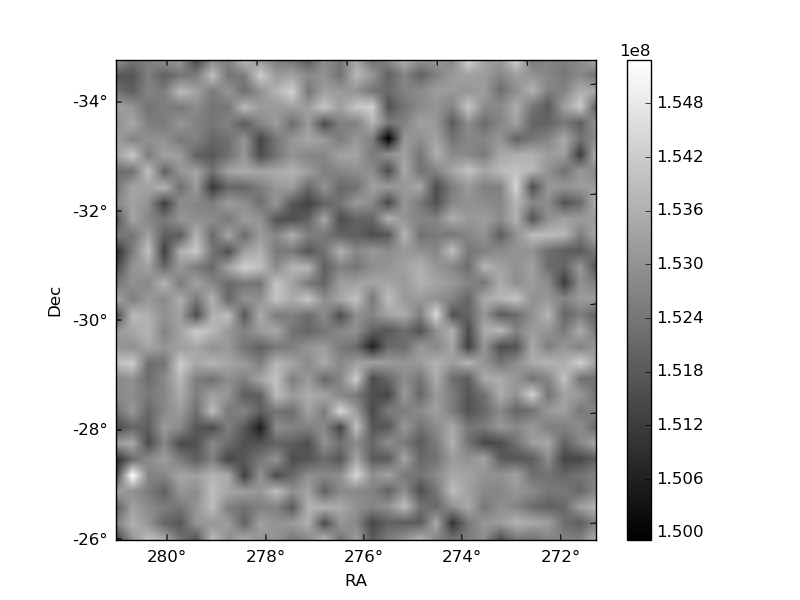
Quadrant B |
|---|---|---|---|
| Quadrant D | 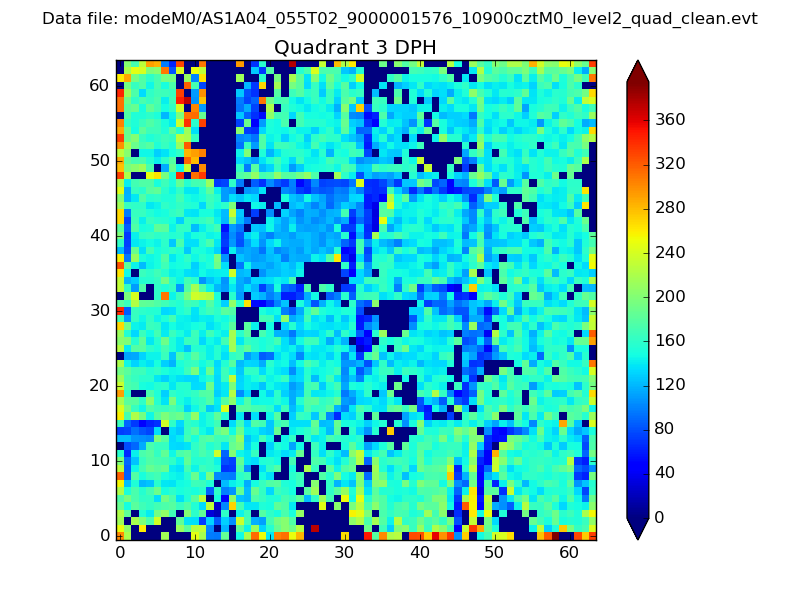 |
 |
Quadrant C |
| Plot type | Count rate plots | Images |
|---|---|---|
| Comparison with Poisson distribution Blue bars denote a histogram of data divided into 1 sec bins. Red curve is a Poisson curve with rate = median count rate of data. |
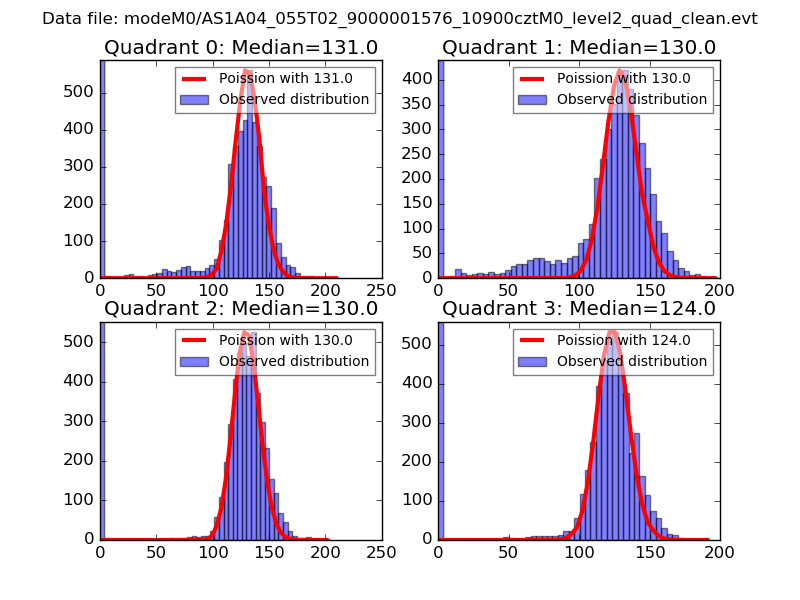 |
 |
| Quadrant-wise count rates Data is divided into 100 sec bins |
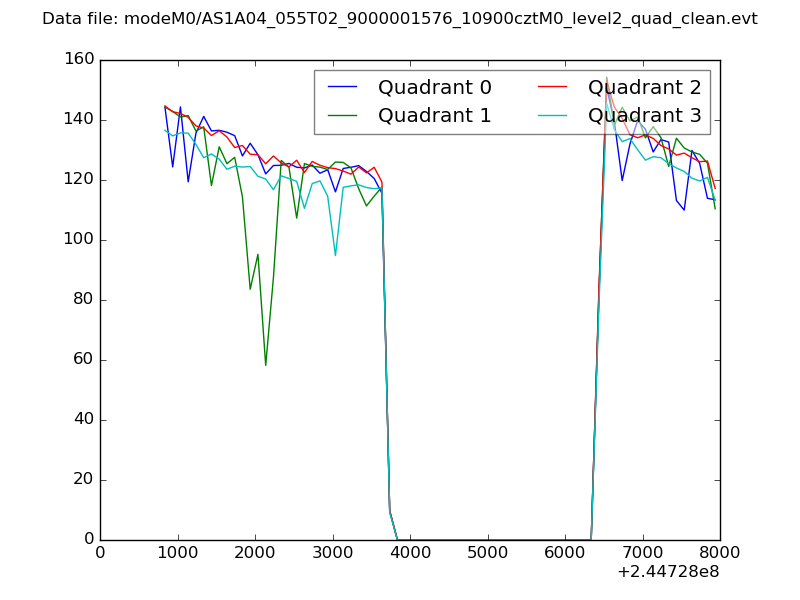 |
|
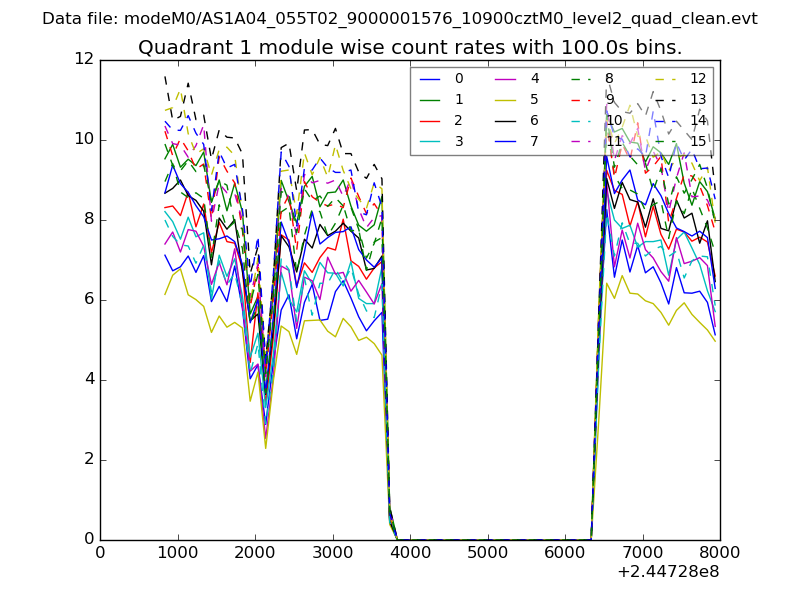
| Module-wise count rates for Quadrant A Data is divided into 100 sec bins |
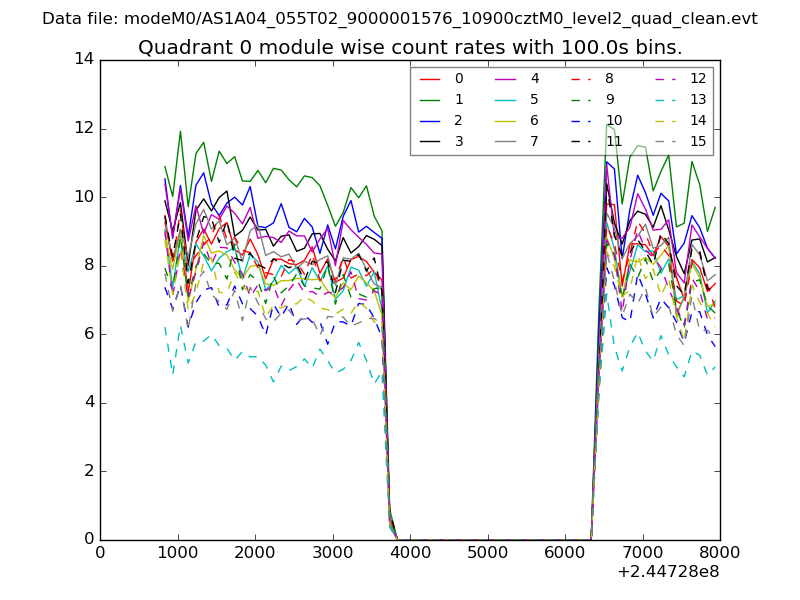 |
 |
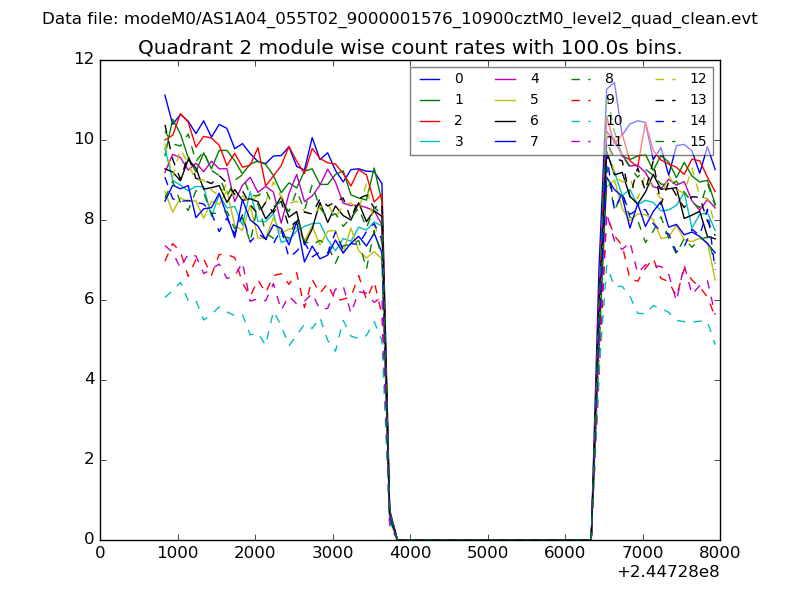
| Module-wise count rates for Quadrant B Data is divided into 100 sec bins |
 |
 |
| Module-wise count rates for Quadrant C Data is divided into 100 sec bins |
 |
 |
| Module-wise count rates for Quadrant D Data is divided into 100 sec bins |
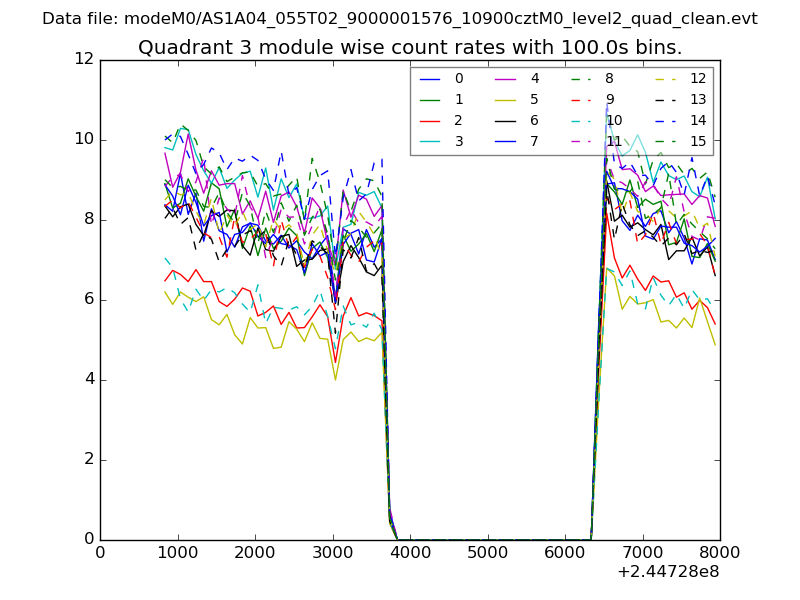 |
 |
| Parameter | Plot |
|---|---|
| CZT HV Monitor | 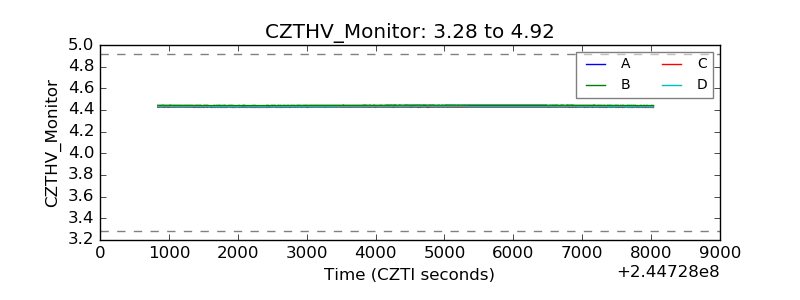 |
| D_VDD | 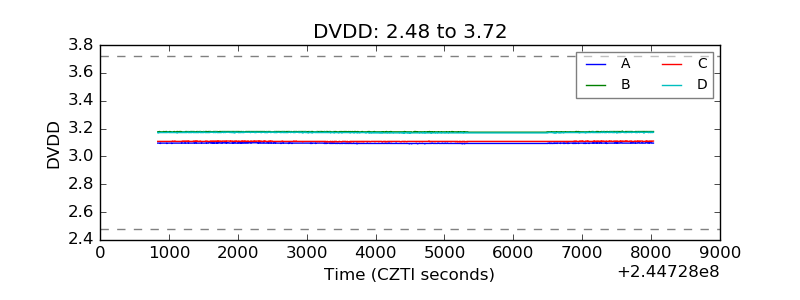 |
| Temperature 1 | 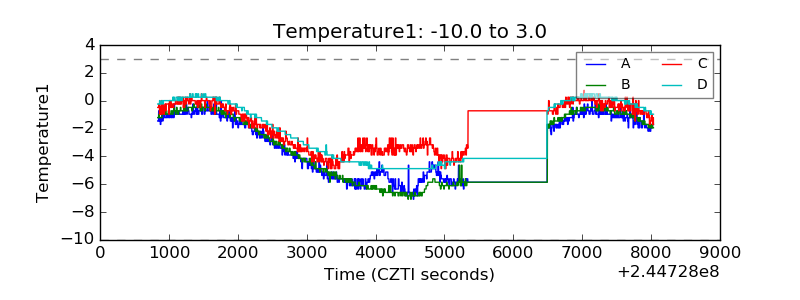 |
| Veto HV Monitor |  |
| Veto LLD | 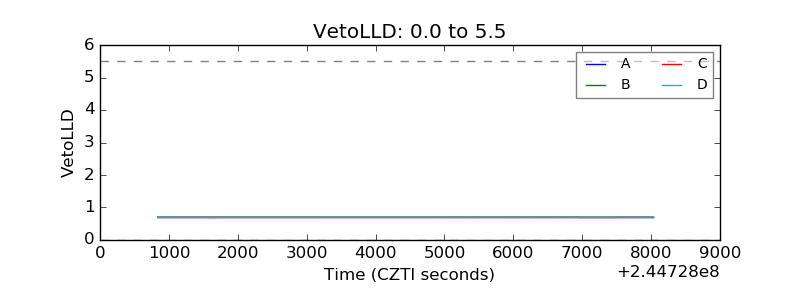 |
| Alpha Counter | 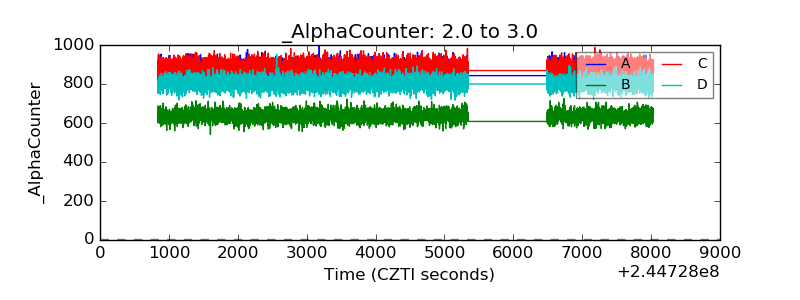 |
| _CPM_Rate | 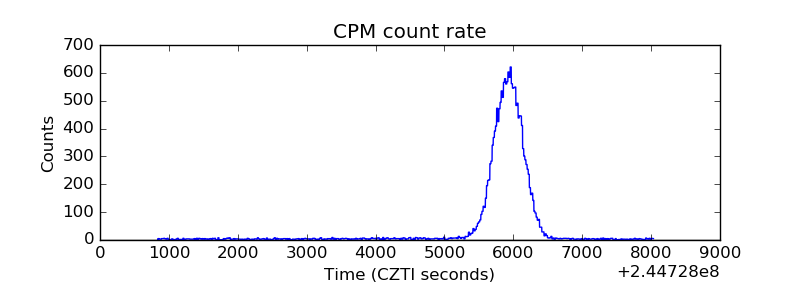 |
| CZT Counter |  |
| +2.5 Volts monitor |  |
| +5 Volts monitor |  |
| _ROLL_ROT | 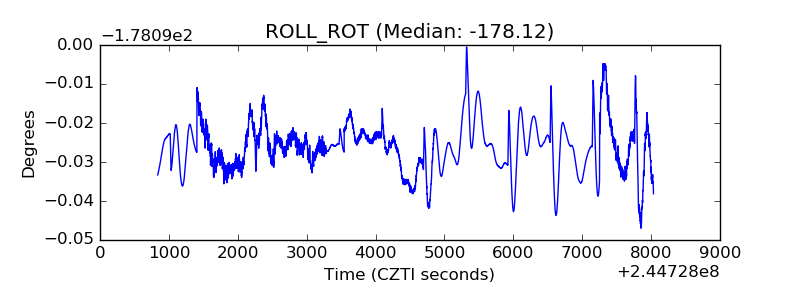 |
| _Roll_DEC | 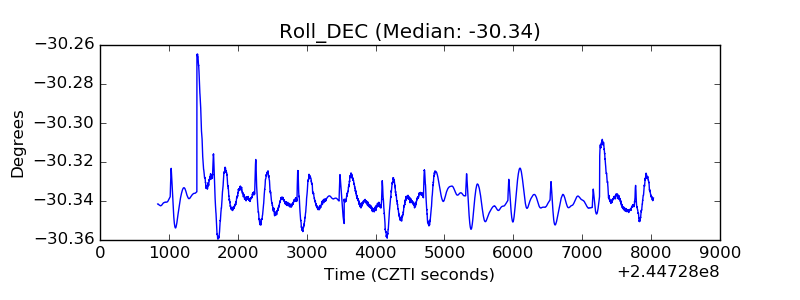 |
| _Roll_RA | 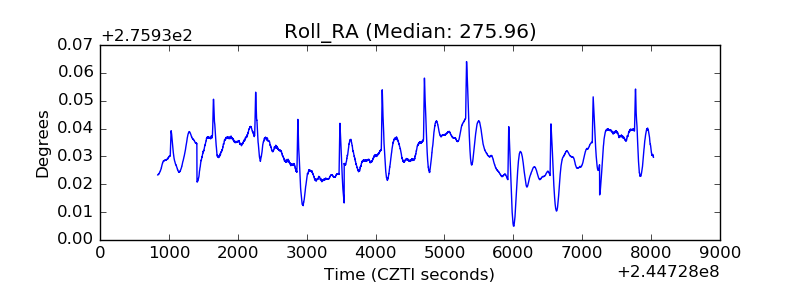 |
| Veto Counter | 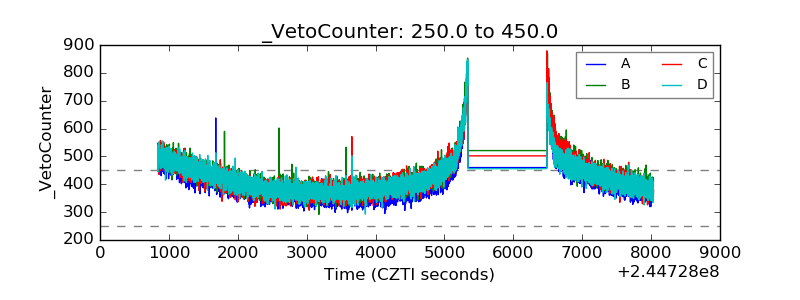 |