| Param | Original file | Final file |
|---|---|---|
| Filename | modeM0/AS1A04_055T02_9000001576_10901cztM0_level2.evt | modeM0/AS1A04_055T02_9000001576_10901cztM0_level2_quad_clean.evt |
| Size (bytes) | 500,806,080 | 78,531,840 |
| Size | 477.6 MB | 74.9 MB |
| Events in quadrant A | 4,141,410 | 487,221 |
| Events in quadrant B | 4,115,979 | 495,996 |
| Events in quadrant C | 2,732,126 | 499,667 |
| Events in quadrant D | 3,761,917 | 467,511 |
| Mode M9 | |||
|---|---|---|---|
| Quadrant | BADHDUFLAG | Total packets | Discarded packets |
| A | 0 | 9 | 0 |
| B | 0 | 9 | 0 |
| C | 0 | 9 | 0 |
| D | 0 | 9 | 0 |
| Mode SS | |||
|---|---|---|---|
| Quadrant | BADHDUFLAG | Total packets | Discarded packets |
| A | 0 | 124 | 0 |
| B | 0 | 124 | 0 |
| C | 0 | 124 | 0 |
| D | 0 | 124 | 0 |
| Mode M0 | |||
|---|---|---|---|
| Quadrant | BADHDUFLAG | Total packets | Discarded packets |
| A | 0 | 16452 | 2 |
| B | 0 | 16254 | 1 |
| C | 0 | 12559 | 1 |
| D | 0 | 15528 | 1 |
| Quadrant | Total seconds | Saturated seconds | Saturation percentage |
|---|---|---|---|
| A | 6121 | 401 | 6.551217% |
| B | 6121 | 351 | 5.734357% |
| C | 6121 | 43 | 0.702500% |
| D | 6121 | 254 | 4.149649% |
Noise dominated data is calculated using 1-second bins in cleaned event files. If a bin has >2000 counts, and if more than 50% of those come from <1% of pixels, then it is considered to be noise-dominated and hence unusable.
| Quadrant | # 1 sec bins | Bins with >0 counts | Bins with >2000 counts | High rate bins dominated by noise | Noise dominated (total time) | Noise dominated (detector-on time) | Marked lightcurve |
|---|---|---|---|---|---|---|---|
| A | 7046 | 6122 | 256 | 256 | 3.63% | 4.18% | 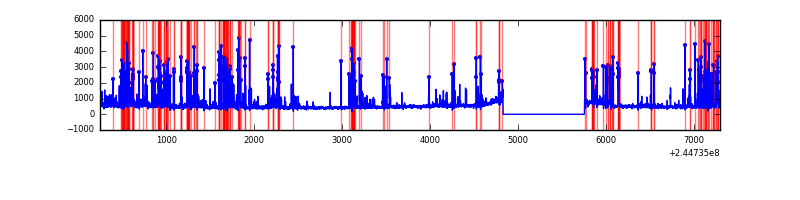 |
| B | 7046 | 6122 | 180 | 180 | 2.55% | 2.94% | 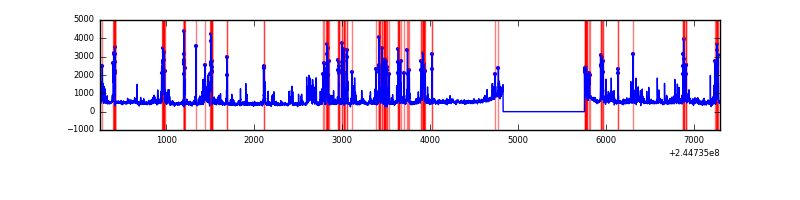 |
| C | 7046 | 6122 | 0 | 0 | 0.00% | 0.00% | 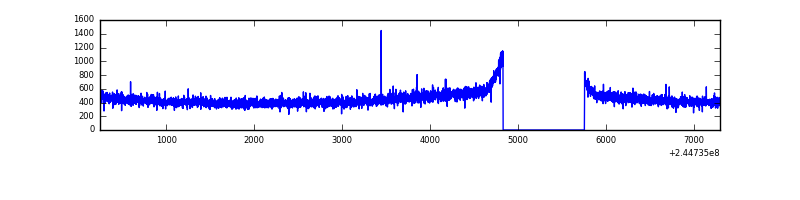 |
| D | 7046 | 6122 | 185 | 185 | 2.63% | 3.02% | 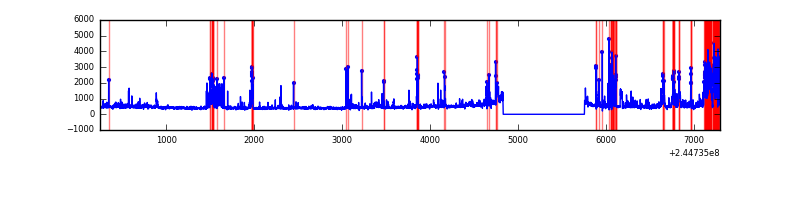 |
Top three noisy pixels from each quadrant. If the there are fewer than three noisy pixels in the level2.evt file, extra rows are filled as -1
| Pixel properties | Quadrant properties | ||||||
|---|---|---|---|---|---|---|---|
| Quadrant | DetID | PixID | Counts | Sigma | Mean | Median | Sigma |
| A | 8 | 5 | 1316485 | 9122.45 | 711 | 697 | 144.2 |
| A | 11 | 29 | 38911 | 264.94 | 711 | 697 | 144.2 |
| A | 13 | 251 | 11962 | 78.1 | 711 | 697 | 144.2 |
| B | 4 | 239 | 1097570 | 7942.15 | 716 | 700 | 138.1 |
| B | 10 | 245 | 80222 | 575.8 | 716 | 700 | 138.1 |
| B | 0 | 182 | 41266 | 293.73 | 716 | 700 | 138.1 |
| C | 7 | 235 | 5218 | 27.67 | 698 | 700 | 163.3 |
| C | 13 | 61 | 5073 | 26.78 | 698 | 700 | 163.3 |
| C | 8 | 222 | 4188 | 21.36 | 698 | 700 | 163.3 |
| D | 10 | 199 | 518157 | 3110.19 | 686 | 668 | 166.4 |
| D | 1 | 52 | 257112 | 1541.27 | 686 | 668 | 166.4 |
| D | 7 | 71 | 153576 | 919.0 | 686 | 668 | 166.4 |
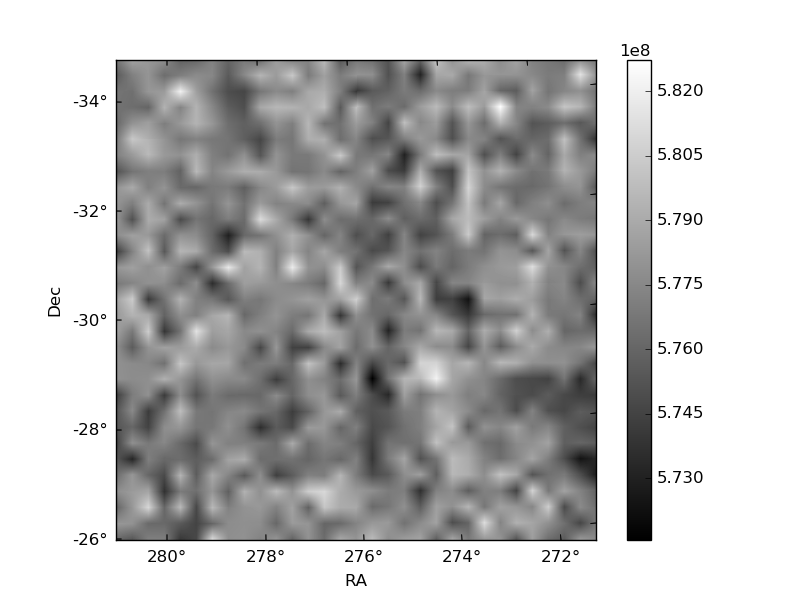
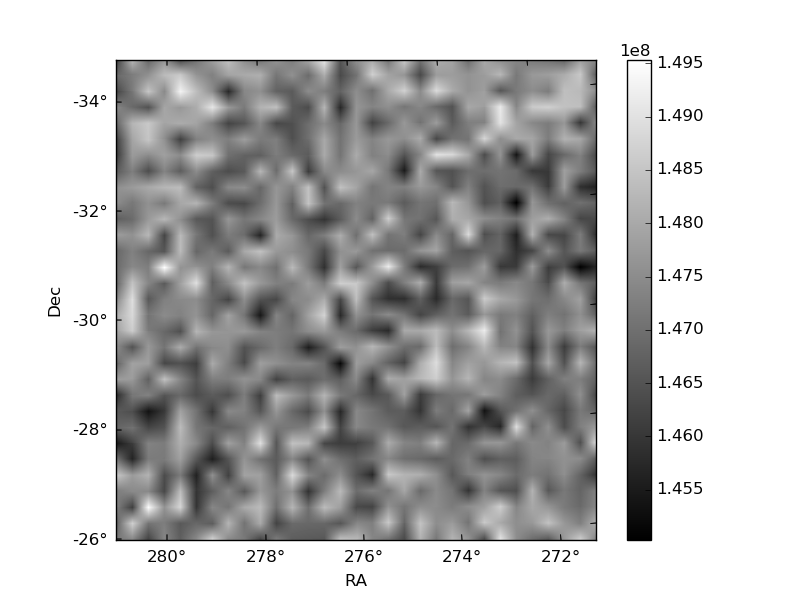
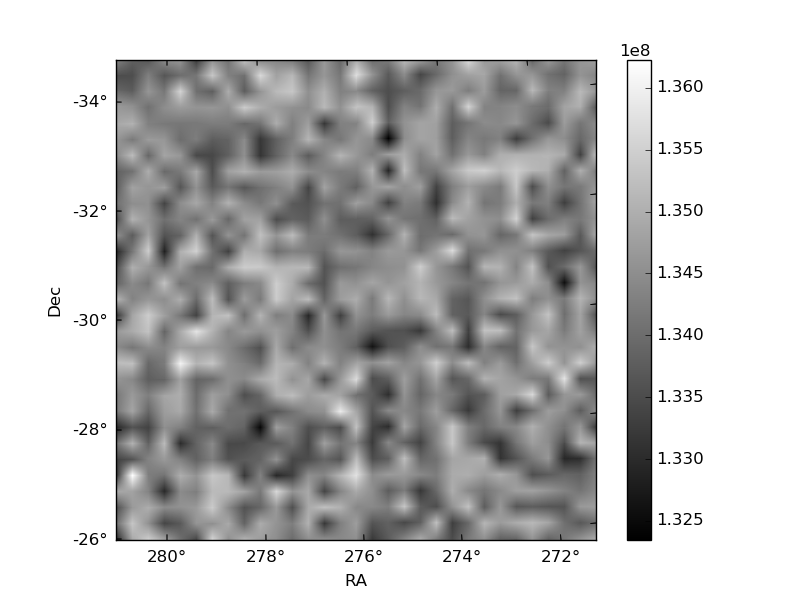
Histogram calculated using DETX and DETY for each event in the final _common_clean file
| Quadrant A | 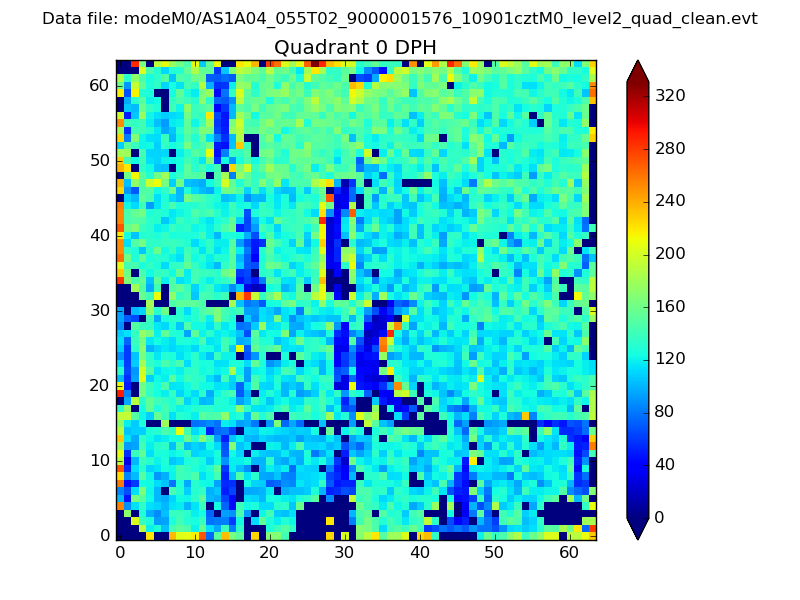 |
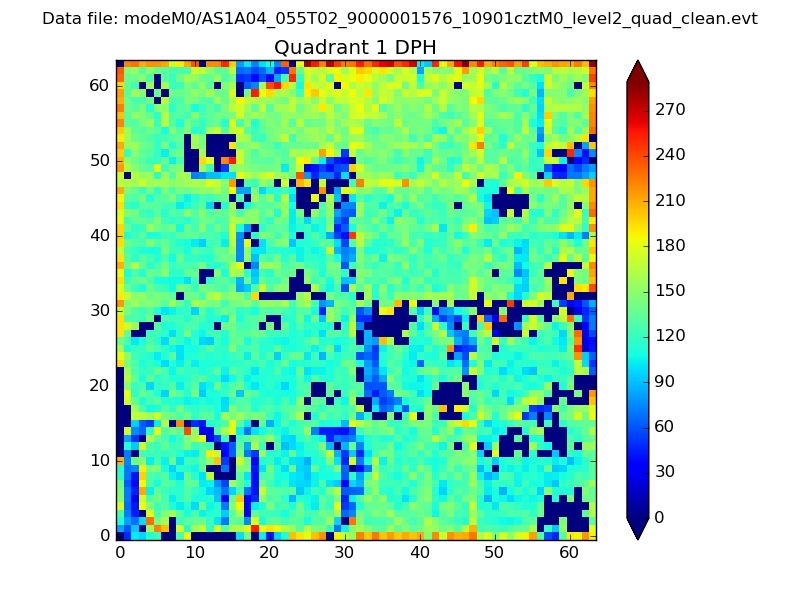 |
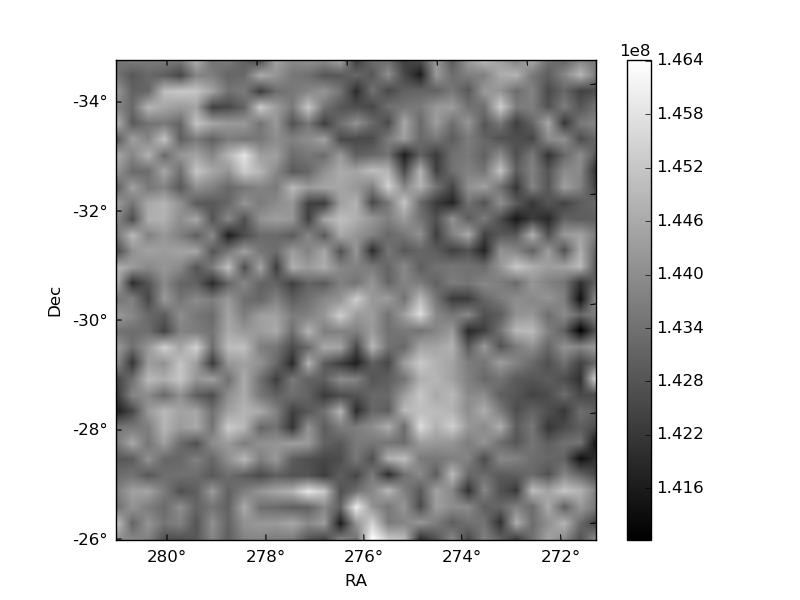
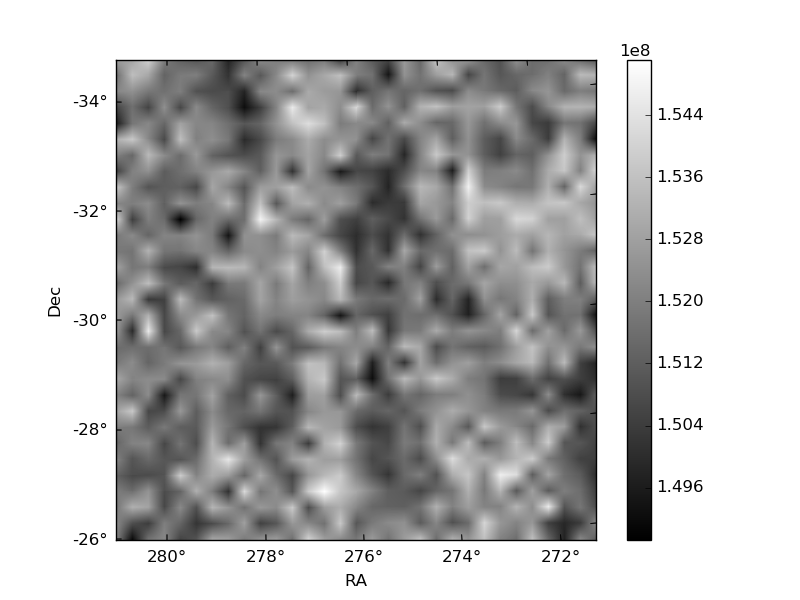
Quadrant B |
|---|---|---|---|
| Quadrant D | 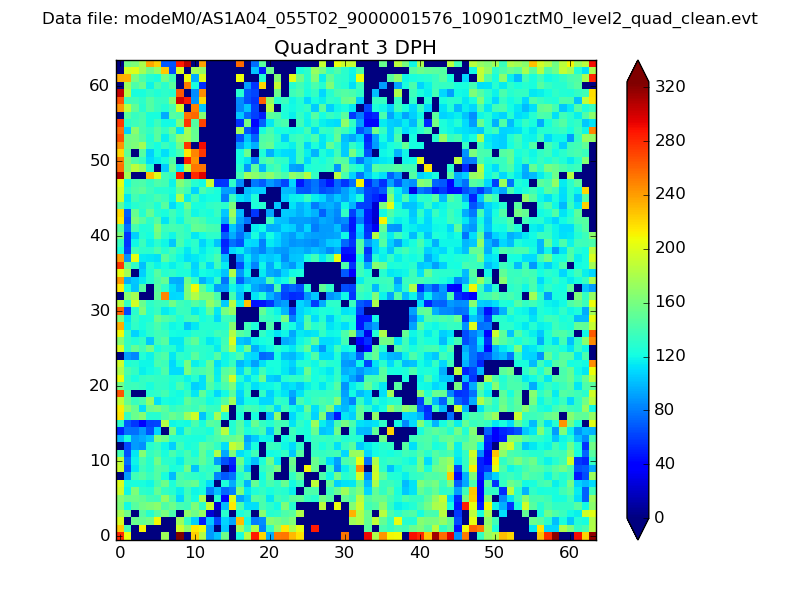 |
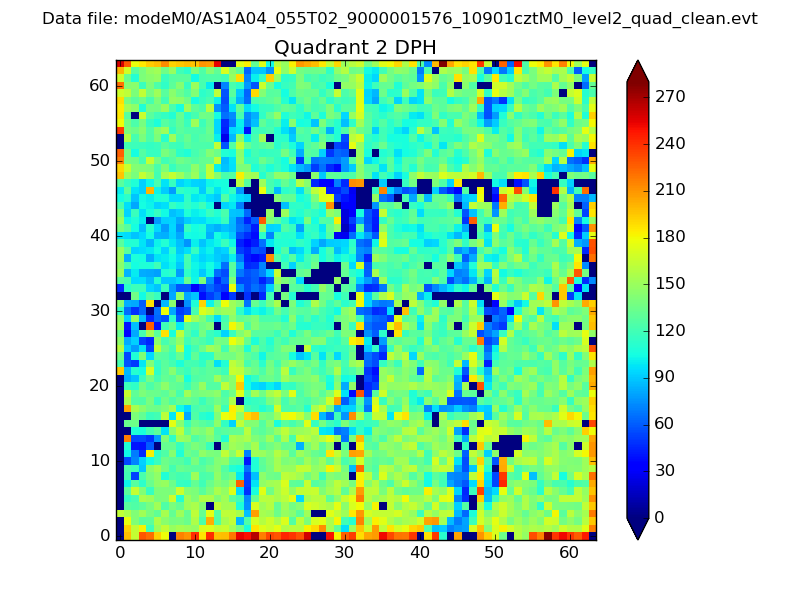 |
Quadrant C |
| Plot type | Count rate plots | Images |
|---|---|---|
| Comparison with Poisson distribution Blue bars denote a histogram of data divided into 1 sec bins. Red curve is a Poisson curve with rate = median count rate of data. |
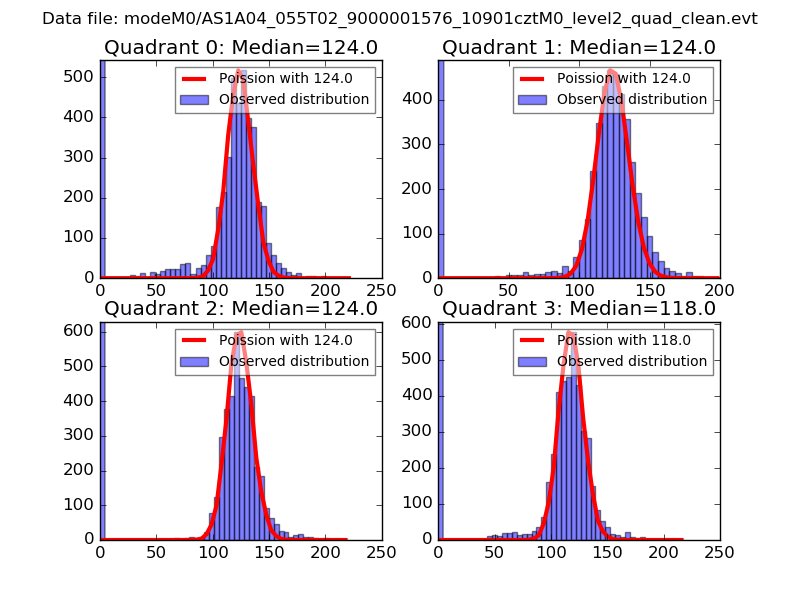 |
 |
| Quadrant-wise count rates Data is divided into 100 sec bins |
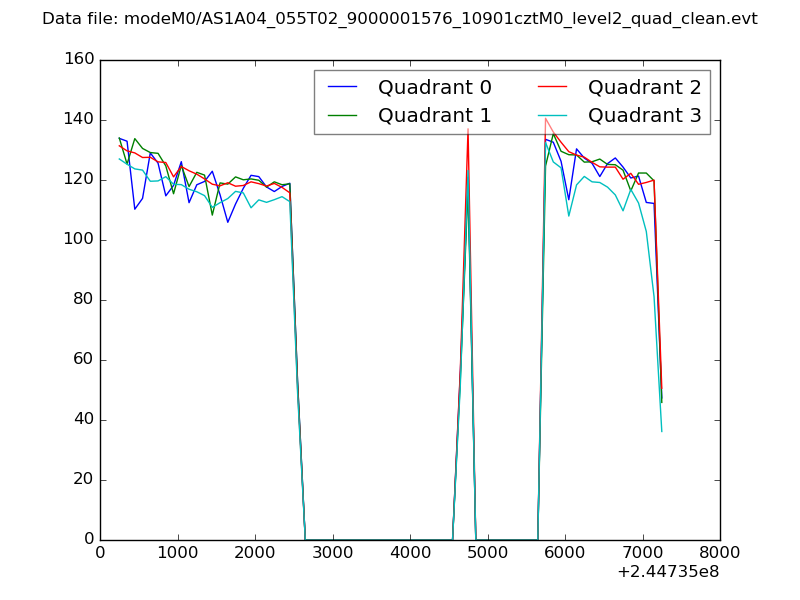 |
|
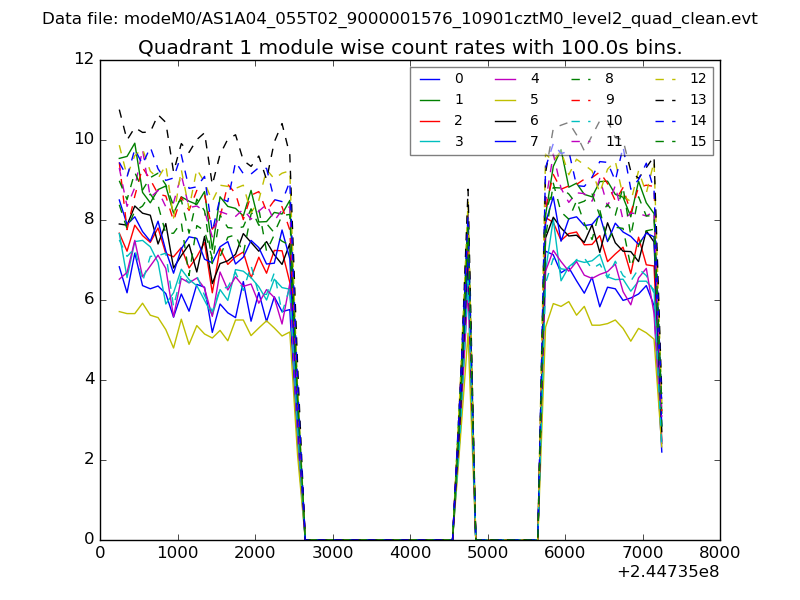
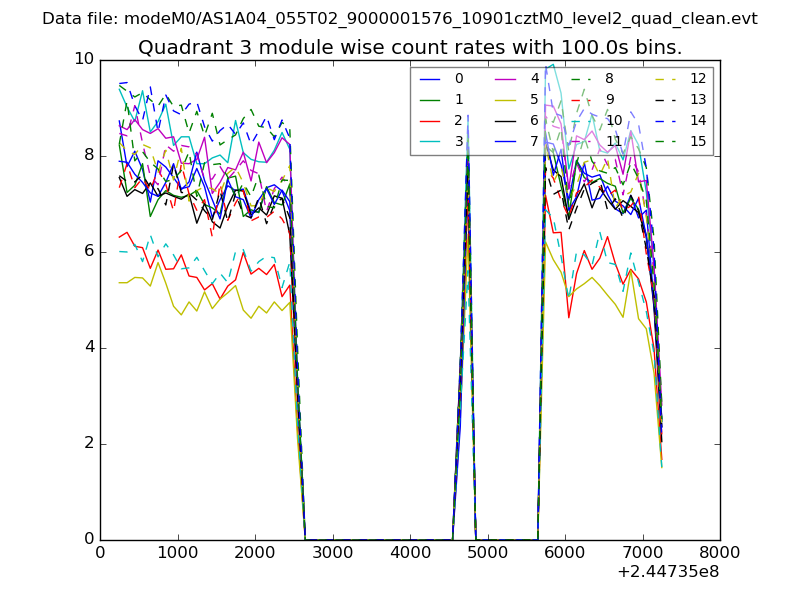
| Module-wise count rates for Quadrant A Data is divided into 100 sec bins |
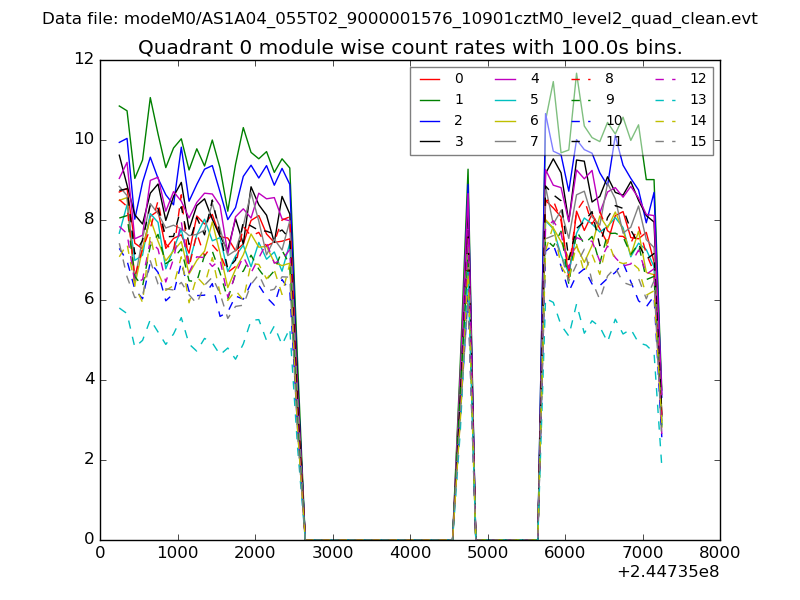 |
 |
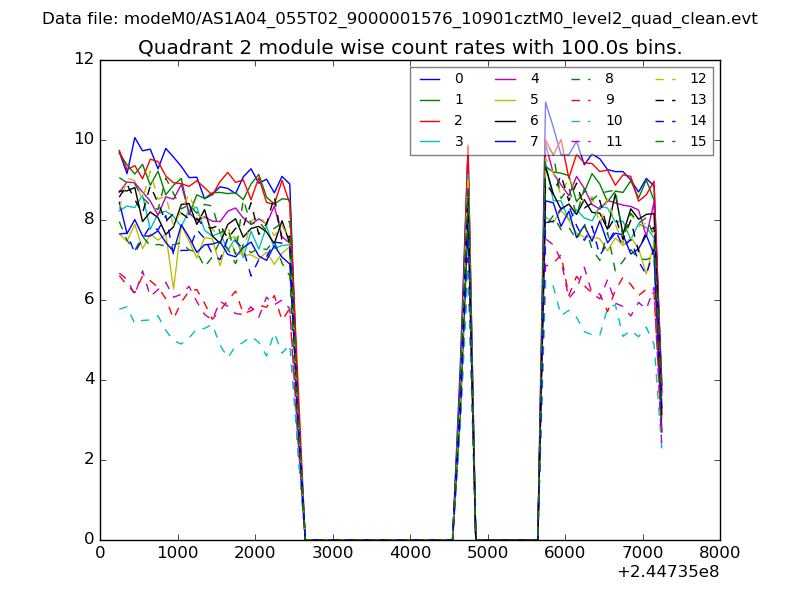
| Module-wise count rates for Quadrant B Data is divided into 100 sec bins |
 |
 |
| Module-wise count rates for Quadrant C Data is divided into 100 sec bins |
 |
 |
| Module-wise count rates for Quadrant D Data is divided into 100 sec bins |
 |
 |
| Parameter | Plot |
|---|---|
| CZT HV Monitor | 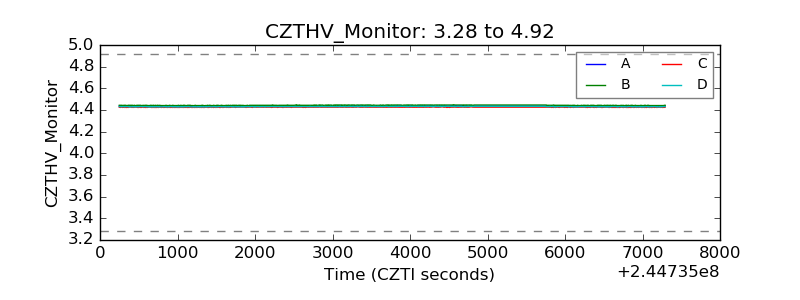 |
| D_VDD | 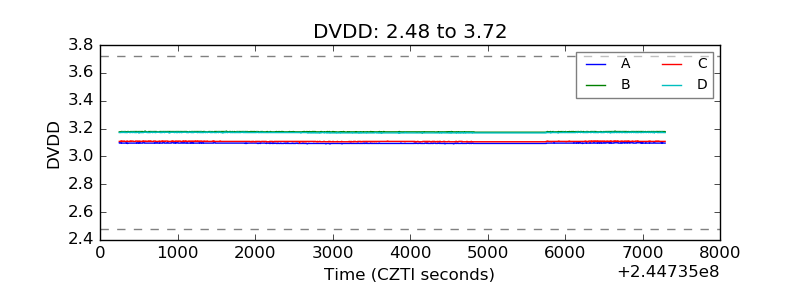 |
| Temperature 1 | 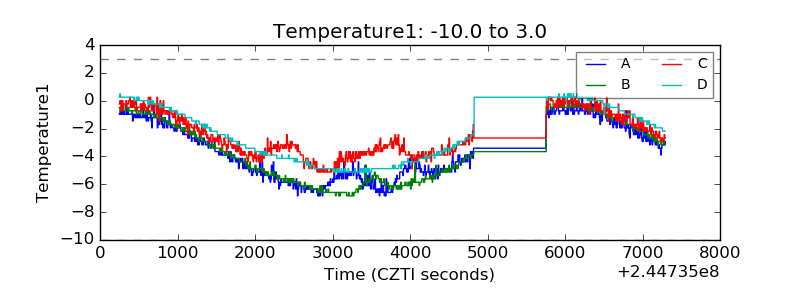 |
| Veto HV Monitor | 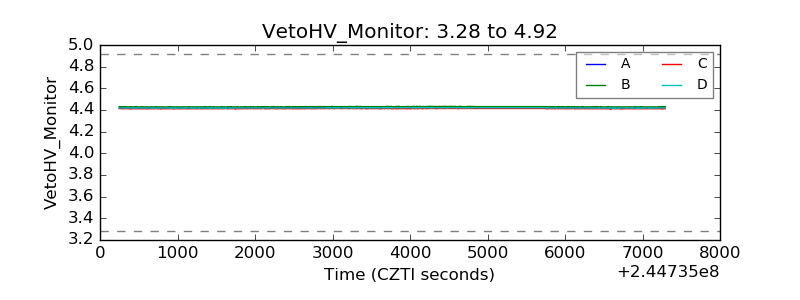 |
| Veto LLD | 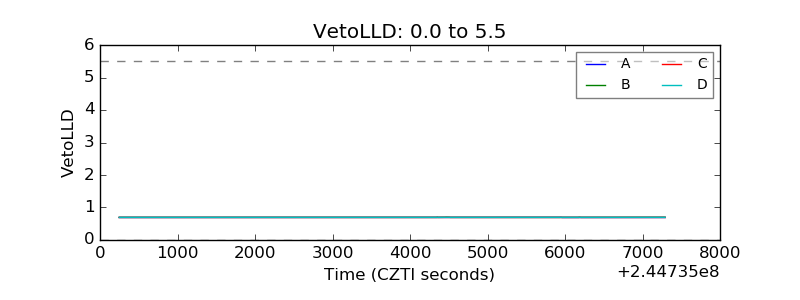 |
| Alpha Counter | 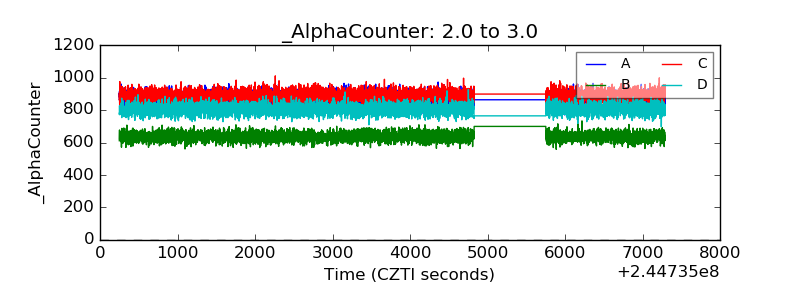 |
| _CPM_Rate | 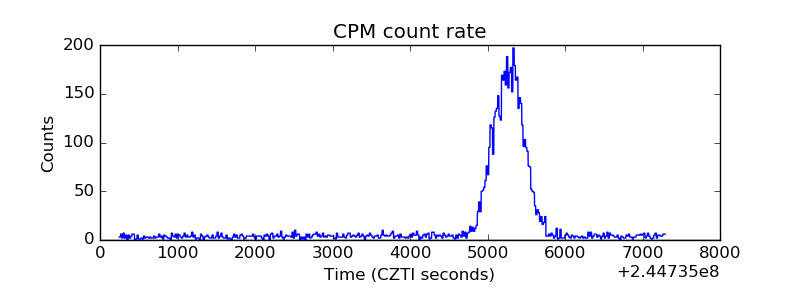 |
| CZT Counter | 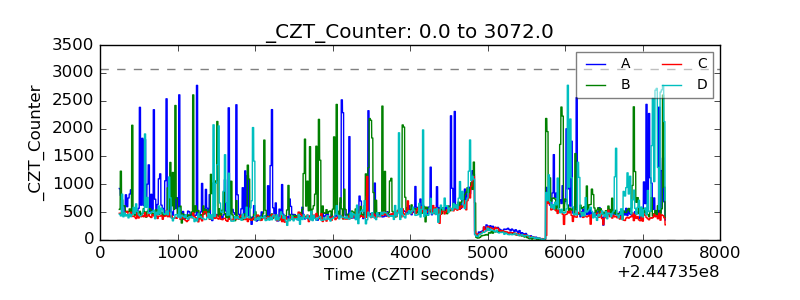 |
| +2.5 Volts monitor |  |
| +5 Volts monitor |  |
| _ROLL_ROT | 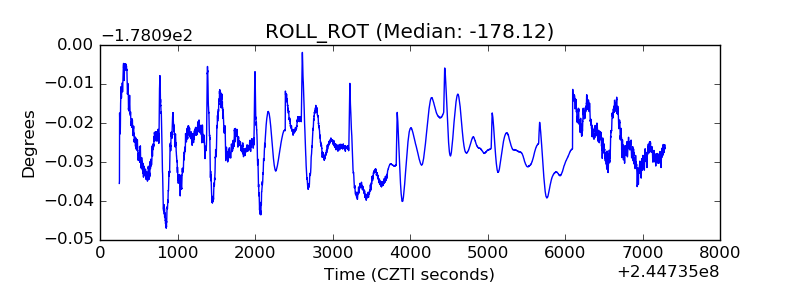 |
| _Roll_DEC | 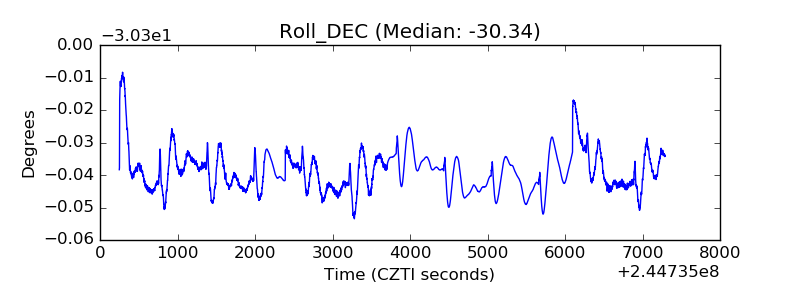 |
| _Roll_RA | 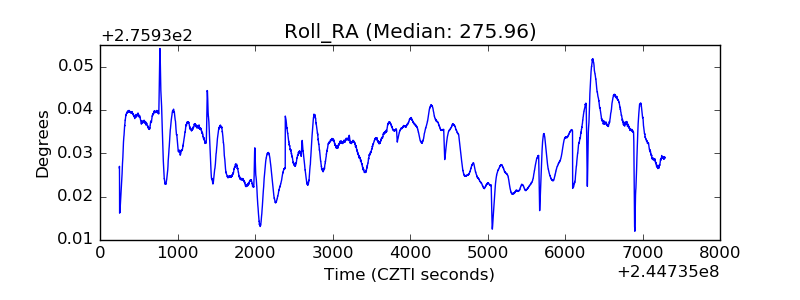 |
| Veto Counter | 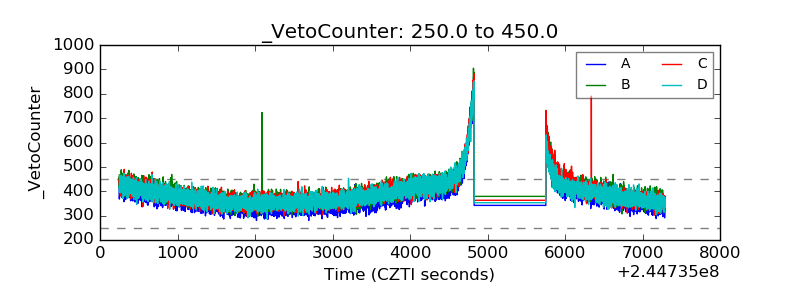 |