| Param | Original file | Final file |
|---|---|---|
| Filename | modeM0/AS1A04_055T02_9000001576_10902cztM0_level2.evt | modeM0/AS1A04_055T02_9000001576_10902cztM0_level2_quad_clean.evt |
| Size (bytes) | 602,858,880 | 87,160,320 |
| Size | 574.9 MB | 83.1 MB |
| Events in quadrant A | 4,778,955 | 549,202 |
| Events in quadrant B | 4,961,110 | 549,460 |
| Events in quadrant C | 2,960,408 | 564,966 |
| Events in quadrant D | 5,104,464 | 509,599 |
| Mode M9 | |||
|---|---|---|---|
| Quadrant | BADHDUFLAG | Total packets | Discarded packets |
| A | 0 | 6 | 0 |
| B | 0 | 6 | 0 |
| C | 0 | 6 | 0 |
| D | 0 | 6 | 0 |
| Mode SS | |||
|---|---|---|---|
| Quadrant | BADHDUFLAG | Total packets | Discarded packets |
| A | 0 | 134 | 0 |
| B | 0 | 134 | 0 |
| C | 0 | 134 | 0 |
| D | 0 | 134 | 0 |
| Mode M0 | |||
|---|---|---|---|
| Quadrant | BADHDUFLAG | Total packets | Discarded packets |
| A | 0 | 18794 | 2 |
| B | 0 | 19155 | 1 |
| C | 0 | 13652 | 3 |
| D | 0 | 19796 | 1 |
| Quadrant | Total seconds | Saturated seconds | Saturation percentage |
|---|---|---|---|
| A | 6686 | 396 | 5.922824% |
| B | 6686 | 530 | 7.927012% |
| C | 6685 | 14 | 0.209424% |
| D | 6686 | 622 | 9.303021% |
Noise dominated data is calculated using 1-second bins in cleaned event files. If a bin has >2000 counts, and if more than 50% of those come from <1% of pixels, then it is considered to be noise-dominated and hence unusable.
| Quadrant | # 1 sec bins | Bins with >0 counts | Bins with >2000 counts | High rate bins dominated by noise | Noise dominated (total time) | Noise dominated (detector-on time) | Marked lightcurve |
|---|---|---|---|---|---|---|---|
| A | 7221 | 6687 | 270 | 270 | 3.74% | 4.04% | 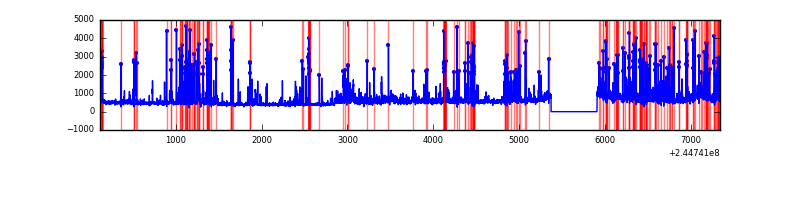 |
| B | 7221 | 6687 | 321 | 321 | 4.45% | 4.80% | 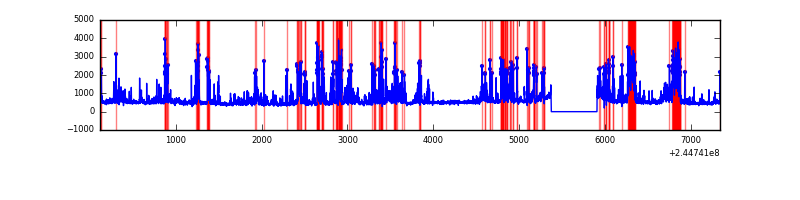 |
| C | 7221 | 6687 | 1 | 1 | 0.01% | 0.01% | 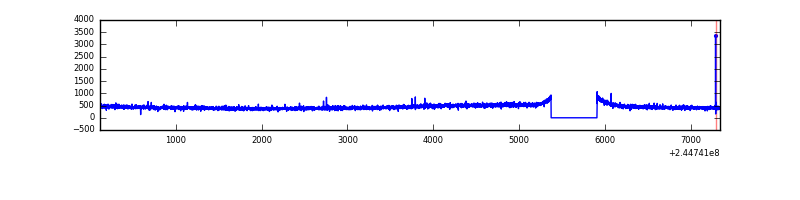 |
| D | 7221 | 6686 | 534 | 534 | 7.40% | 7.99% | 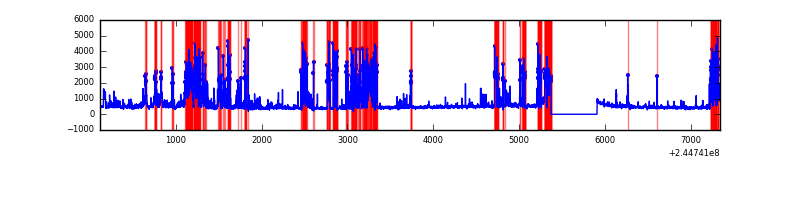 |
Top three noisy pixels from each quadrant. If the there are fewer than three noisy pixels in the level2.evt file, extra rows are filled as -1
| Pixel properties | Quadrant properties | ||||||
|---|---|---|---|---|---|---|---|
| Quadrant | DetID | PixID | Counts | Sigma | Mean | Median | Sigma |
| A | 8 | 5 | 1258443 | 7971.18 | 768 | 752 | 157.8 |
| A | 13 | 251 | 478340 | 3026.93 | 768 | 752 | 157.8 |
| A | 15 | 223 | 32936 | 203.98 | 768 | 752 | 157.8 |
| B | 4 | 239 | 1752328 | 11946.37 | 767 | 750 | 146.6 |
| B | 10 | 245 | 65195 | 439.54 | 767 | 750 | 146.6 |
| B | 11 | 51 | 41596 | 278.58 | 767 | 750 | 146.6 |
| C | 14 | 234 | 5904 | 29.17 | 757 | 760 | 176.3 |
| C | 13 | 61 | 5824 | 28.72 | 757 | 760 | 176.3 |
| C | 8 | 222 | 3918 | 17.91 | 757 | 760 | 176.3 |
| D | 1 | 52 | 1407383 | 8073.11 | 719 | 698 | 174.2 |
| D | 10 | 199 | 630152 | 3612.5 | 719 | 698 | 174.2 |
| D | 7 | 71 | 176555 | 1009.26 | 719 | 698 | 174.2 |
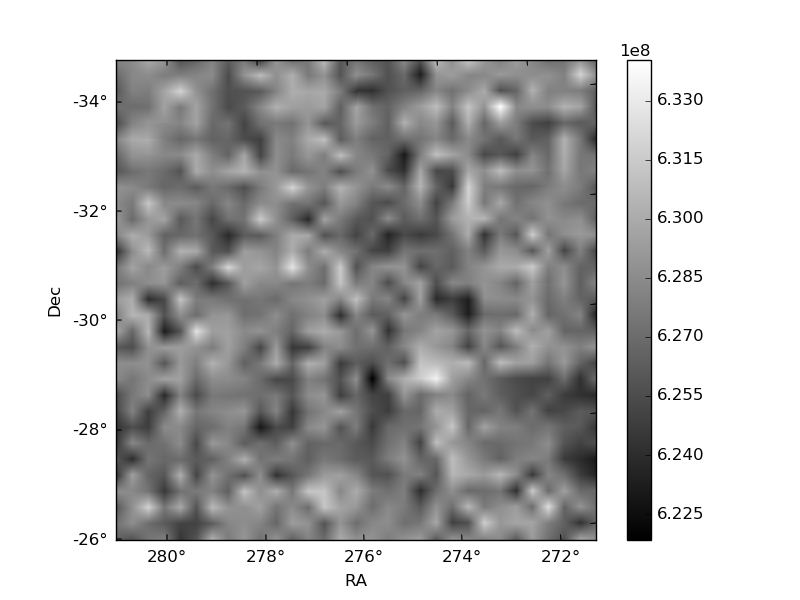
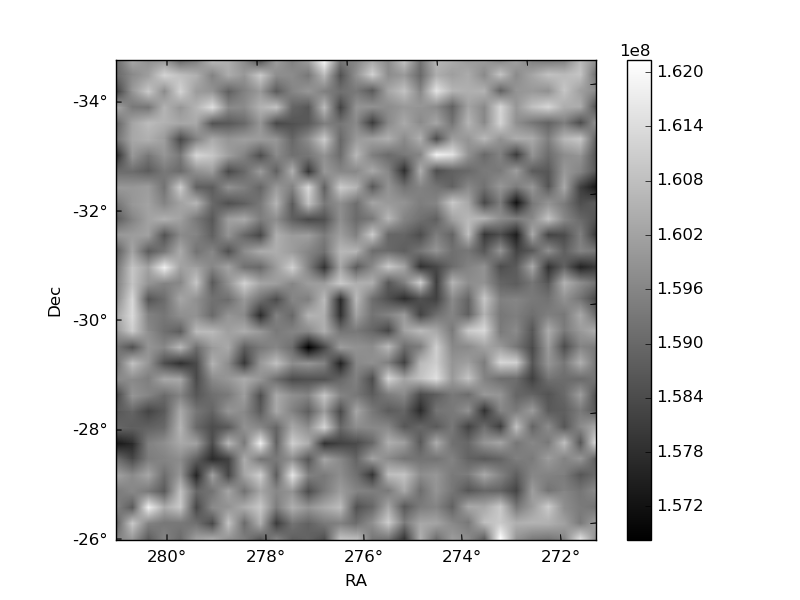
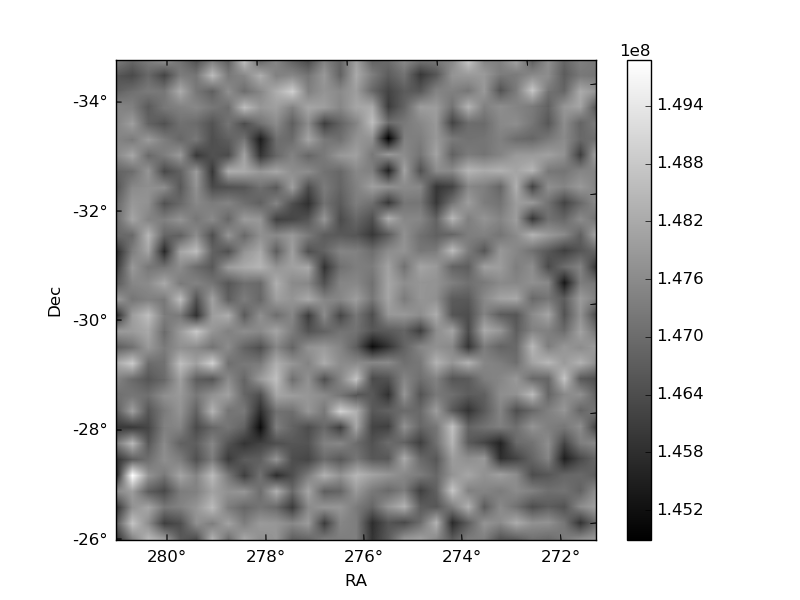
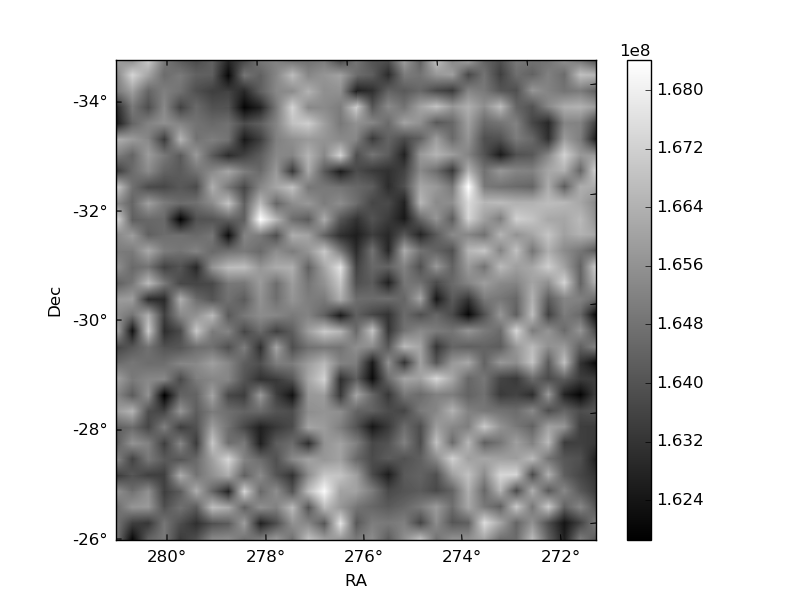
Histogram calculated using DETX and DETY for each event in the final _common_clean file
| Quadrant A | 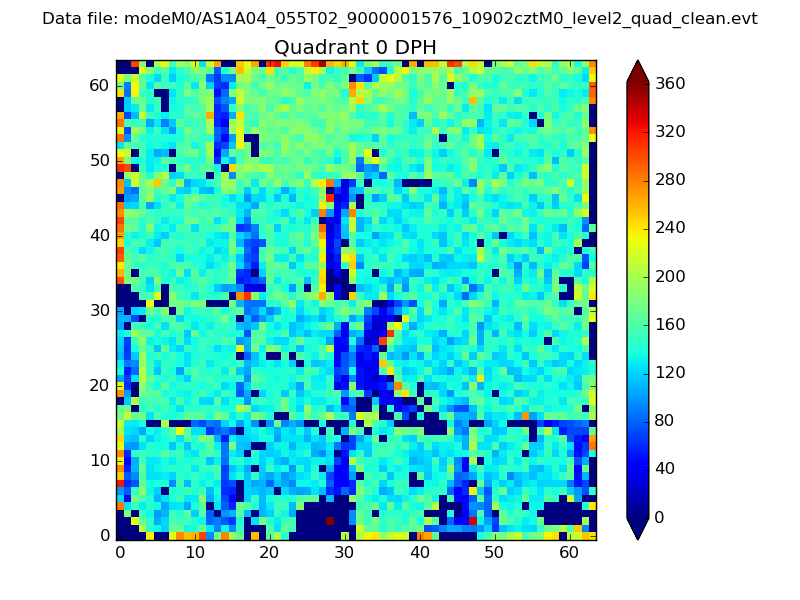 |
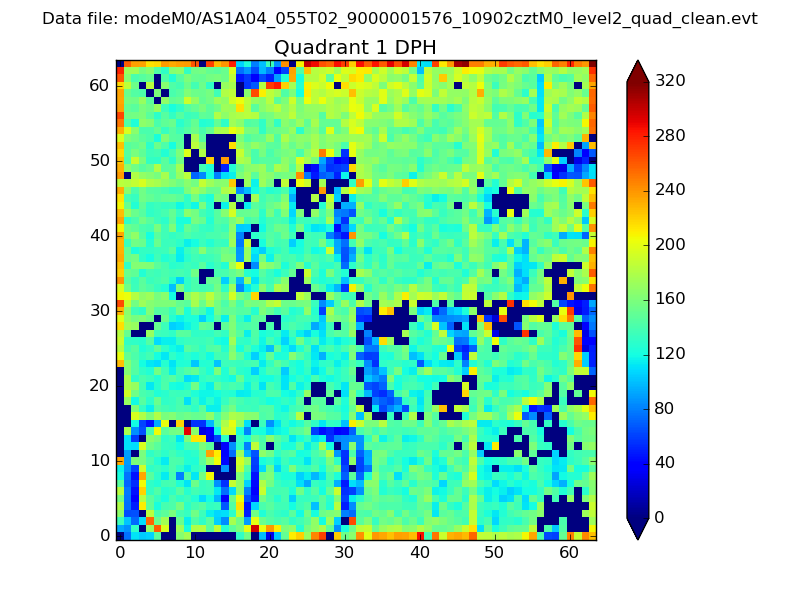 |
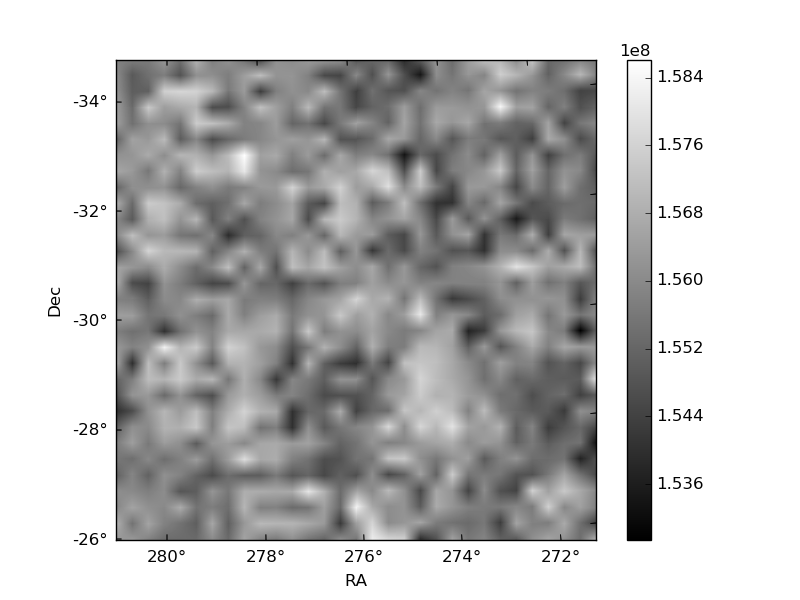
Quadrant B |
|---|---|---|---|
| Quadrant D | 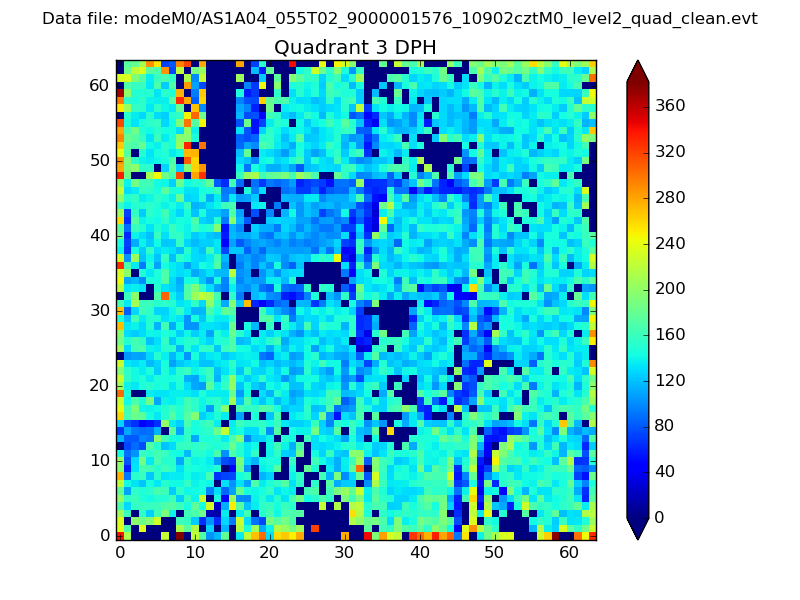 |
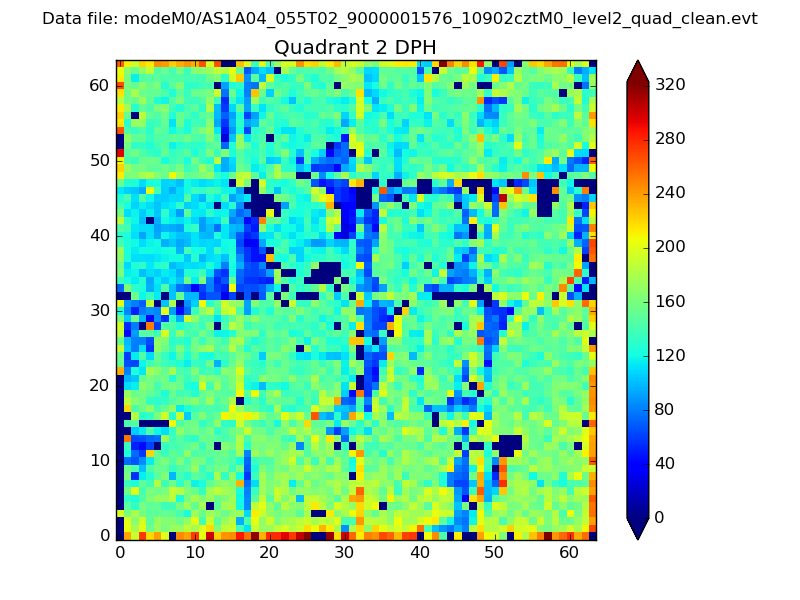 |
Quadrant C |
| Plot type | Count rate plots | Images |
|---|---|---|
| Comparison with Poisson distribution Blue bars denote a histogram of data divided into 1 sec bins. Red curve is a Poisson curve with rate = median count rate of data. |
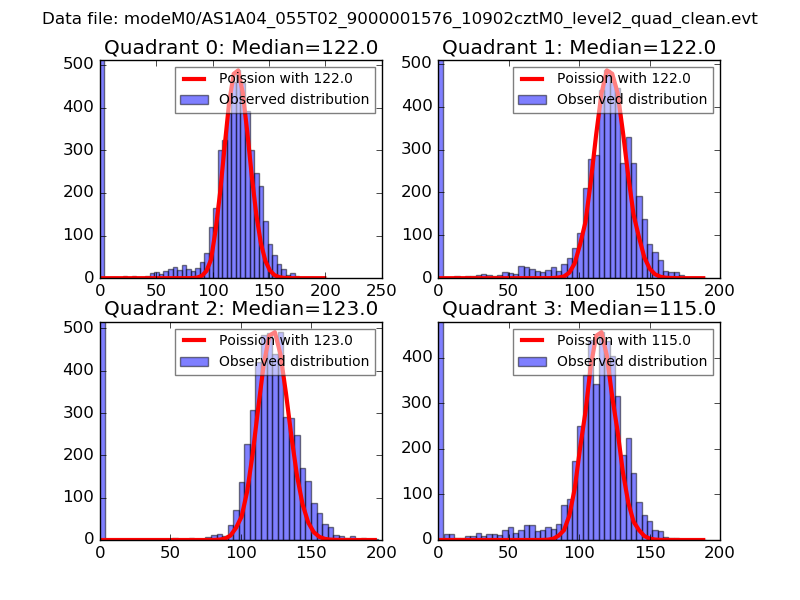 |
 |
| Quadrant-wise count rates Data is divided into 100 sec bins |
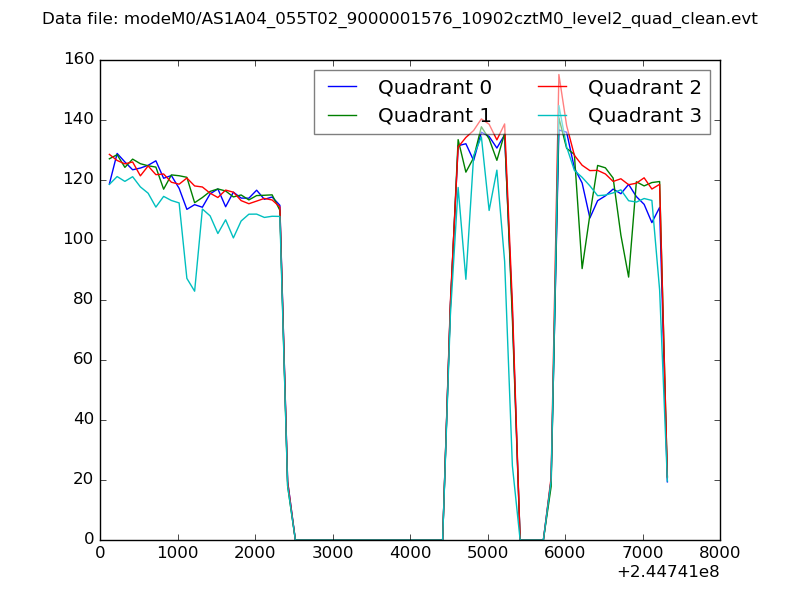 |
|
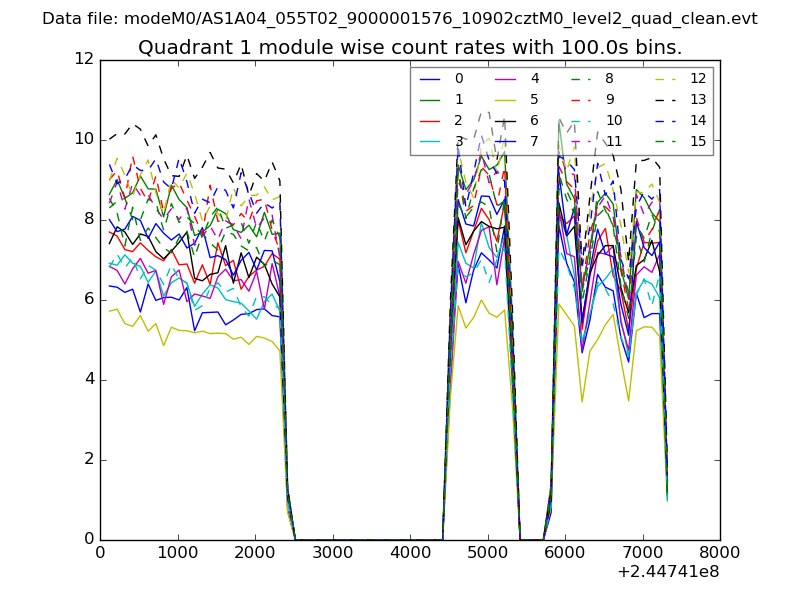
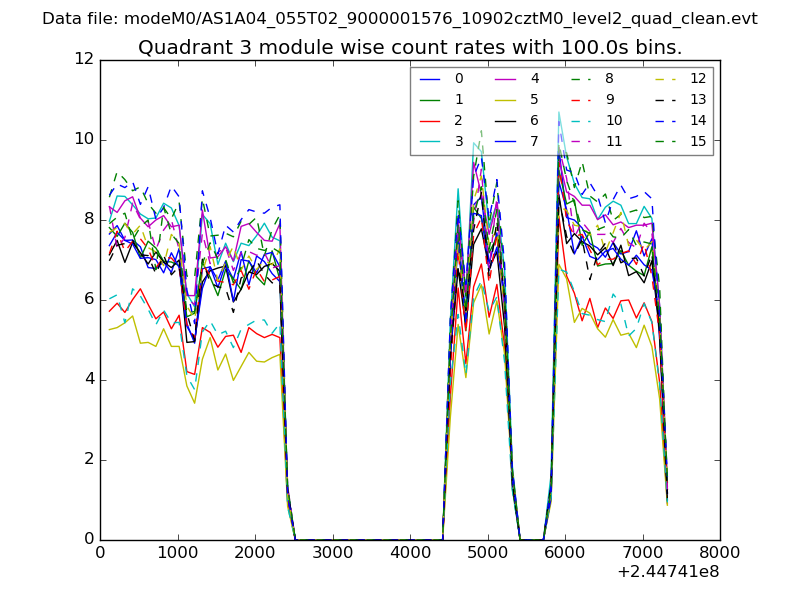
| Module-wise count rates for Quadrant A Data is divided into 100 sec bins |
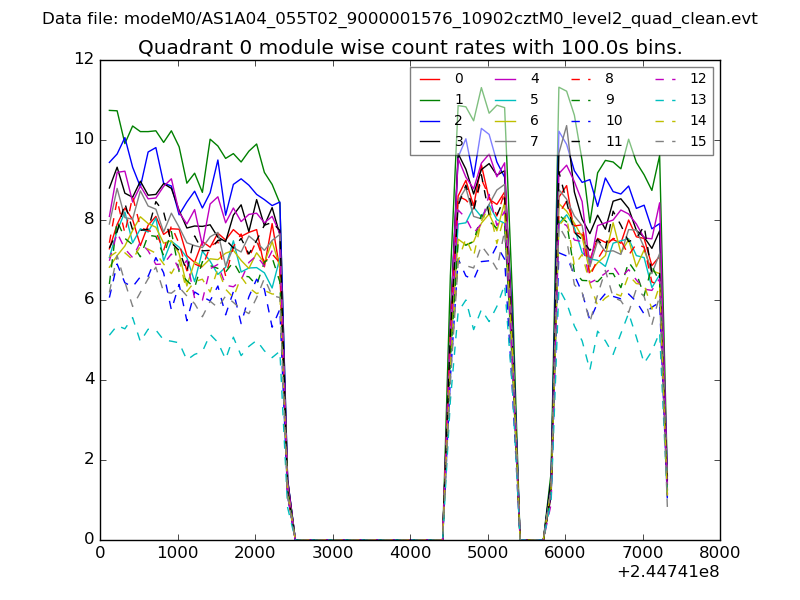 |
 |
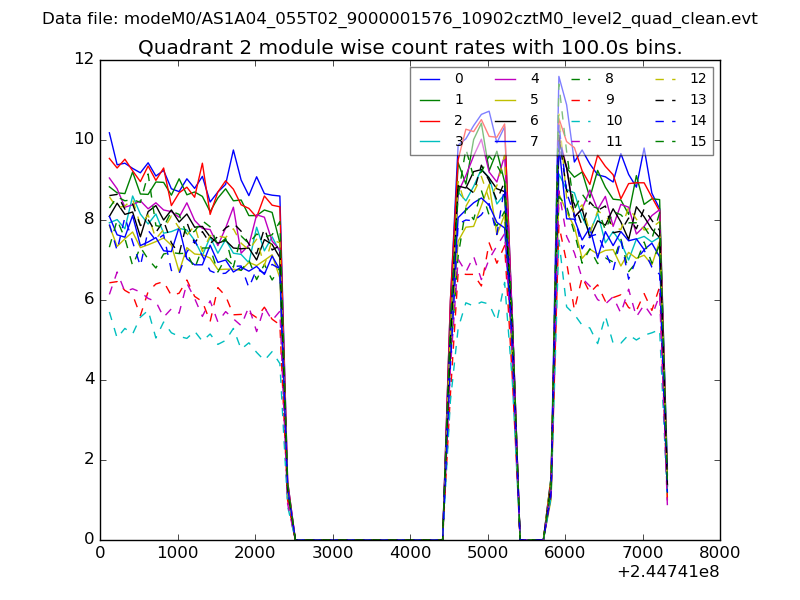
| Module-wise count rates for Quadrant B Data is divided into 100 sec bins |
 |
 |
| Module-wise count rates for Quadrant C Data is divided into 100 sec bins |
 |
 |
| Module-wise count rates for Quadrant D Data is divided into 100 sec bins |
 |
 |
| Parameter | Plot |
|---|---|
| CZT HV Monitor | 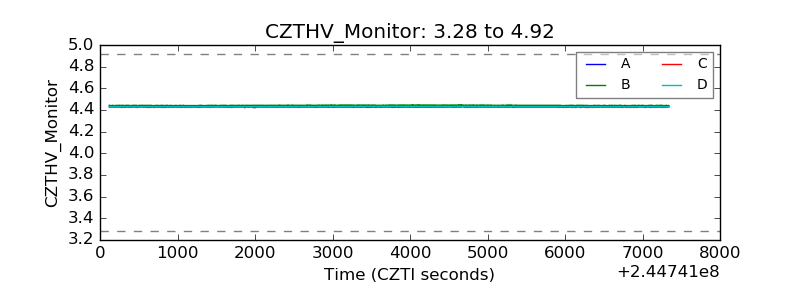 |
| D_VDD | 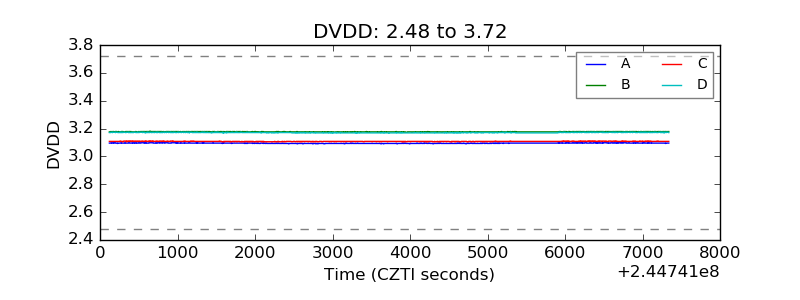 |
| Temperature 1 | 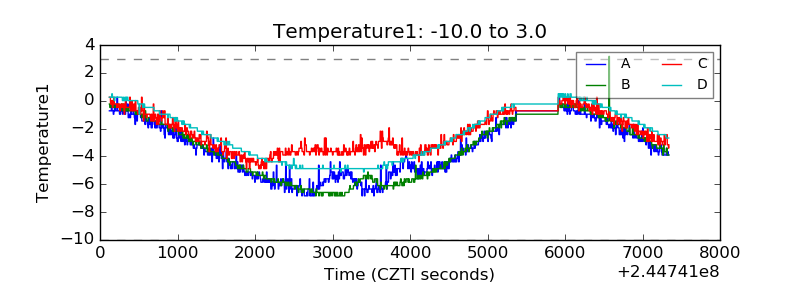 |
| Veto HV Monitor | 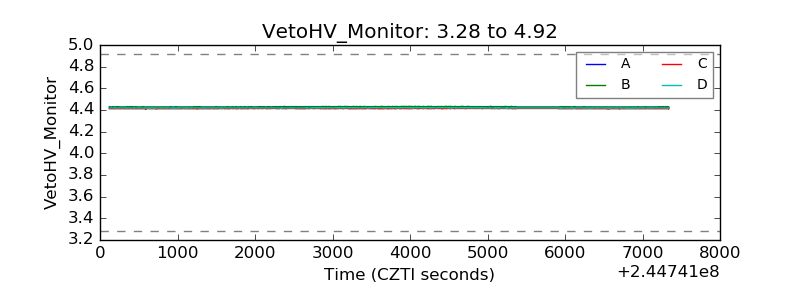 |
| Veto LLD | 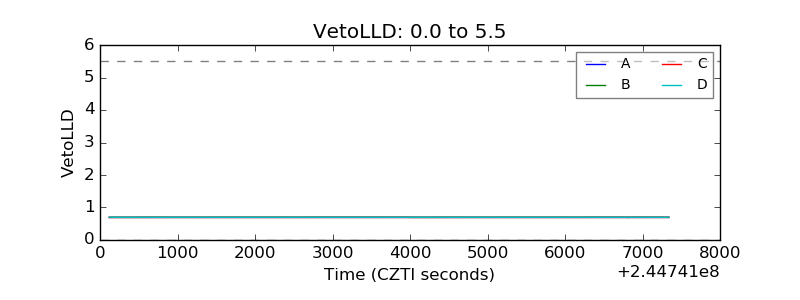 |
| Alpha Counter | 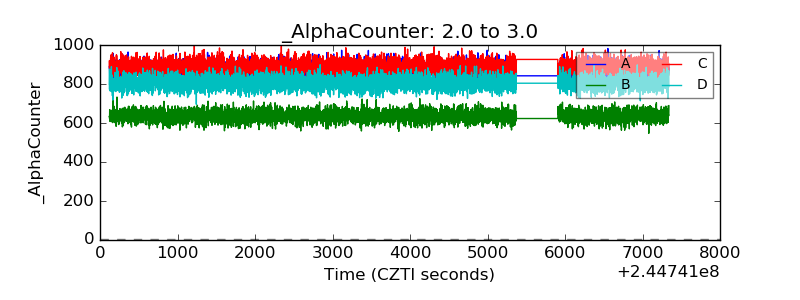 |
| _CPM_Rate | 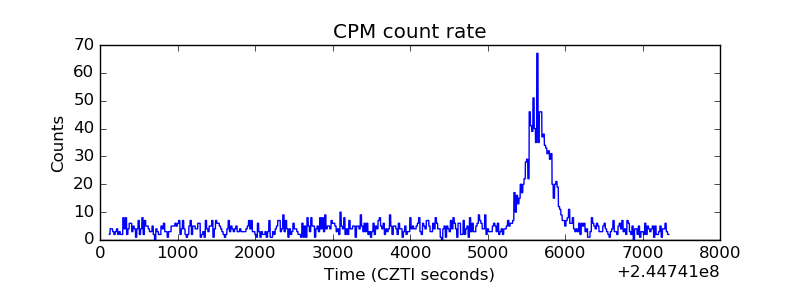 |
| CZT Counter | 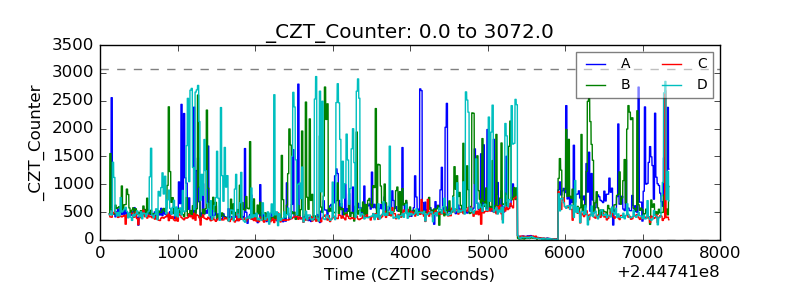 |
| +2.5 Volts monitor |  |
| +5 Volts monitor | 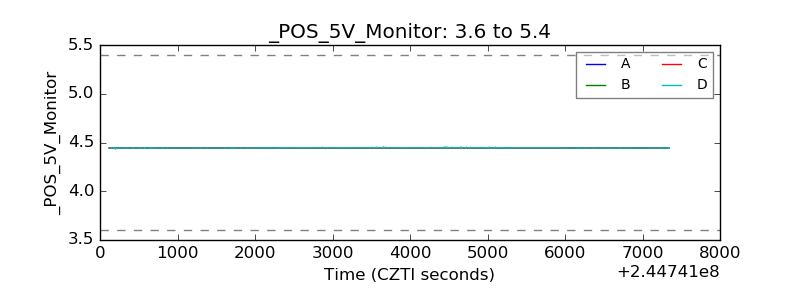 |
| _ROLL_ROT | 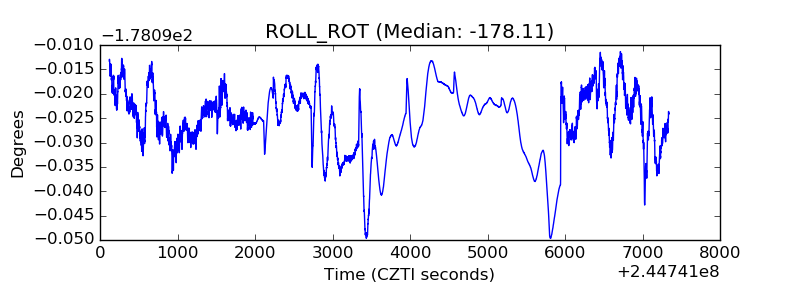 |
| _Roll_DEC | 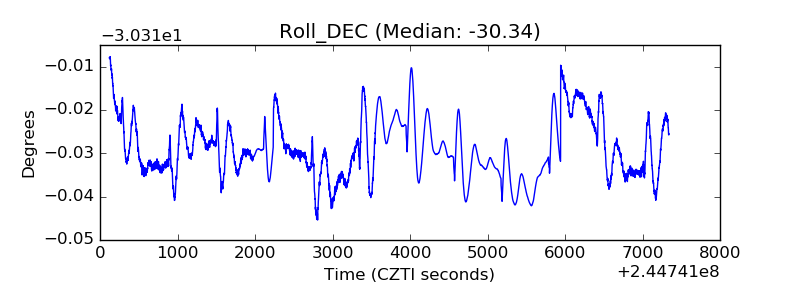 |
| _Roll_RA | 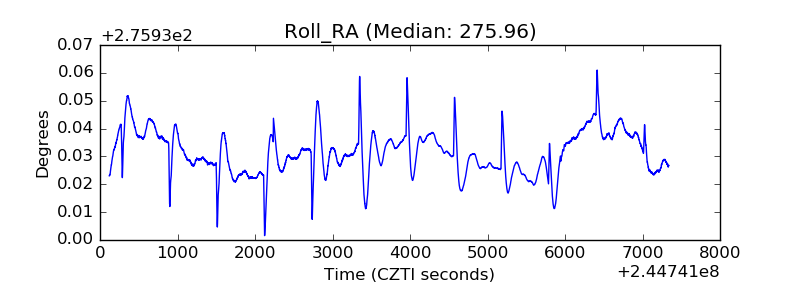 |
| Veto Counter | 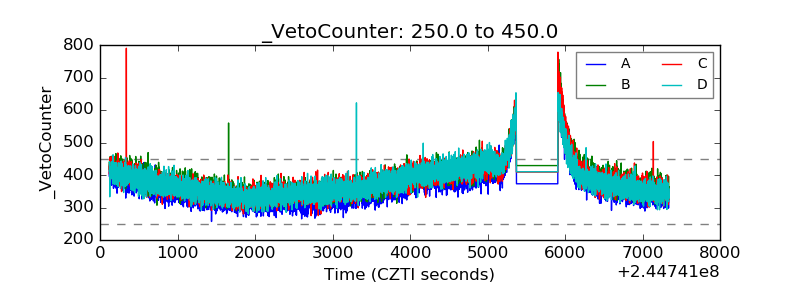 |