| Param | Original file | Final file |
|---|---|---|
| Filename | modeM0/AS1A04_055T02_9000001576_10904cztM0_level2.evt | modeM0/AS1A04_055T02_9000001576_10904cztM0_level2_quad_clean.evt |
| Size (bytes) | 752,564,160 | 102,493,440 |
| Size | 717.7 MB | 97.7 MB |
| Events in quadrant A | 6,296,558 | 641,916 |
| Events in quadrant B | 5,202,883 | 670,366 |
| Events in quadrant C | 3,398,501 | 671,281 |
| Events in quadrant D | 7,376,532 | 587,835 |
| Mode M9 | |||
|---|---|---|---|
| Quadrant | BADHDUFLAG | Total packets | Discarded packets |
| A | 0 | 4 | 0 |
| B | 0 | 4 | 0 |
| C | 0 | 4 | 0 |
| D | 0 | 4 | 0 |
| Mode SS | |||
|---|---|---|---|
| Quadrant | BADHDUFLAG | Total packets | Discarded packets |
| A | 0 | 158 | 0 |
| B | 0 | 158 | 0 |
| C | 0 | 158 | 0 |
| D | 0 | 158 | 0 |
| Mode M0 | |||
|---|---|---|---|
| Quadrant | BADHDUFLAG | Total packets | Discarded packets |
| A | 0 | 23978 | 4 |
| B | 0 | 20535 | 3 |
| C | 0 | 15679 | 3 |
| D | 0 | 27254 | 3 |
| Quadrant | Total seconds | Saturated seconds | Saturation percentage |
|---|---|---|---|
| A | 7642 | 632 | 8.270086% |
| B | 7642 | 466 | 6.097880% |
| C | 7642 | 39 | 0.510338% |
| D | 7642 | 1238 | 16.199948% |
Noise dominated data is calculated using 1-second bins in cleaned event files. If a bin has >2000 counts, and if more than 50% of those come from <1% of pixels, then it is considered to be noise-dominated and hence unusable.
| Quadrant | # 1 sec bins | Bins with >0 counts | Bins with >2000 counts | High rate bins dominated by noise | Noise dominated (total time) | Noise dominated (detector-on time) | Marked lightcurve |
|---|---|---|---|---|---|---|---|
| A | 8082 | 7646 | 375 | 375 | 4.64% | 4.90% | 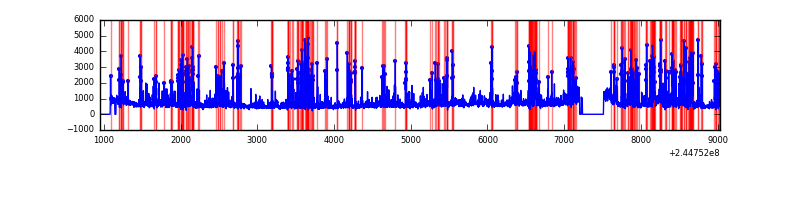 |
| B | 8082 | 7646 | 252 | 252 | 3.12% | 3.30% | 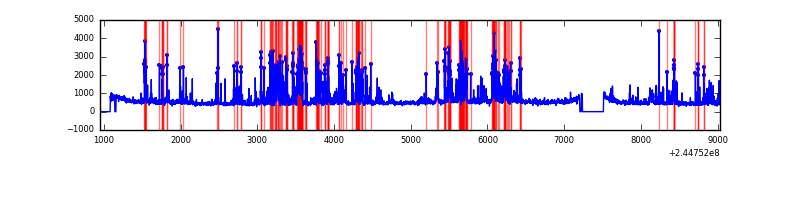 |
| C | 8082 | 7646 | 1 | 1 | 0.01% | 0.01% | 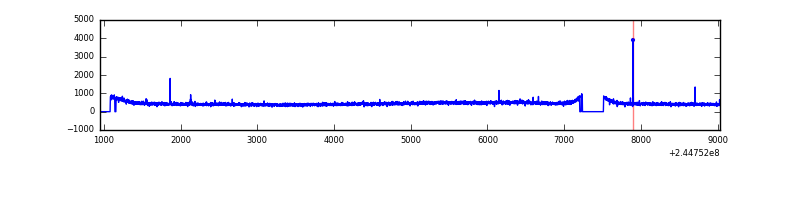 |
| D | 8082 | 7646 | 1092 | 1092 | 13.51% | 14.28% | 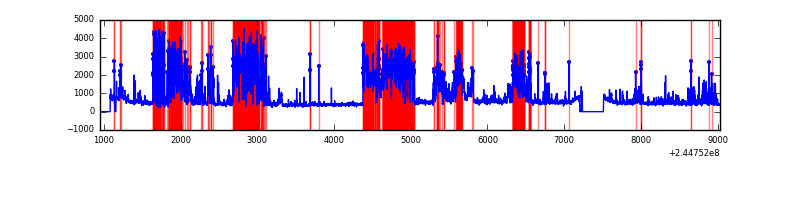 |
Top three noisy pixels from each quadrant. If the there are fewer than three noisy pixels in the level2.evt file, extra rows are filled as -1
| Pixel properties | Quadrant properties | ||||||
|---|---|---|---|---|---|---|---|
| Quadrant | DetID | PixID | Counts | Sigma | Mean | Median | Sigma |
| A | 8 | 5 | 1379887 | 7754.29 | 870 | 853 | 177.8 |
| A | 13 | 251 | 1291623 | 7257.99 | 870 | 853 | 177.8 |
| A | 0 | 254 | 117644 | 656.71 | 870 | 853 | 177.8 |
| B | 4 | 239 | 1444475 | 8458.32 | 888 | 866 | 170.7 |
| B | 10 | 245 | 91324 | 530.01 | 888 | 866 | 170.7 |
| B | 0 | 219 | 33809 | 193.02 | 888 | 866 | 170.7 |
| C | 14 | 234 | 12400 | 56.76 | 866 | 870 | 203.1 |
| C | 13 | 61 | 6584 | 28.13 | 866 | 870 | 203.1 |
| C | 4 | 222 | 5397 | 22.29 | 866 | 870 | 203.1 |
| D | 13 | 152 | 2233274 | 11464.49 | 803 | 779 | 194.7 |
| D | 5 | 222 | 580478 | 2976.92 | 803 | 779 | 194.7 |
| D | 13 | 122 | 483676 | 2479.81 | 803 | 779 | 194.7 |
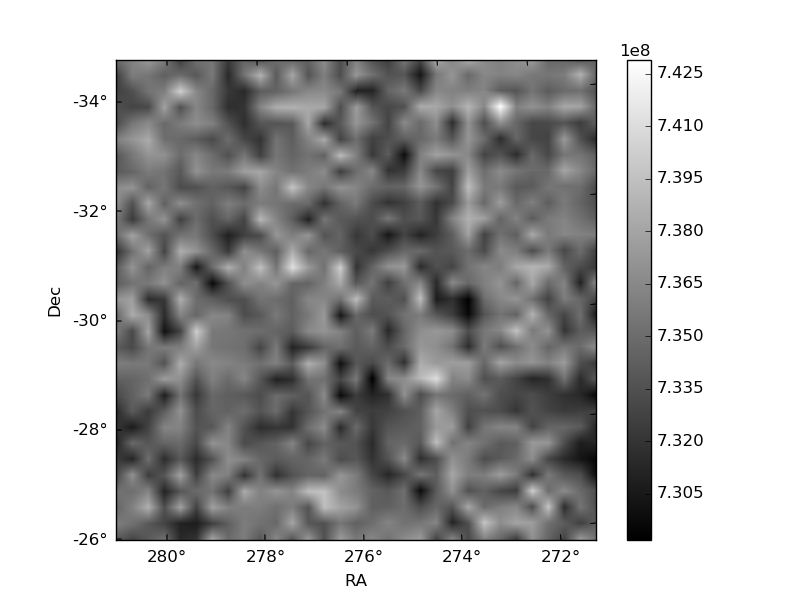
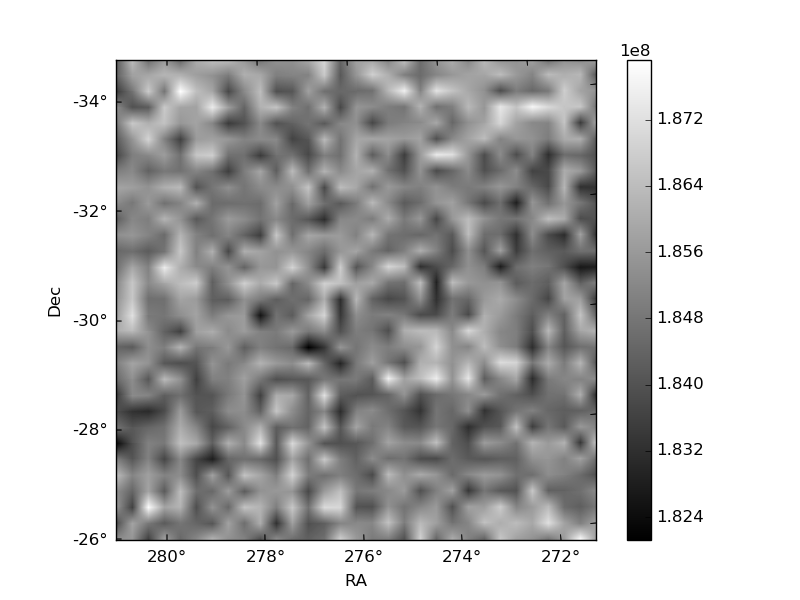
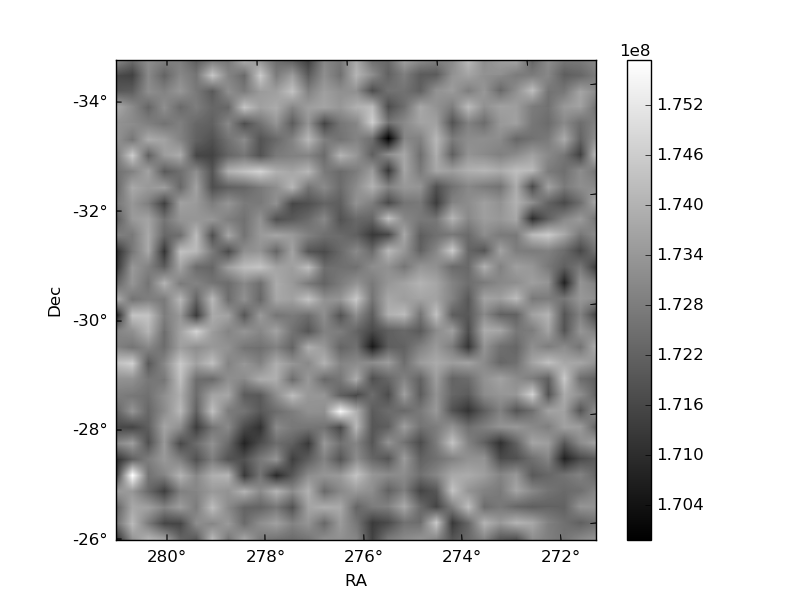
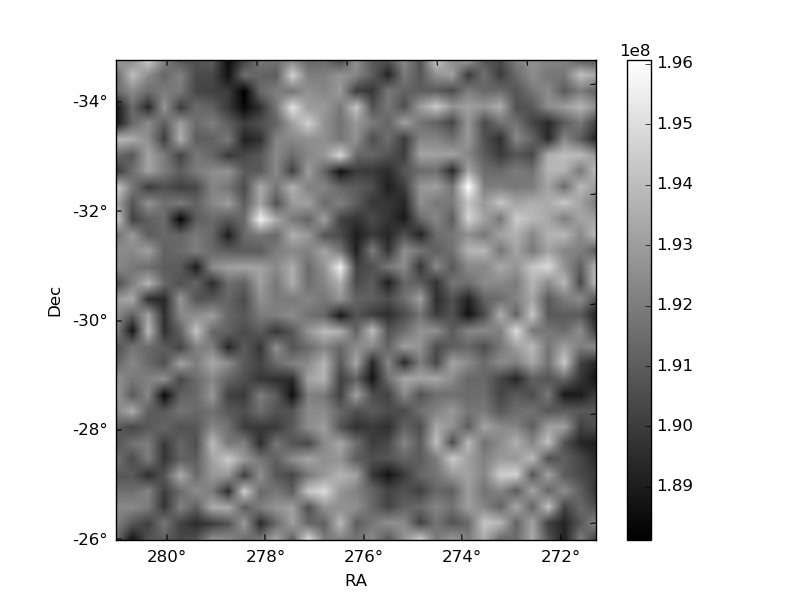
Histogram calculated using DETX and DETY for each event in the final _common_clean file
| Quadrant A | 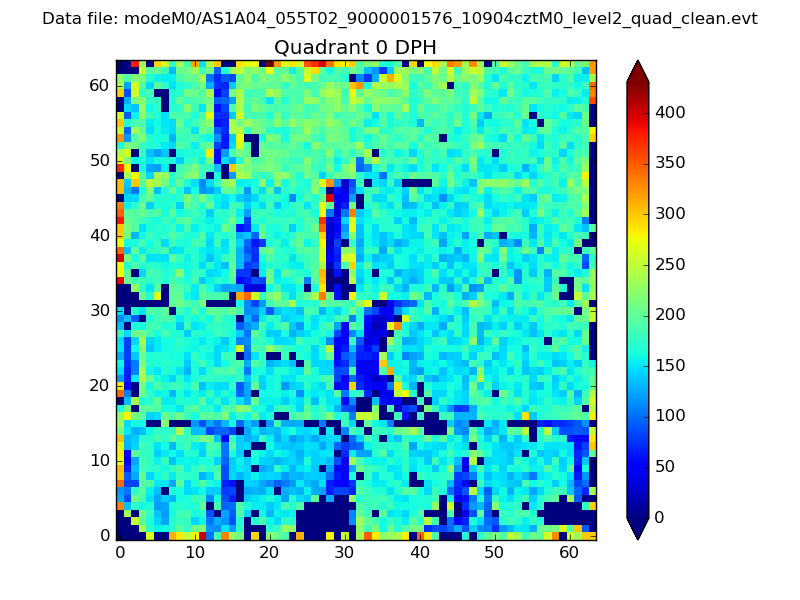 |
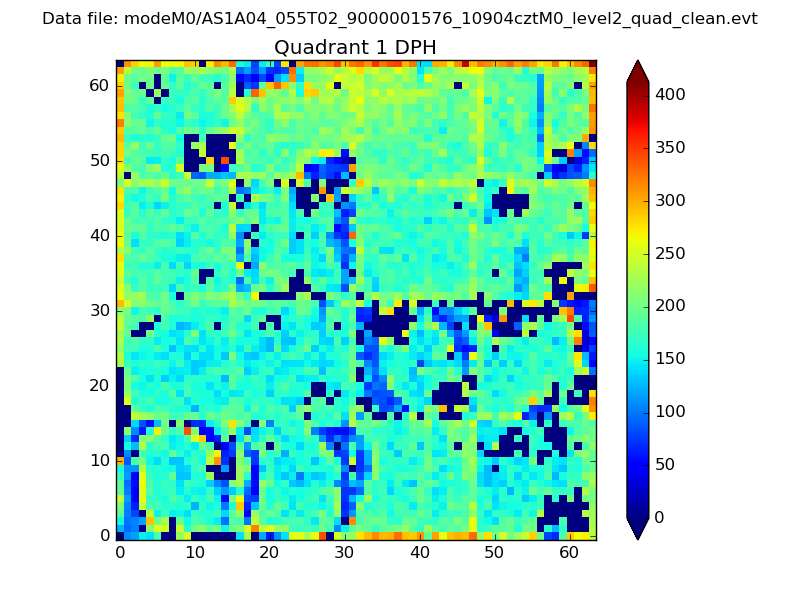 |
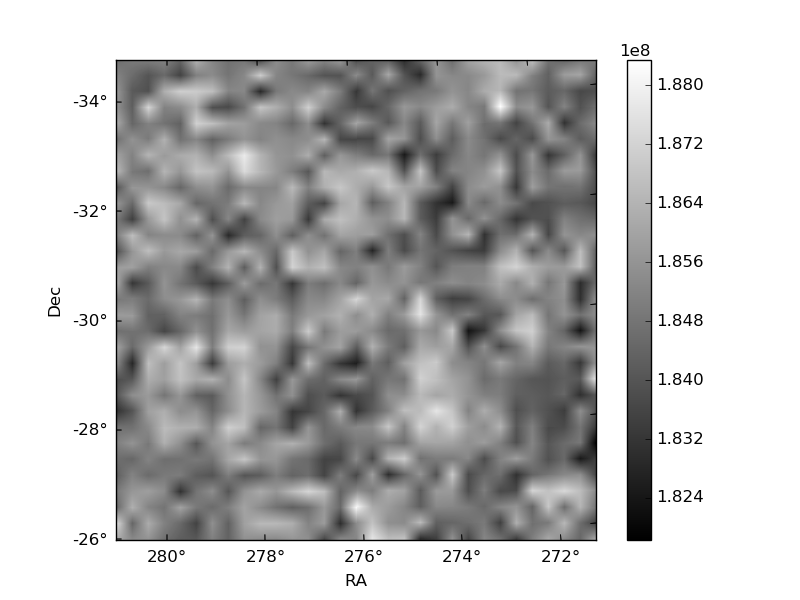
Quadrant B |
|---|---|---|---|
| Quadrant D | 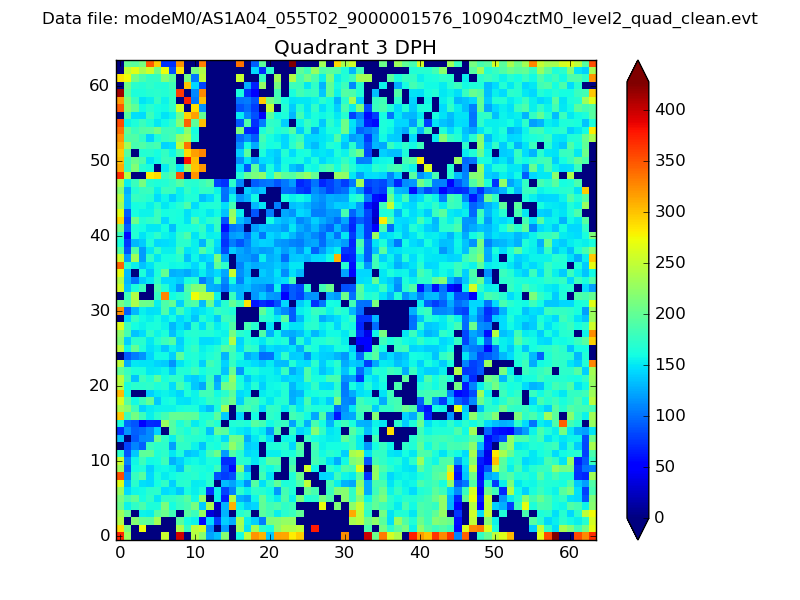 |
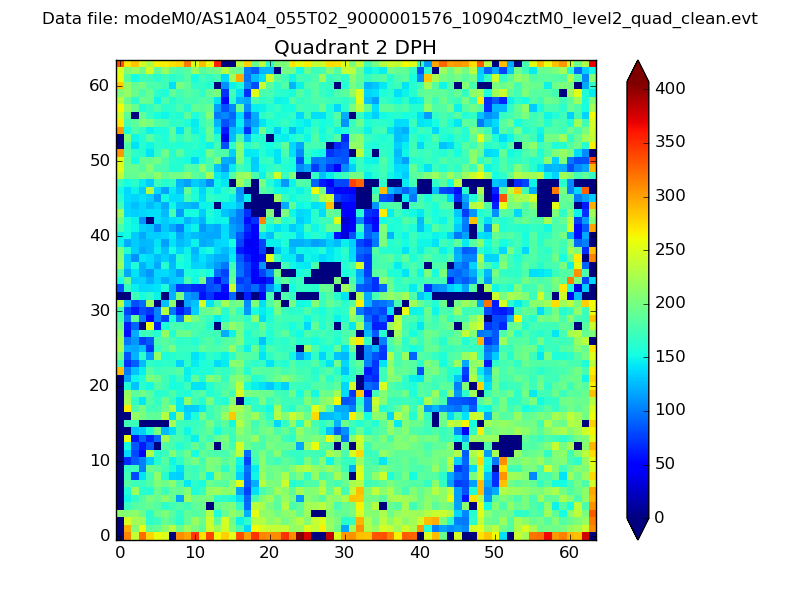 |
Quadrant C |
| Plot type | Count rate plots | Images |
|---|---|---|
| Comparison with Poisson distribution Blue bars denote a histogram of data divided into 1 sec bins. Red curve is a Poisson curve with rate = median count rate of data. |
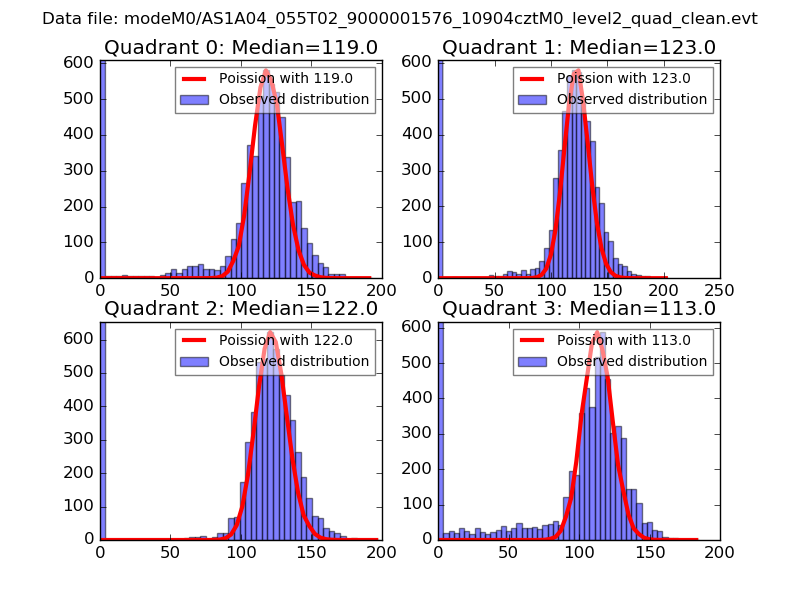 |
 |
| Quadrant-wise count rates Data is divided into 100 sec bins |
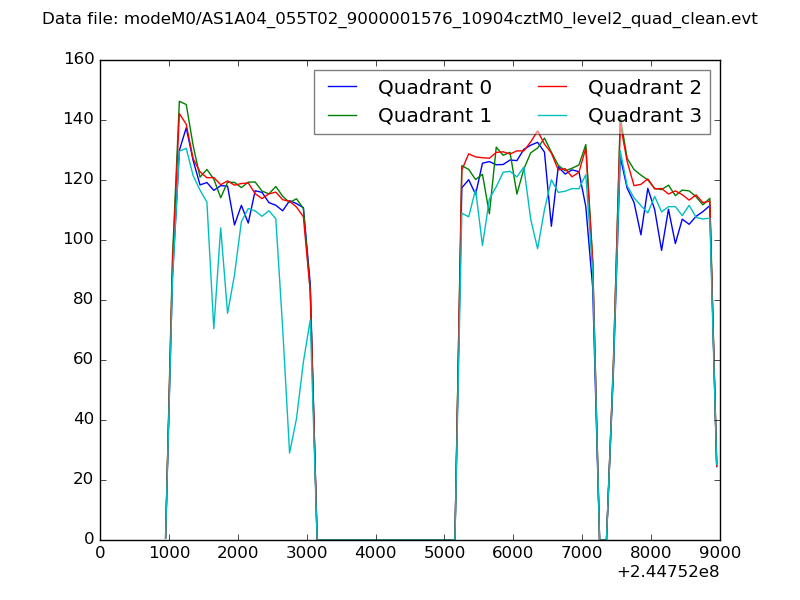 |
|
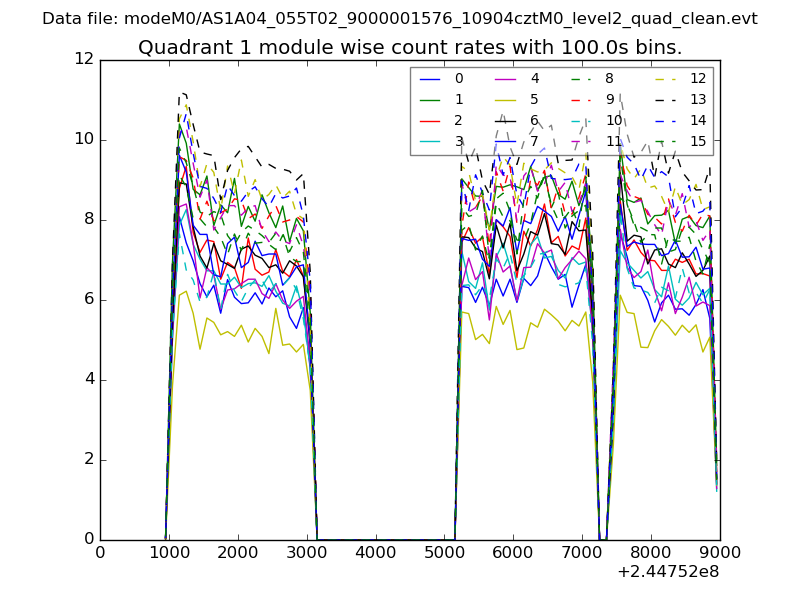
| Module-wise count rates for Quadrant A Data is divided into 100 sec bins |
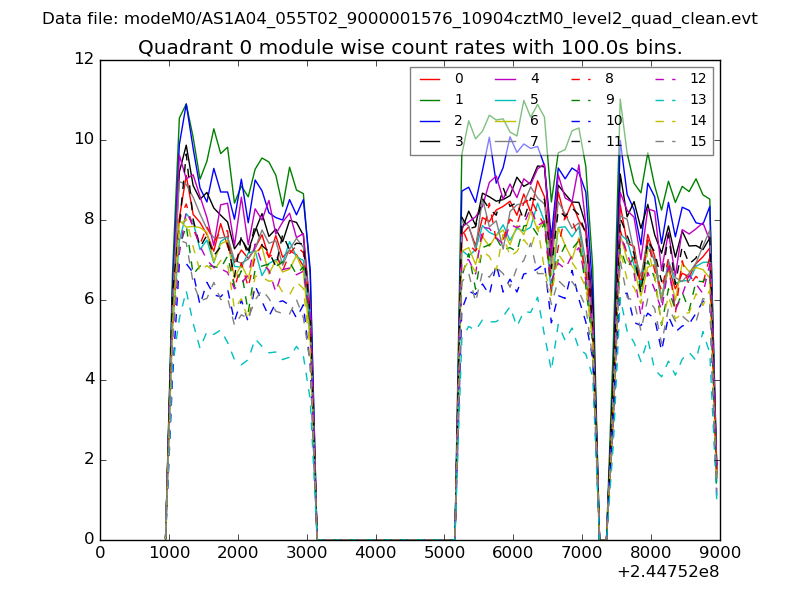 |
 |
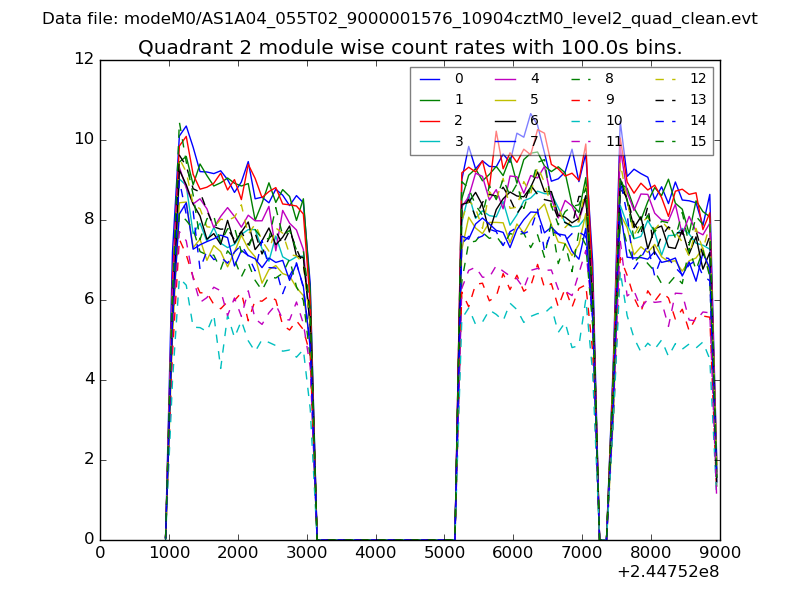
| Module-wise count rates for Quadrant B Data is divided into 100 sec bins |
 |
 |
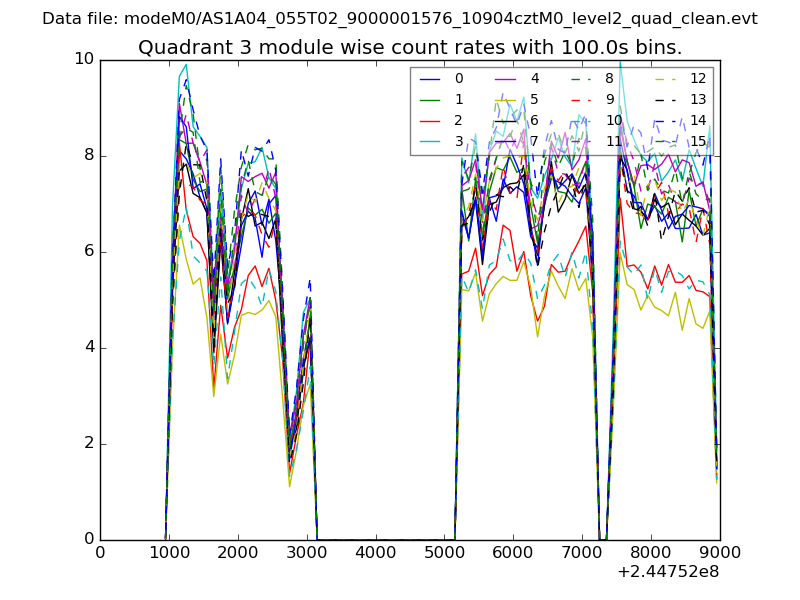
| Module-wise count rates for Quadrant C Data is divided into 100 sec bins |
 |
 |
| Module-wise count rates for Quadrant D Data is divided into 100 sec bins |
 |
 |
| Parameter | Plot |
|---|---|
| CZT HV Monitor | 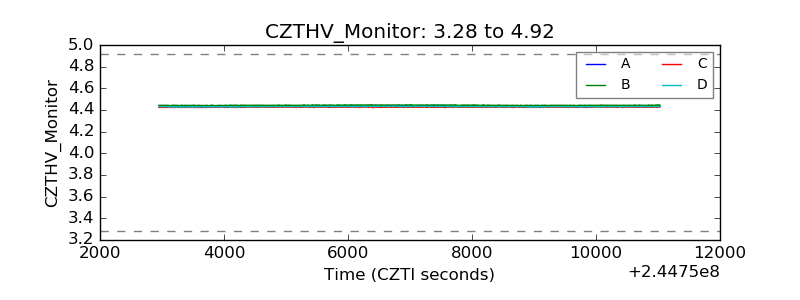 |
| D_VDD | 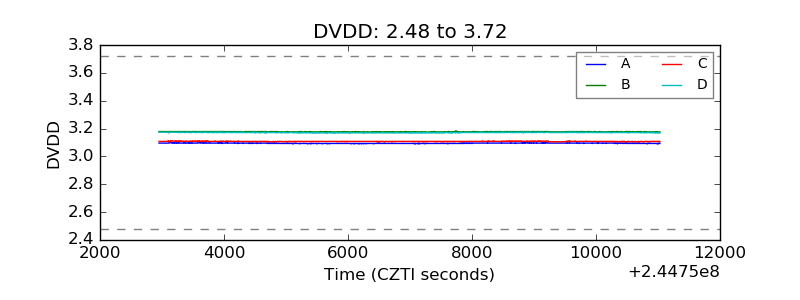 |
| Temperature 1 | 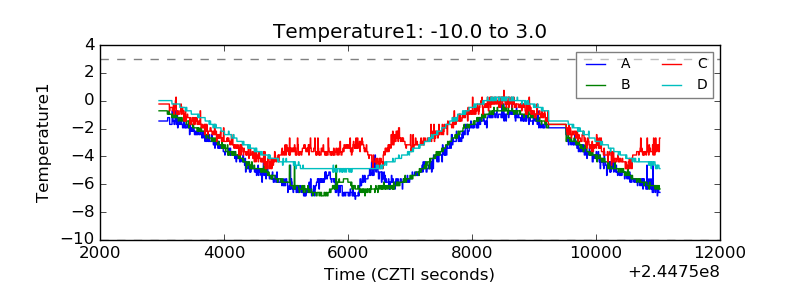 |
| Veto HV Monitor | 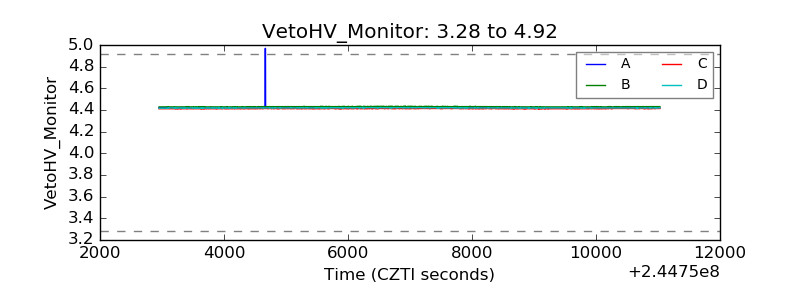 |
| Veto LLD | 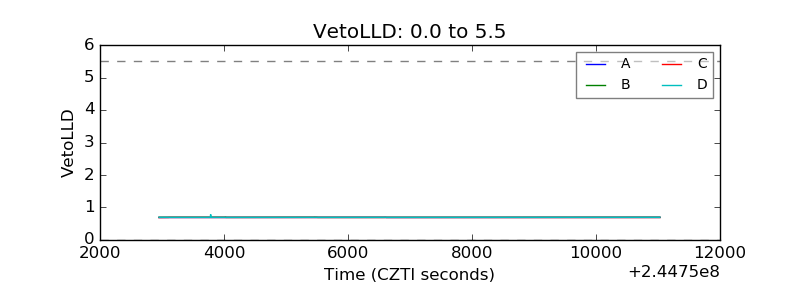 |
| Alpha Counter | 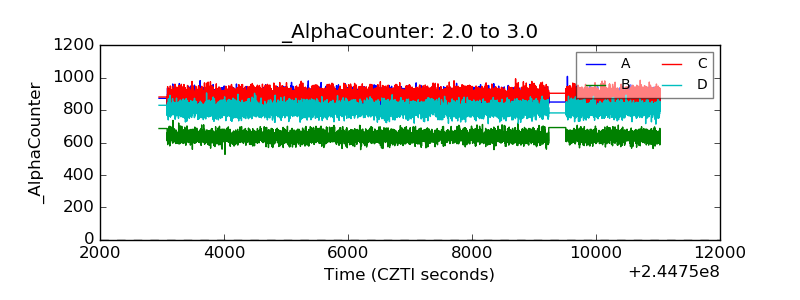 |
| _CPM_Rate | 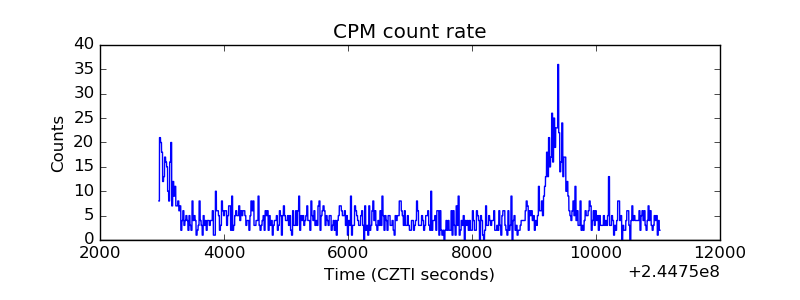 |
| CZT Counter | 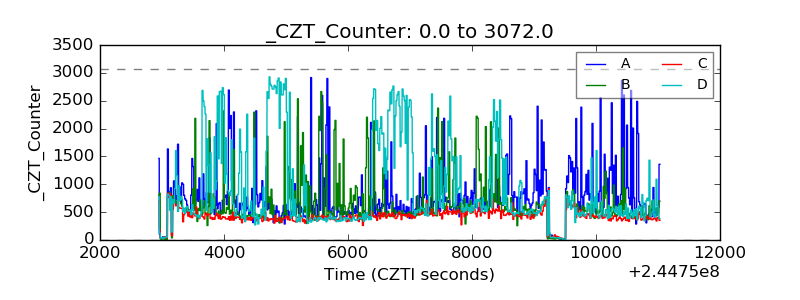 |
| +2.5 Volts monitor |  |
| +5 Volts monitor | 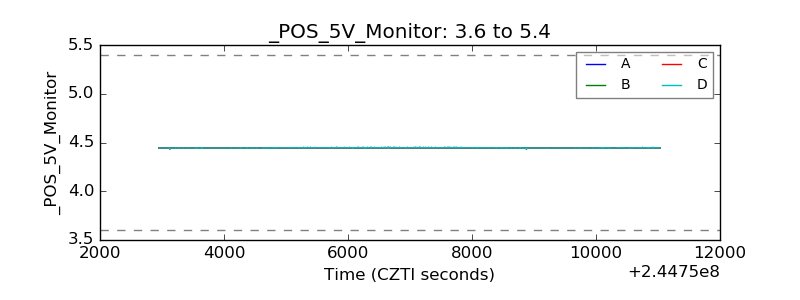 |
| _ROLL_ROT | 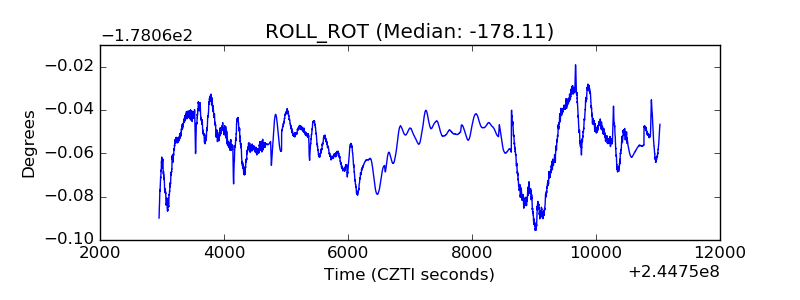 |
| _Roll_DEC | 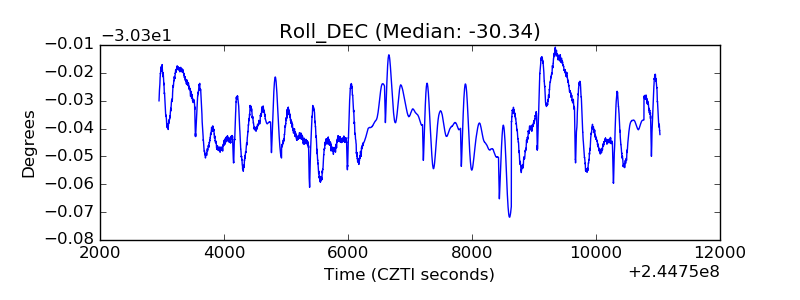 |
| _Roll_RA | 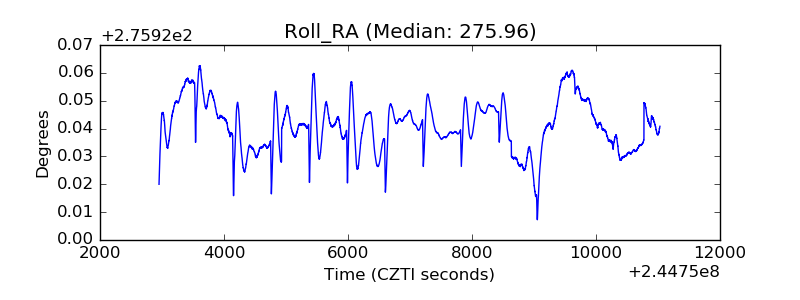 |
| Veto Counter | 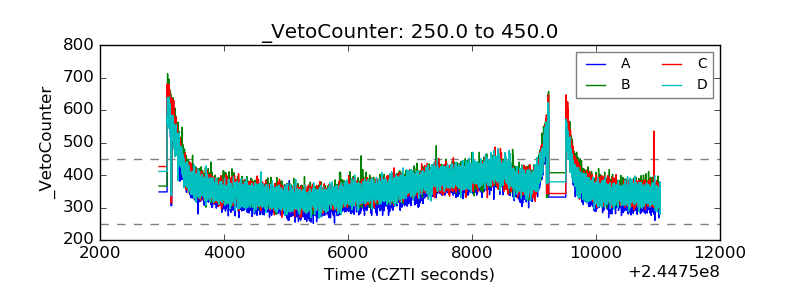 |