| Param | Original file | Final file |
|---|---|---|
| Filename | modeM0/AS1A04_055T02_9000001576_10907cztM0_level2.evt | modeM0/AS1A04_055T02_9000001576_10907cztM0_level2_quad_clean.evt |
| Size (bytes) | 1,498,190,400 | 200,756,160 |
| Size | 1.4 GB | 191.5 MB |
| Events in quadrant A | 13,488,081 | 1,191,244 |
| Events in quadrant B | 12,277,109 | 1,239,021 |
| Events in quadrant C | 7,867,261 | 1,253,810 |
| Events in quadrant D | 10,529,105 | 1,157,697 |
| Mode M9 | |||
|---|---|---|---|
| Quadrant | BADHDUFLAG | Total packets | Discarded packets |
| A | 0 | 19 | 0 |
| B | 0 | 19 | 0 |
| C | 0 | 19 | 0 |
| D | 0 | 19 | 0 |
| Mode SS | |||
|---|---|---|---|
| Quadrant | BADHDUFLAG | Total packets | Discarded packets |
| A | 0 | 366 | 0 |
| B | 0 | 366 | 0 |
| C | 0 | 366 | 0 |
| D | 0 | 366 | 0 |
| Mode M0 | |||
|---|---|---|---|
| Quadrant | BADHDUFLAG | Total packets | Discarded packets |
| A | 0 | 51982 | 4 |
| B | 0 | 48250 | 3 |
| C | 0 | 36362 | 3 |
| D | 0 | 43901 | 3 |
| Quadrant | Total seconds | Saturated seconds | Saturation percentage |
|---|---|---|---|
| A | 17951 | 1187 | 6.612445% |
| B | 17951 | 1064 | 5.927246% |
| C | 17951 | 51 | 0.284107% |
| D | 17951 | 732 | 4.077767% |
Noise dominated data is calculated using 1-second bins in cleaned event files. If a bin has >2000 counts, and if more than 50% of those come from <1% of pixels, then it is considered to be noise-dominated and hence unusable.
| Quadrant | # 1 sec bins | Bins with >0 counts | Bins with >2000 counts | High rate bins dominated by noise | Noise dominated (total time) | Noise dominated (detector-on time) | Marked lightcurve |
|---|---|---|---|---|---|---|---|
| A | 19906 | 17954 | 866 | 866 | 4.35% | 4.82% | 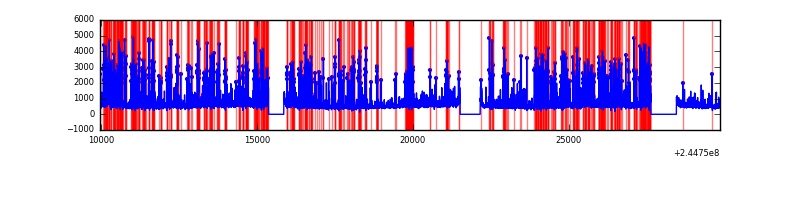 |
| B | 19906 | 17954 | 614 | 614 | 3.08% | 3.42% | 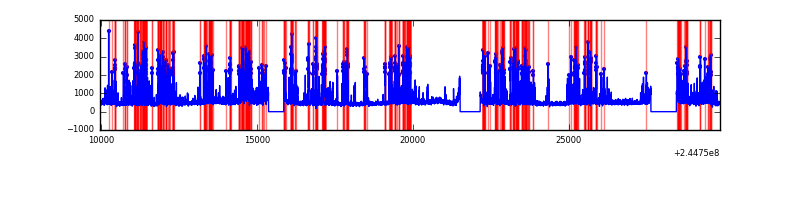 |
| C | 19906 | 17954 | 1 | 1 | 0.01% | 0.01% | 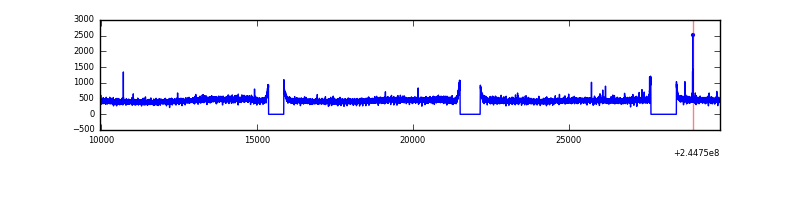 |
| D | 19906 | 17954 | 544 | 544 | 2.73% | 3.03% | 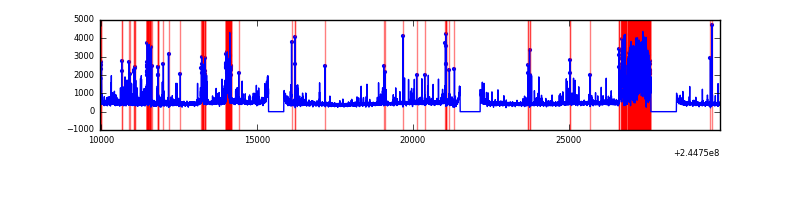 |
Top three noisy pixels from each quadrant. If the there are fewer than three noisy pixels in the level2.evt file, extra rows are filled as -1
| Pixel properties | Quadrant properties | ||||||
|---|---|---|---|---|---|---|---|
| Quadrant | DetID | PixID | Counts | Sigma | Mean | Median | Sigma |
| A | 8 | 5 | 3320703 | 8122.89 | 2017 | 1970 | 408.6 |
| A | 13 | 251 | 1843629 | 4507.62 | 2017 | 1970 | 408.6 |
| A | 15 | 223 | 196024 | 474.96 | 2017 | 1970 | 408.6 |
| B | 4 | 239 | 3859500 | 9875.18 | 2053 | 2002 | 390.6 |
| B | 0 | 214 | 93673 | 234.68 | 2053 | 2002 | 390.6 |
| B | 0 | 219 | 85347 | 213.36 | 2053 | 2002 | 390.6 |
| C | 13 | 61 | 14759 | 27.34 | 2010 | 2021 | 465.9 |
| C | 14 | 128 | 13907 | 25.51 | 2010 | 2021 | 465.9 |
| C | 4 | 222 | 9054 | 15.1 | 2010 | 2021 | 465.9 |
| D | 12 | 33 | 2193790 | 4615.03 | 1965 | 1911 | 474.9 |
| D | 5 | 222 | 142741 | 296.52 | 1965 | 1911 | 474.9 |
| D | 1 | 52 | 125363 | 259.93 | 1965 | 1911 | 474.9 |
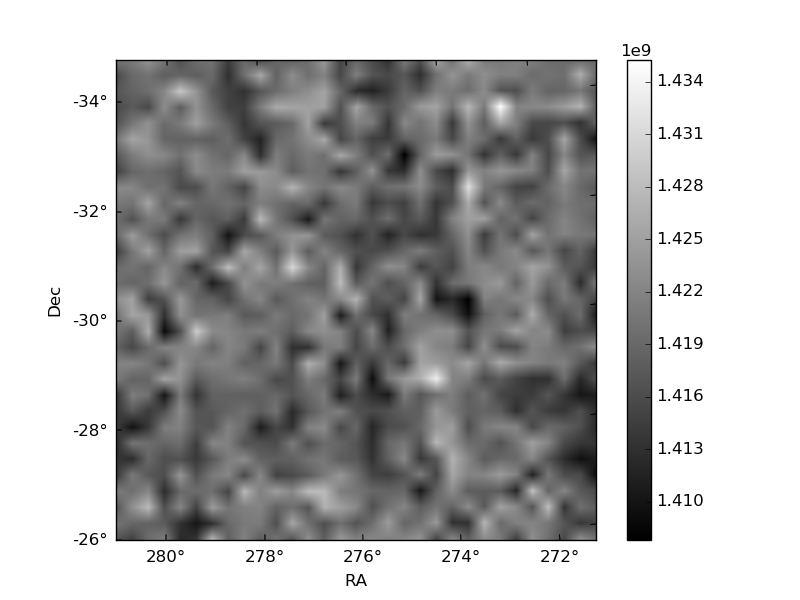
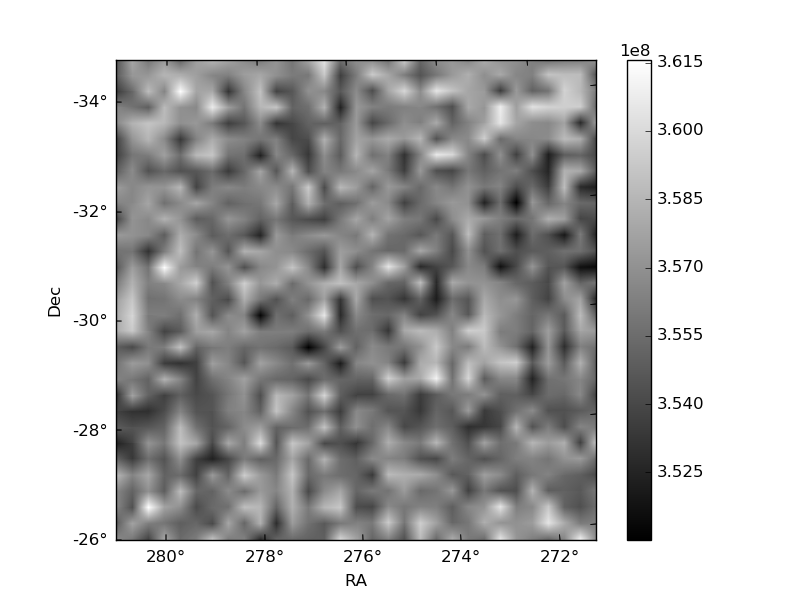
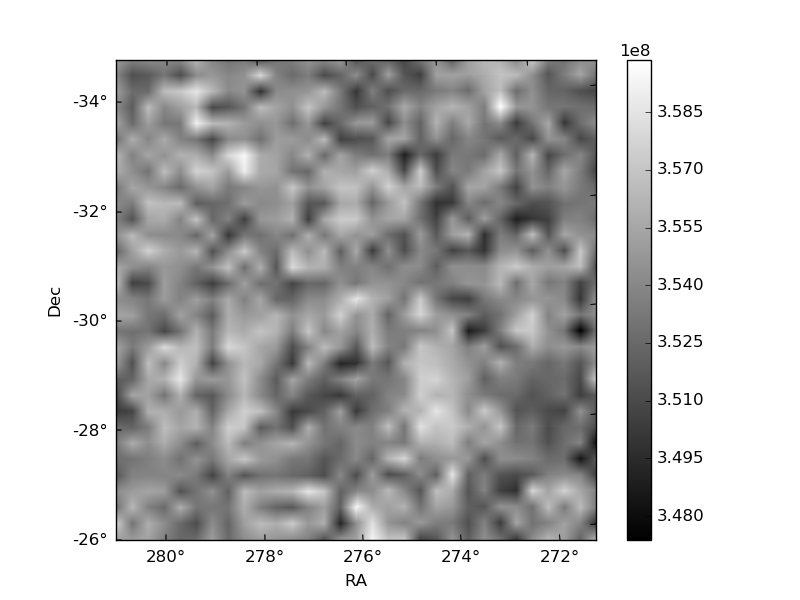
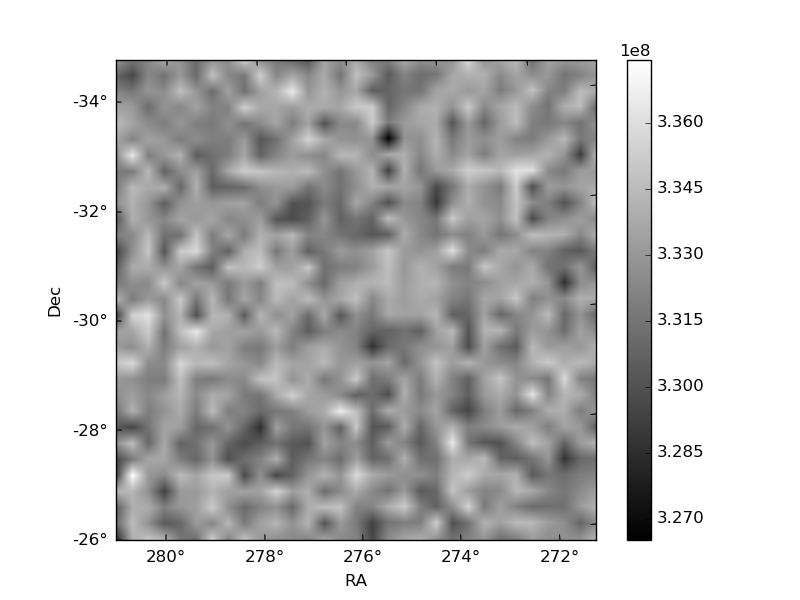
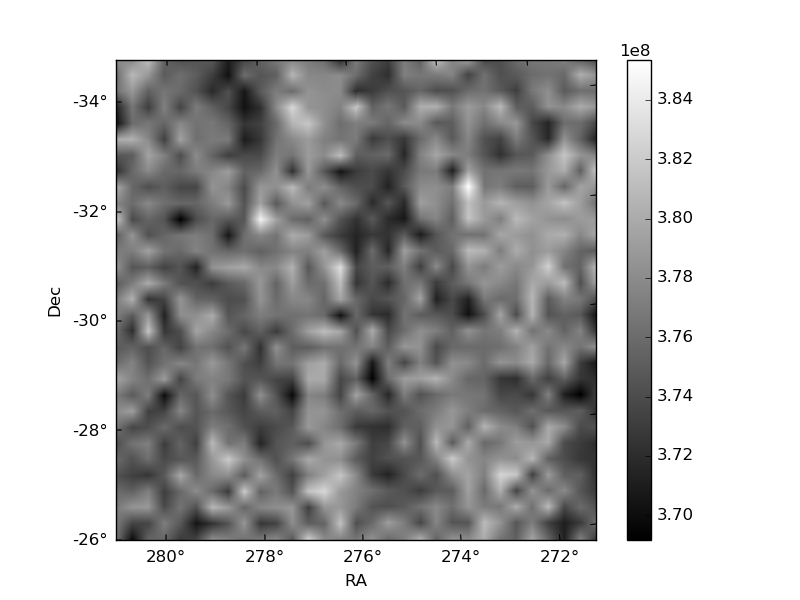
Histogram calculated using DETX and DETY for each event in the final _common_clean file
| Quadrant A | 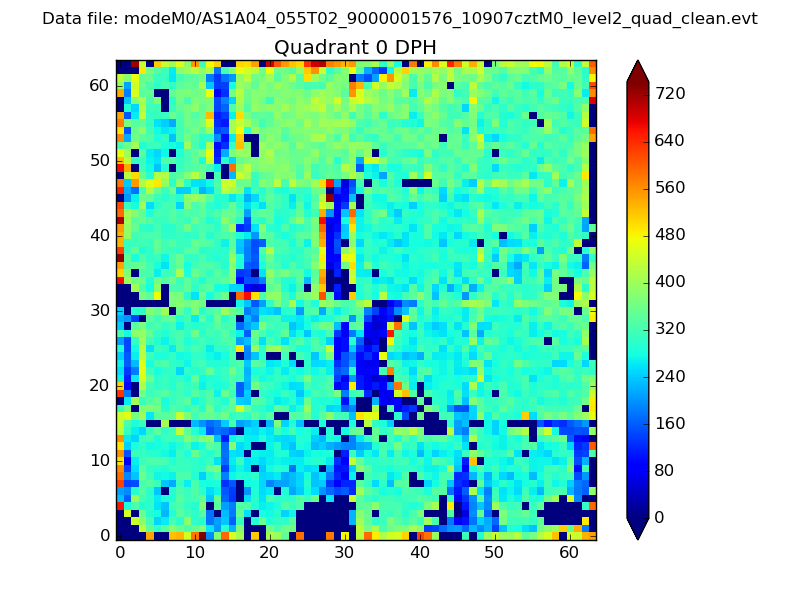 |
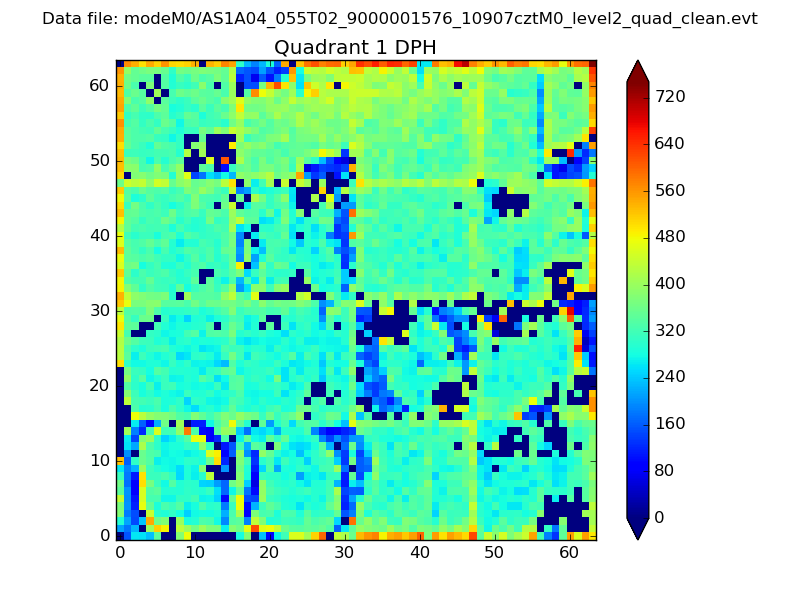 |
Quadrant B |
|---|---|---|---|
| Quadrant D | 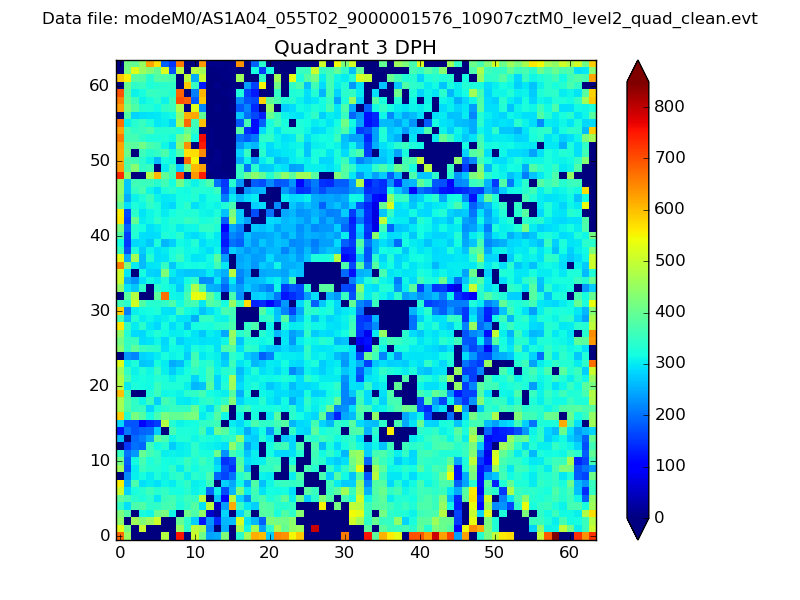 |
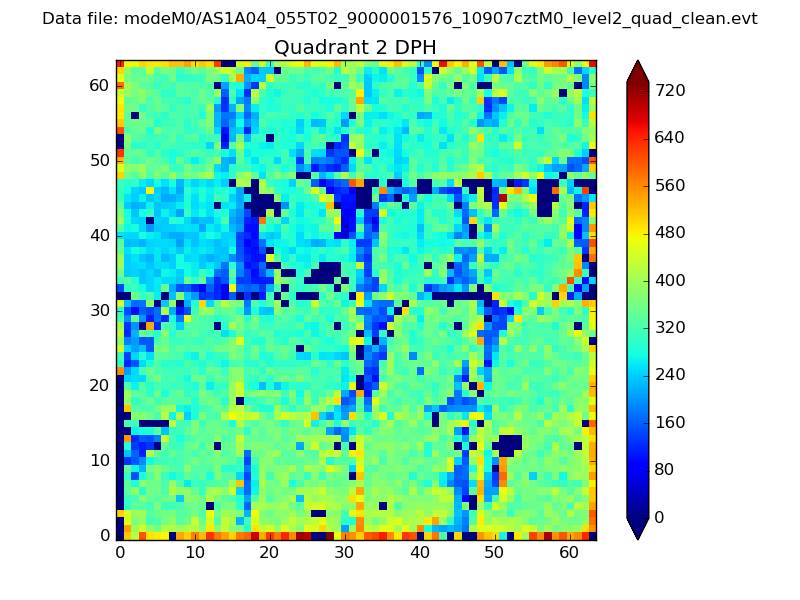 |
Quadrant C |
| Plot type | Count rate plots | Images |
|---|---|---|
| Comparison with Poisson distribution Blue bars denote a histogram of data divided into 1 sec bins. Red curve is a Poisson curve with rate = median count rate of data. |
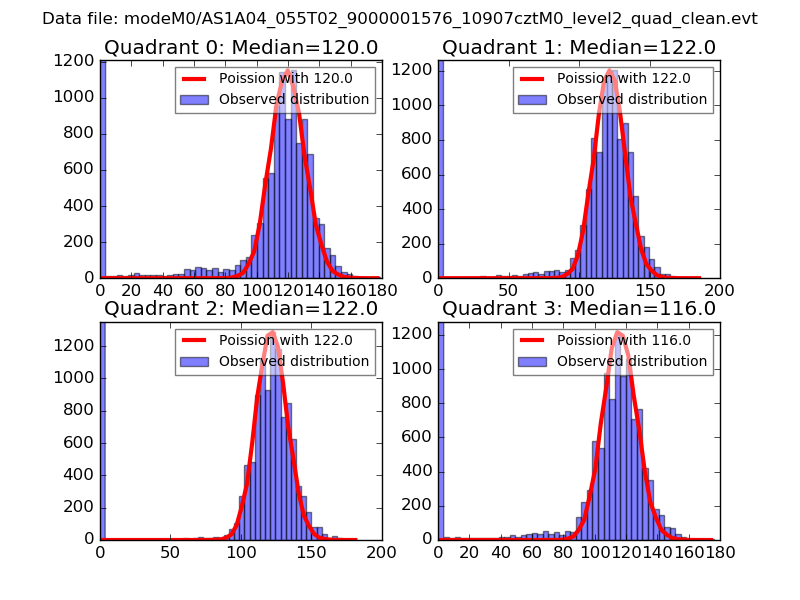 |
 |
| Quadrant-wise count rates Data is divided into 100 sec bins |
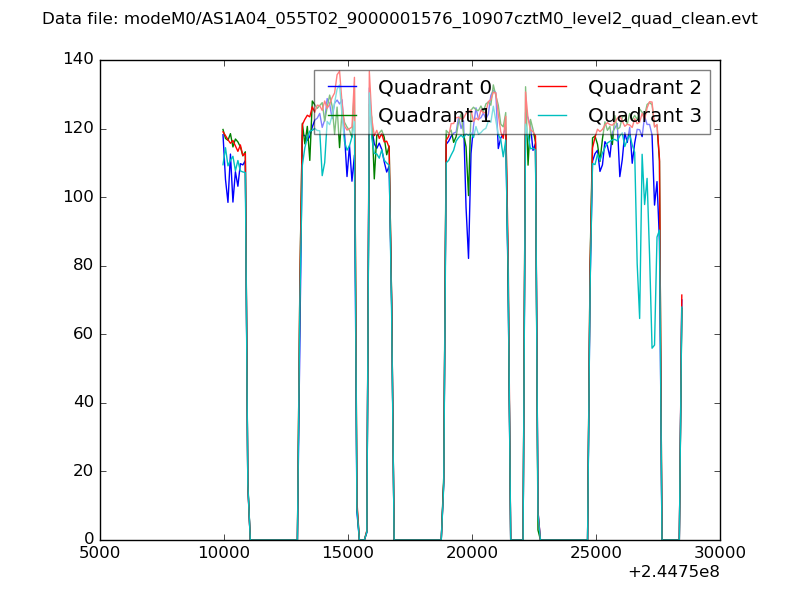 |
|
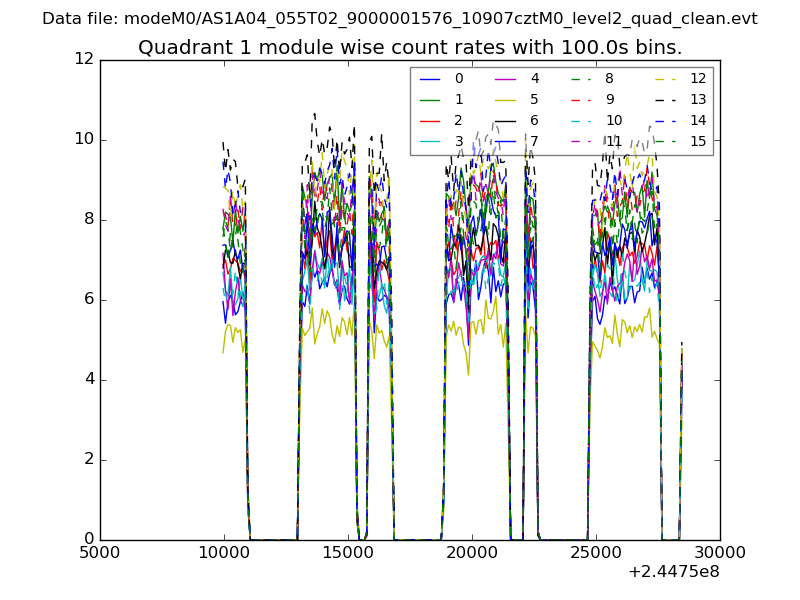
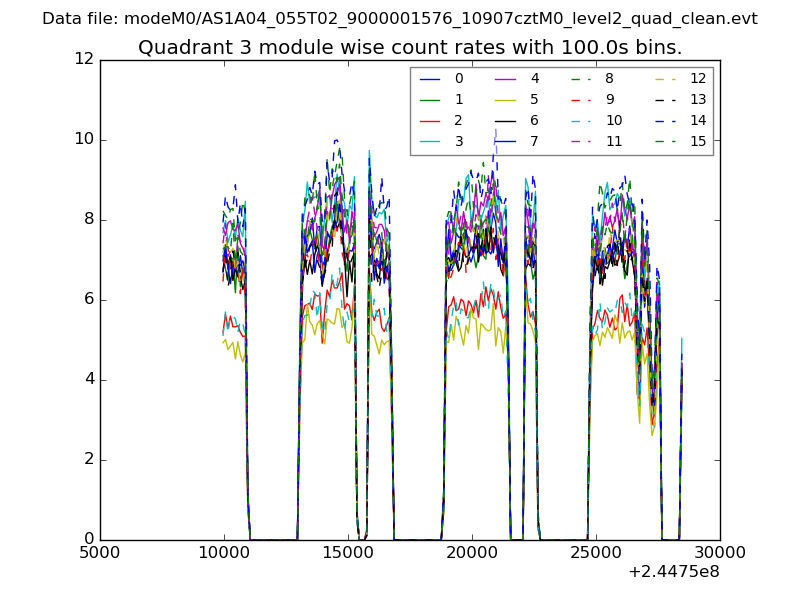
| Module-wise count rates for Quadrant A Data is divided into 100 sec bins |
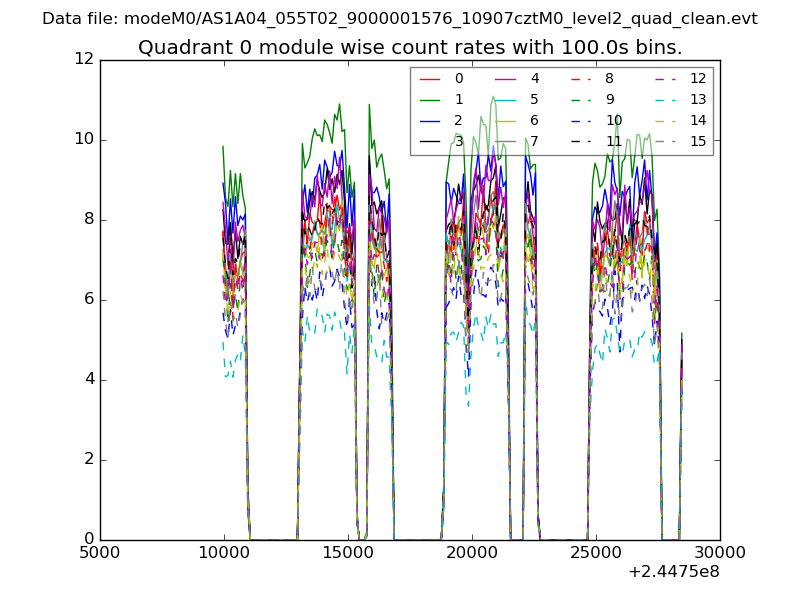 |
 |
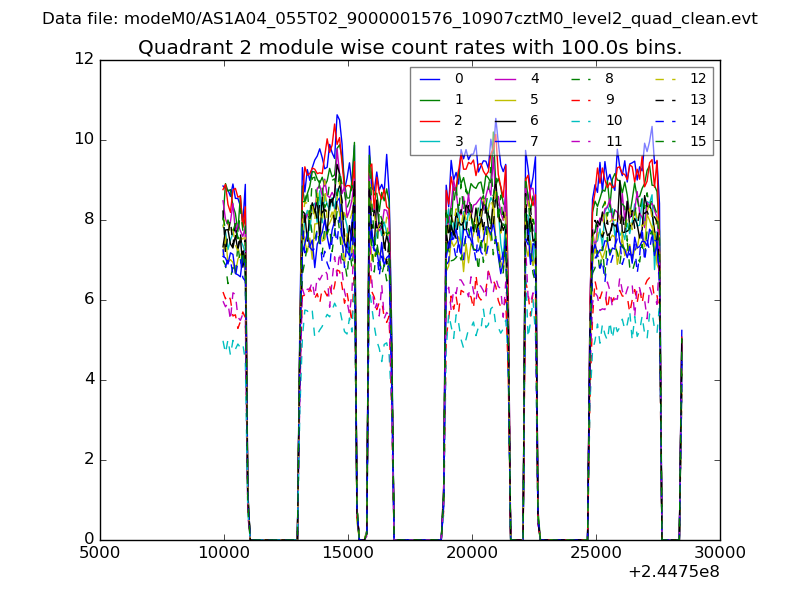
| Module-wise count rates for Quadrant B Data is divided into 100 sec bins |
 |
 |
| Module-wise count rates for Quadrant C Data is divided into 100 sec bins |
 |
 |
| Module-wise count rates for Quadrant D Data is divided into 100 sec bins |
 |
 |
| Parameter | Plot |
|---|---|
| CZT HV Monitor | 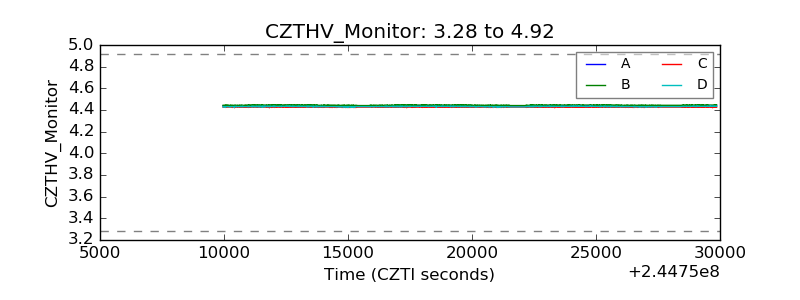 |
| D_VDD | 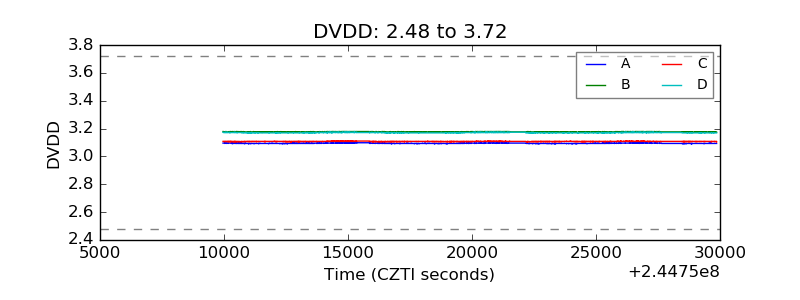 |
| Temperature 1 |  |
| Veto HV Monitor | 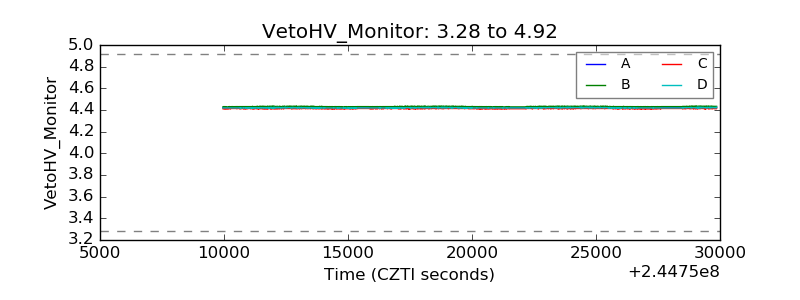 |
| Veto LLD | 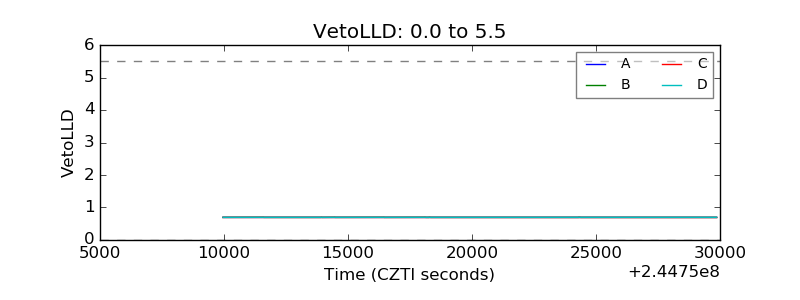 |
| Alpha Counter | 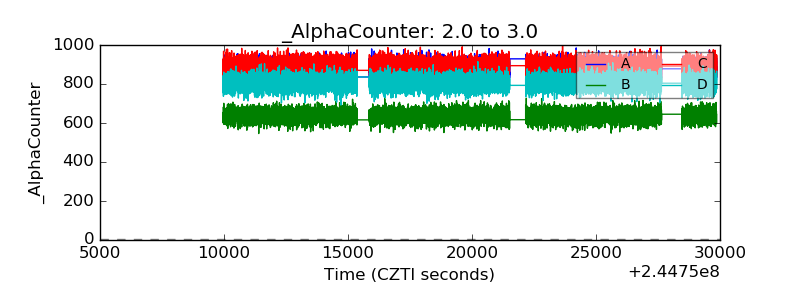 |
| _CPM_Rate | 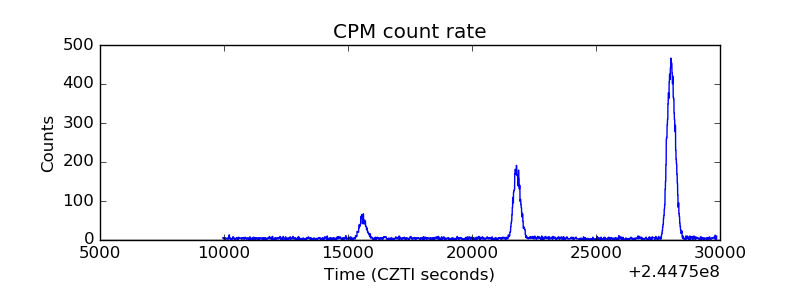 |
| CZT Counter | 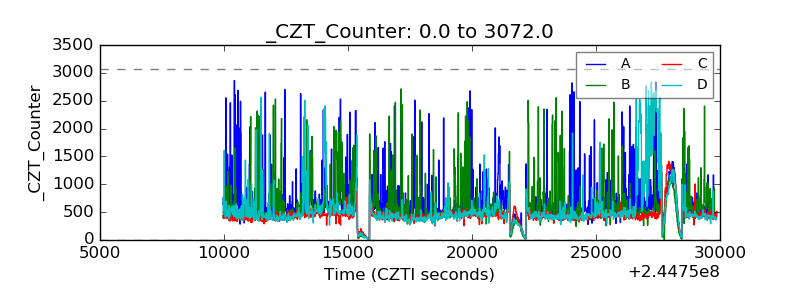 |
| +2.5 Volts monitor |  |
| +5 Volts monitor |  |
| _ROLL_ROT | 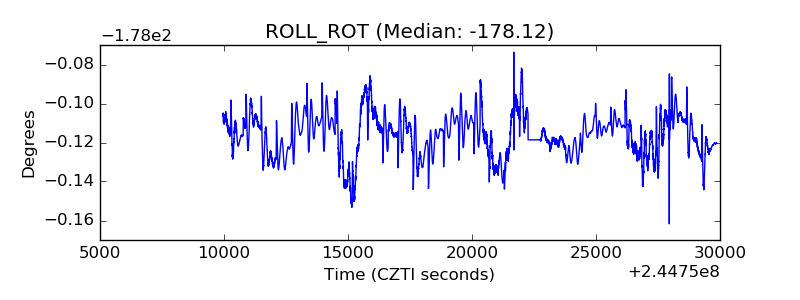 |
| _Roll_DEC | 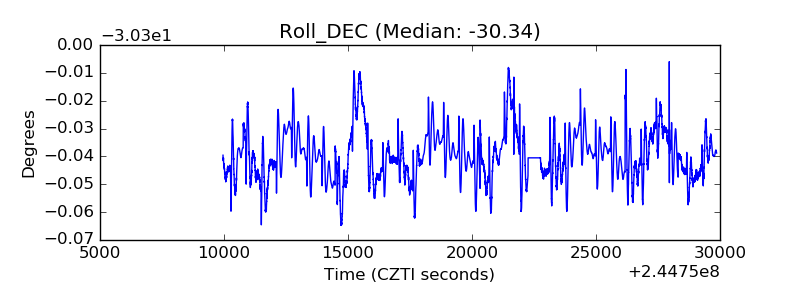 |
| _Roll_RA | 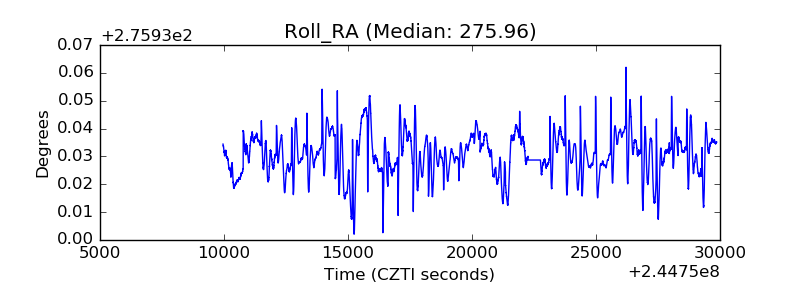 |
| Veto Counter | 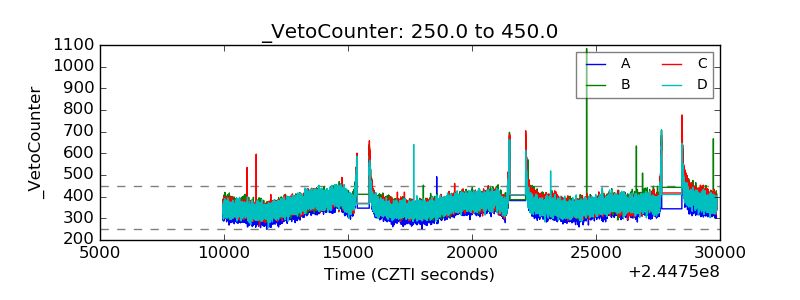 |