| Param | Original file | Final file |
|---|---|---|
| Filename | modeM0/AS1A04_055T02_9000001576_10908cztM0_level2.evt | modeM0/AS1A04_055T02_9000001576_10908cztM0_level2_quad_clean.evt |
| Size (bytes) | 472,489,920 | 64,771,200 |
| Size | 450.6 MB | 61.8 MB |
| Events in quadrant A | 3,535,519 | 380,340 |
| Events in quadrant B | 4,243,752 | 377,282 |
| Events in quadrant C | 2,954,983 | 382,415 |
| Events in quadrant D | 3,130,766 | 364,699 |
| Mode M9 | |||
|---|---|---|---|
| Quadrant | BADHDUFLAG | Total packets | Discarded packets |
| A | 0 | 10 | 0 |
| B | 0 | 10 | 0 |
| C | 0 | 10 | 0 |
| D | 0 | 10 | 0 |
| Mode SS | |||
|---|---|---|---|
| Quadrant | BADHDUFLAG | Total packets | Discarded packets |
| A | 0 | 132 | 0 |
| B | 0 | 132 | 0 |
| C | 0 | 132 | 0 |
| D | 0 | 132 | 0 |
| Mode M0 | |||
|---|---|---|---|
| Quadrant | BADHDUFLAG | Total packets | Discarded packets |
| A | 0 | 14448 | 2 |
| B | 0 | 16918 | 1 |
| C | 0 | 13322 | 1 |
| D | 0 | 13865 | 1 |
| Quadrant | Total seconds | Saturated seconds | Saturation percentage |
|---|---|---|---|
| A | 6543 | 64 | 0.978145% |
| B | 6543 | 287 | 4.386367% |
| C | 6543 | 35 | 0.534923% |
| D | 6543 | 48 | 0.733608% |
Noise dominated data is calculated using 1-second bins in cleaned event files. If a bin has >2000 counts, and if more than 50% of those come from <1% of pixels, then it is considered to be noise-dominated and hence unusable.
| Quadrant | # 1 sec bins | Bins with >0 counts | Bins with >2000 counts | High rate bins dominated by noise | Noise dominated (total time) | Noise dominated (detector-on time) | Marked lightcurve |
|---|---|---|---|---|---|---|---|
| A | 7503 | 6544 | 12 | 12 | 0.16% | 0.18% | 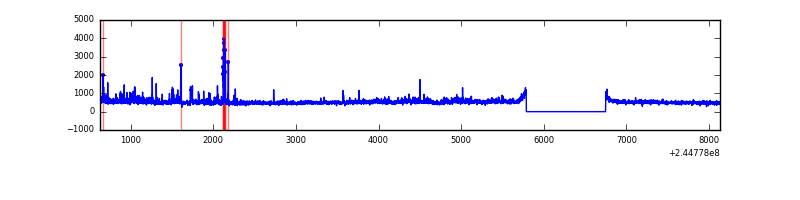 |
| B | 7503 | 6544 | 134 | 134 | 1.79% | 2.05% | 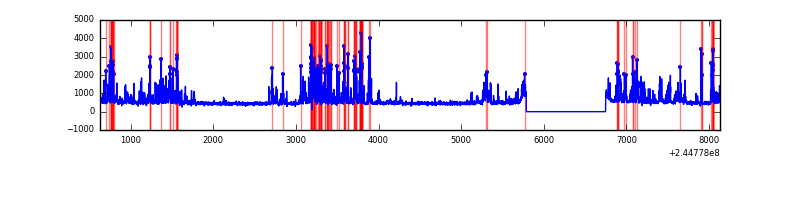 |
| C | 7503 | 6544 | 1 | 1 | 0.01% | 0.02% | 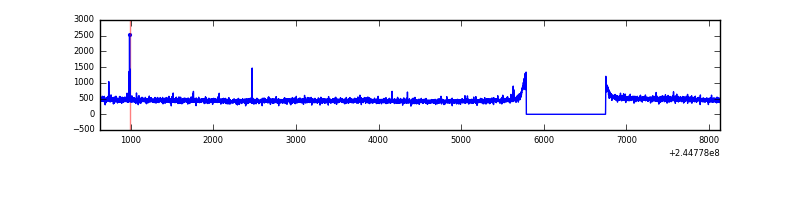 |
| D | 7503 | 6544 | 16 | 16 | 0.21% | 0.24% | 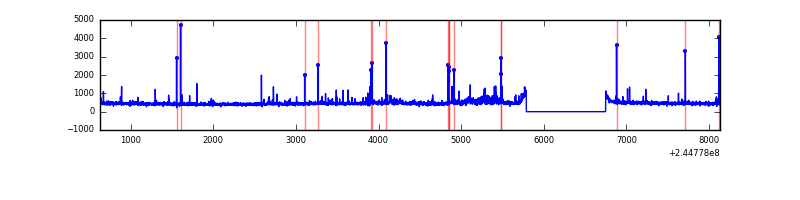 |
Top three noisy pixels from each quadrant. If the there are fewer than three noisy pixels in the level2.evt file, extra rows are filled as -1
| Pixel properties | Quadrant properties | ||||||
|---|---|---|---|---|---|---|---|
| Quadrant | DetID | PixID | Counts | Sigma | Mean | Median | Sigma |
| A | 13 | 251 | 364723 | 2298.27 | 771 | 753 | 158.4 |
| A | 8 | 5 | 81249 | 508.29 | 771 | 753 | 158.4 |
| A | 15 | 223 | 28693 | 176.43 | 771 | 753 | 158.4 |
| B | 4 | 239 | 1149240 | 7844.73 | 769 | 749 | 146.4 |
| B | 0 | 214 | 47818 | 321.5 | 769 | 749 | 146.4 |
| B | 12 | 111 | 15772 | 102.61 | 769 | 749 | 146.4 |
| C | 14 | 128 | 11646 | 62.71 | 750 | 753 | 173.7 |
| C | 4 | 222 | 10781 | 57.73 | 750 | 753 | 173.7 |
| C | 13 | 61 | 5588 | 27.83 | 750 | 753 | 173.7 |
| D | 1 | 52 | 152010 | 850.0 | 740 | 718 | 178.0 |
| D | 8 | 195 | 42884 | 236.9 | 740 | 718 | 178.0 |
| D | 13 | 249 | 36369 | 200.3 | 740 | 718 | 178.0 |
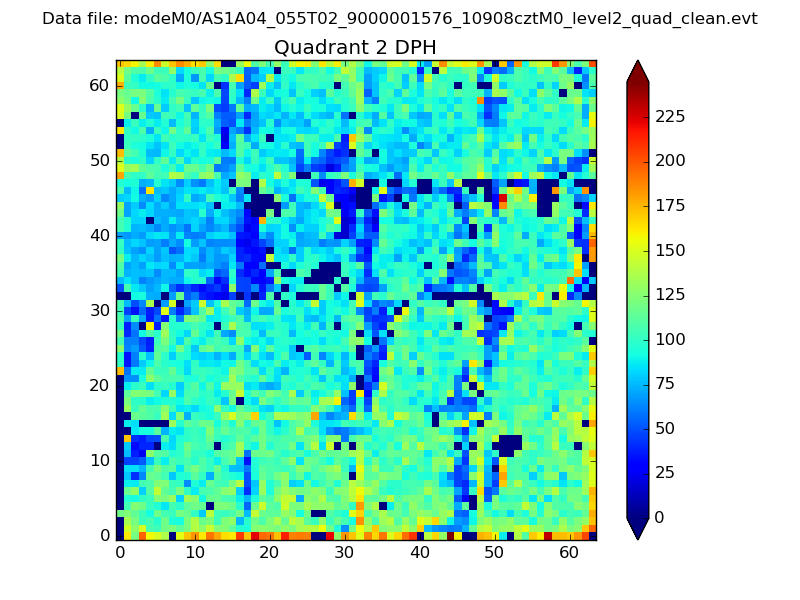
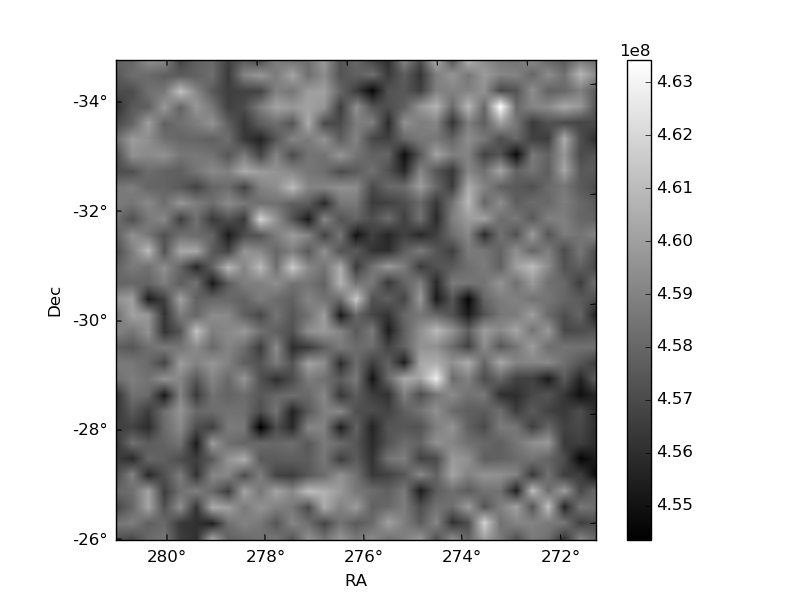
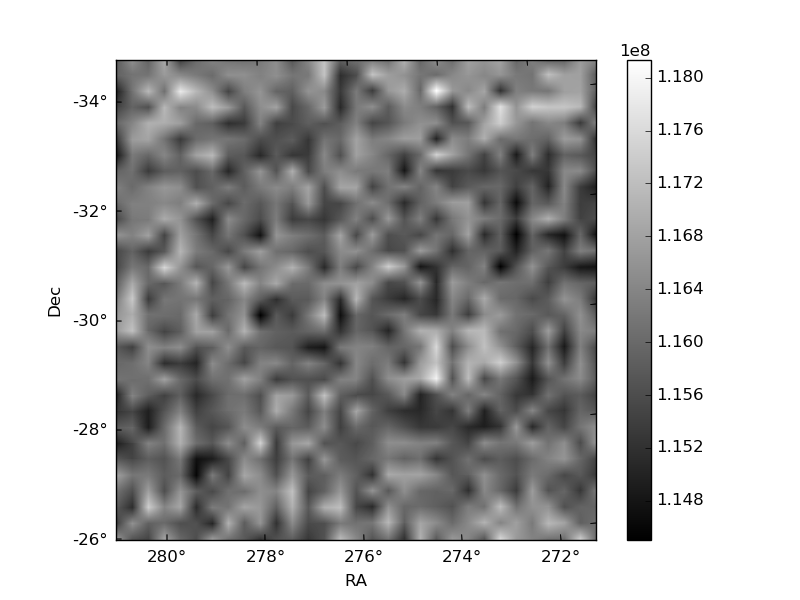
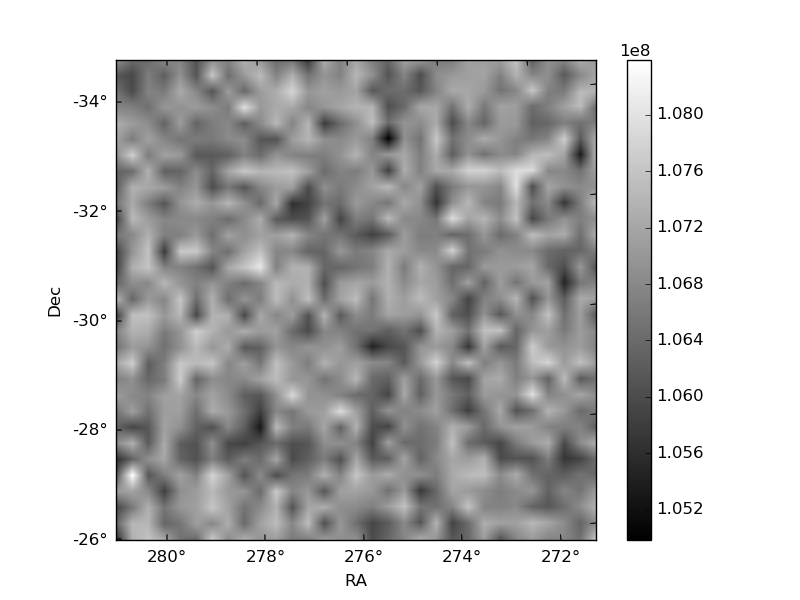
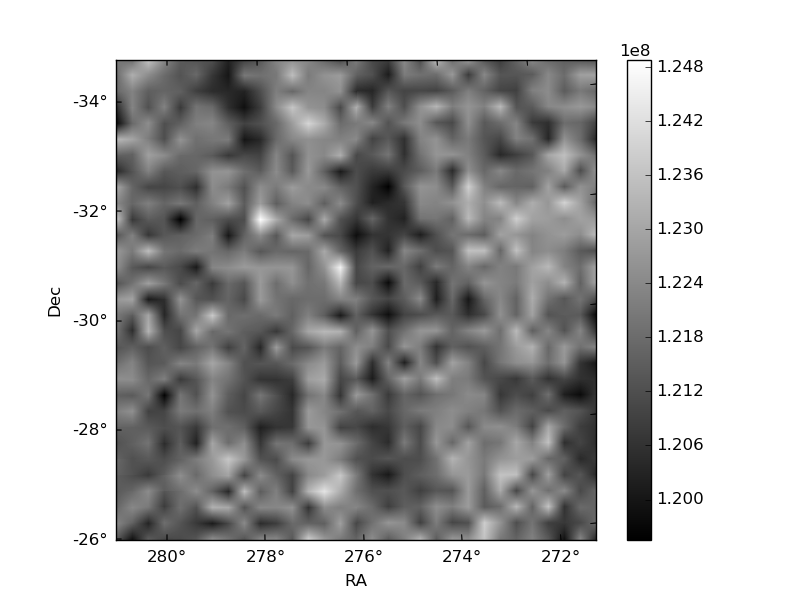
Histogram calculated using DETX and DETY for each event in the final _common_clean file
| Quadrant A | 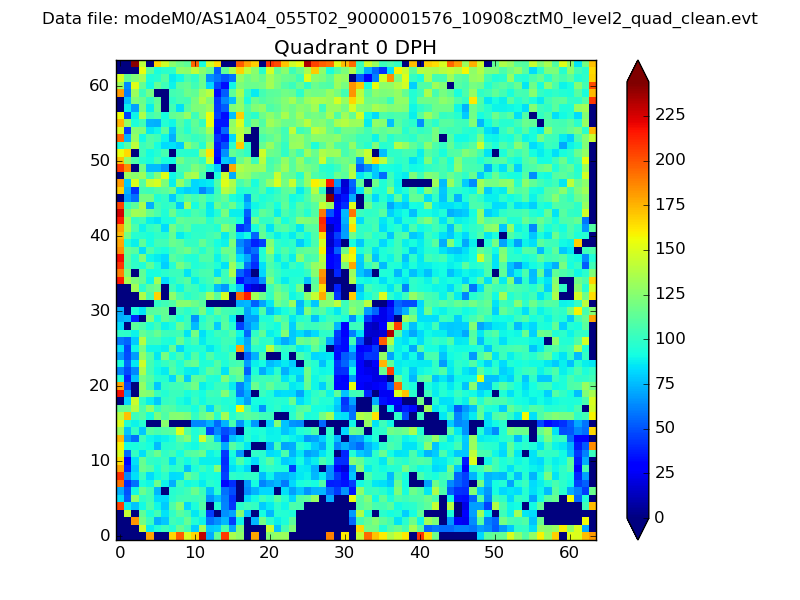 |
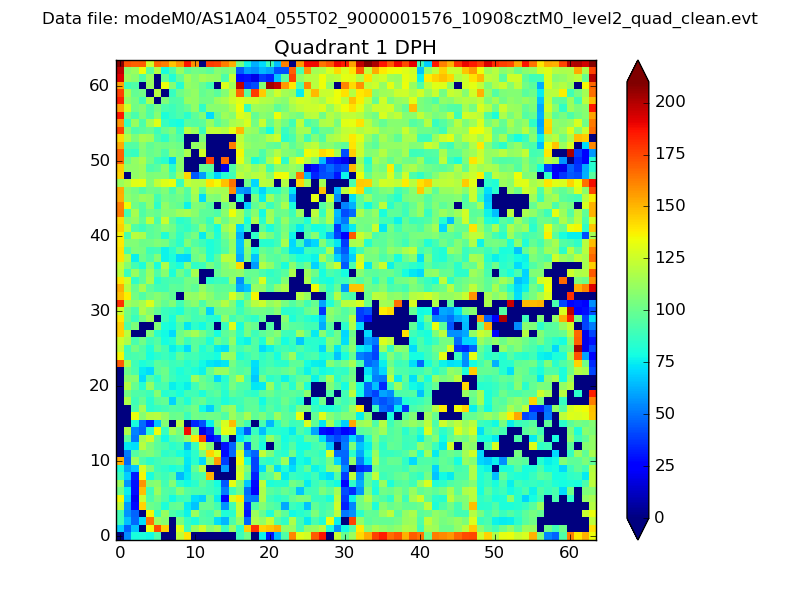 |
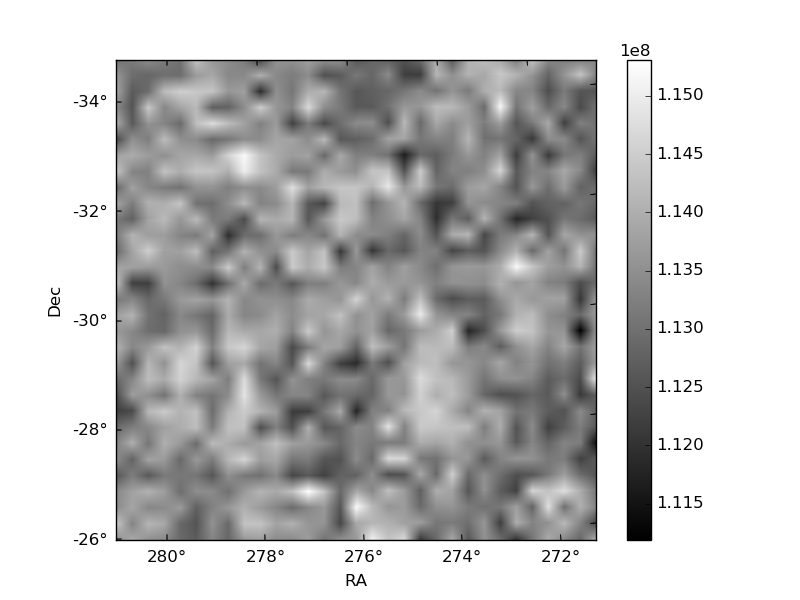
Quadrant B |
|---|---|---|---|
| Quadrant D | 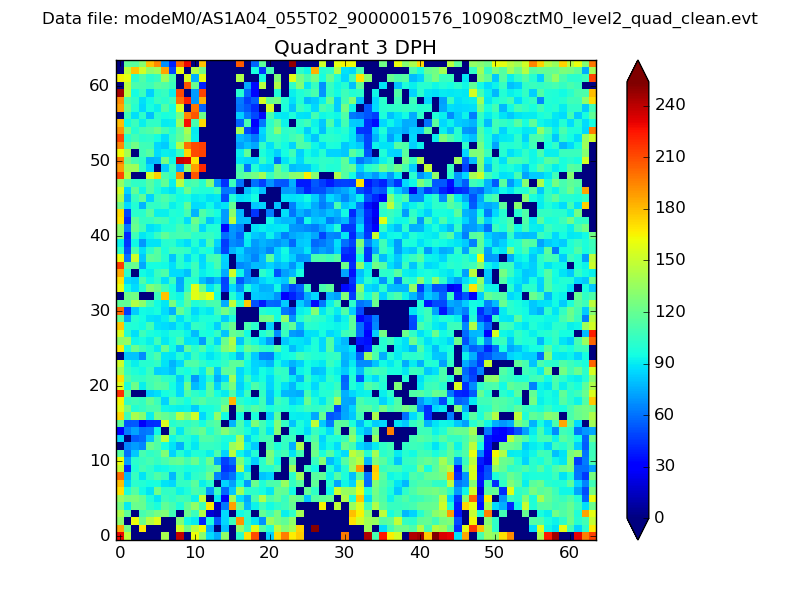 |
 |
Quadrant C |
| Plot type | Count rate plots | Images |
|---|---|---|
| Comparison with Poisson distribution Blue bars denote a histogram of data divided into 1 sec bins. Red curve is a Poisson curve with rate = median count rate of data. |
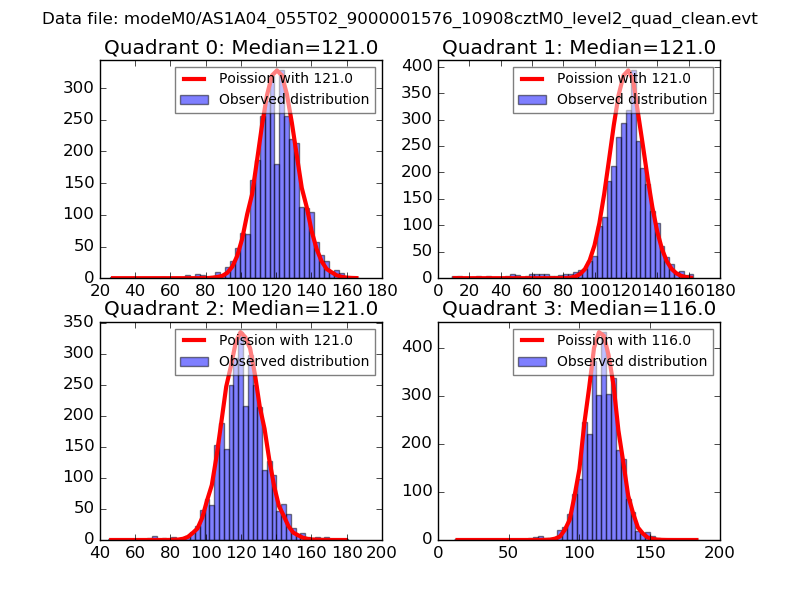 |
 |
| Quadrant-wise count rates Data is divided into 100 sec bins |
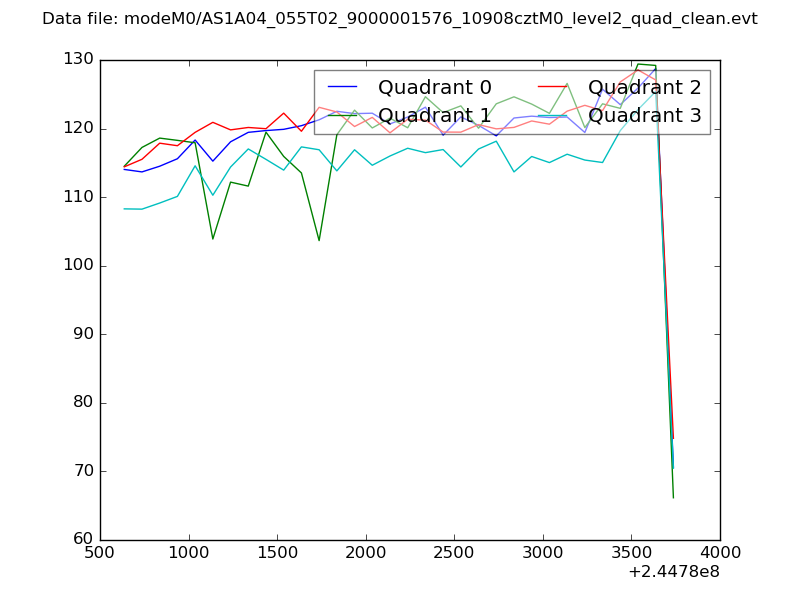 |
|
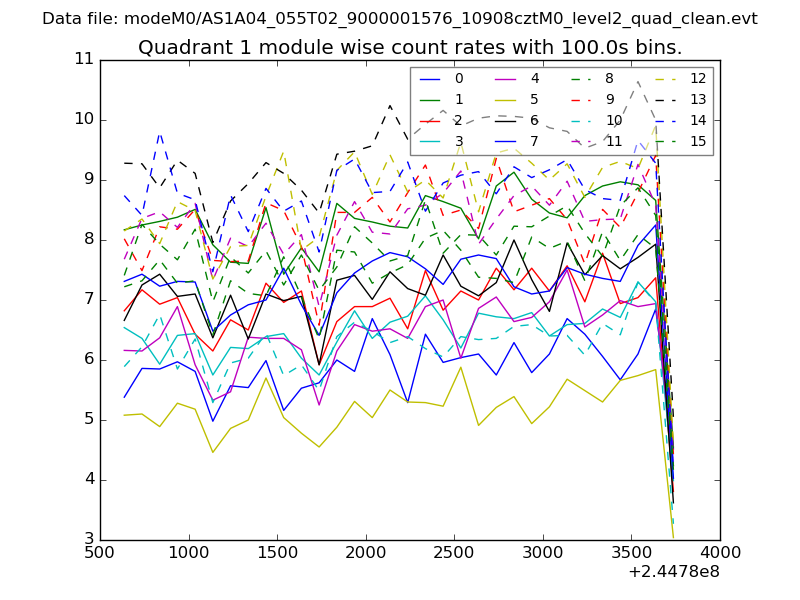
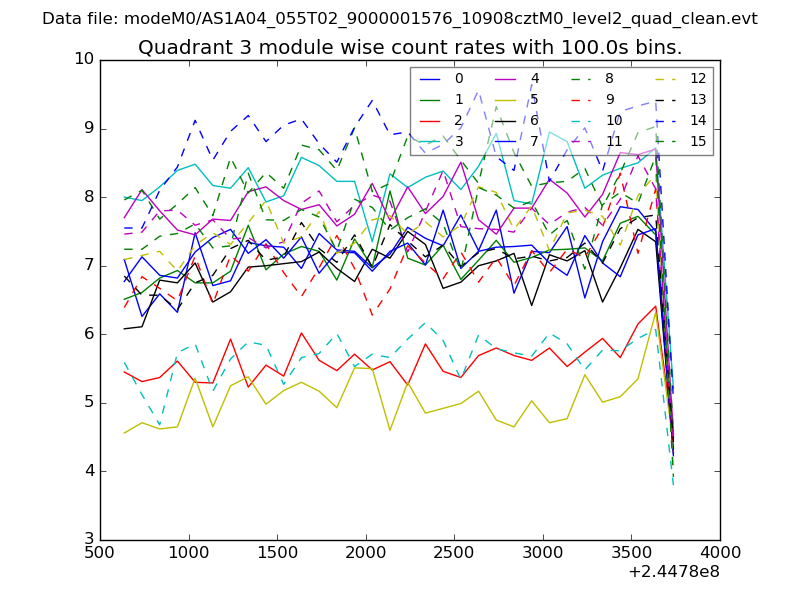
| Module-wise count rates for Quadrant A Data is divided into 100 sec bins |
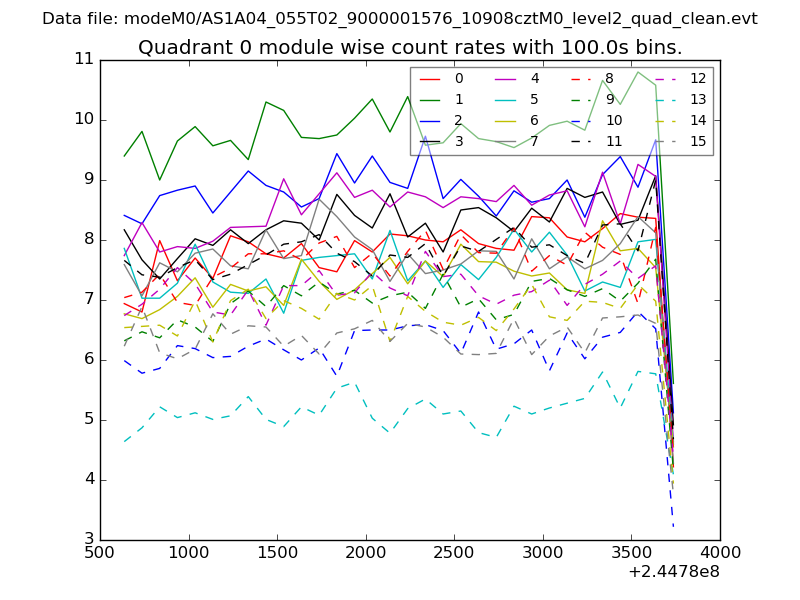 |
 |
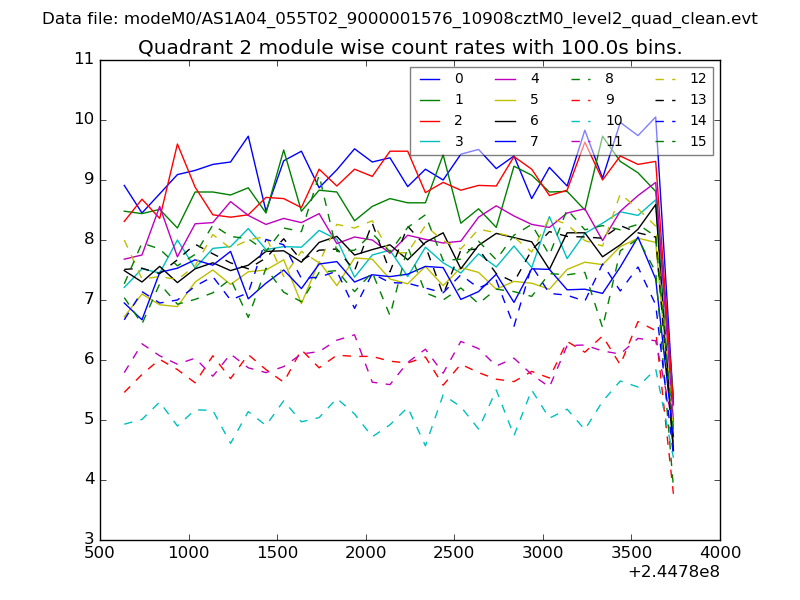
| Module-wise count rates for Quadrant B Data is divided into 100 sec bins |
 |
 |
| Module-wise count rates for Quadrant C Data is divided into 100 sec bins |
 |
 |
| Module-wise count rates for Quadrant D Data is divided into 100 sec bins |
 |
 |
| Parameter | Plot |
|---|---|
| CZT HV Monitor |  |
| D_VDD |  |
| Temperature 1 | 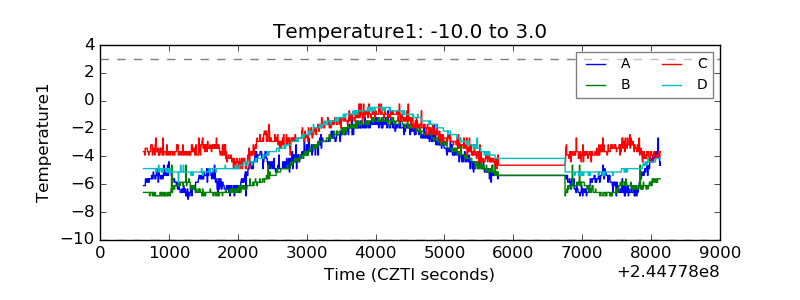 |
| Veto HV Monitor | 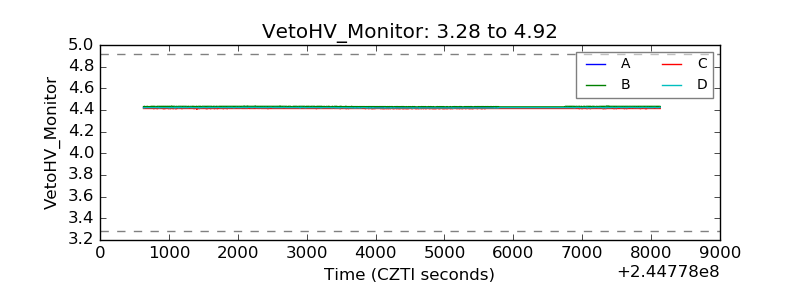 |
| Veto LLD | 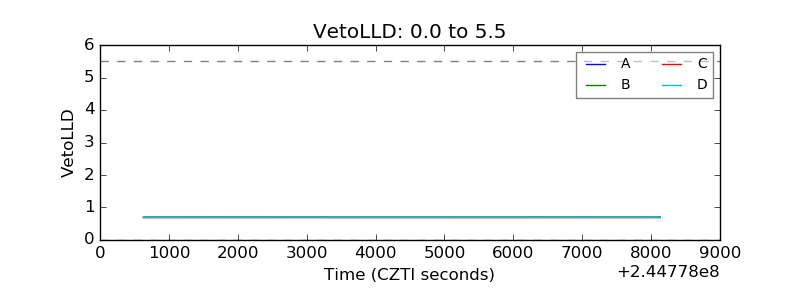 |
| Alpha Counter | 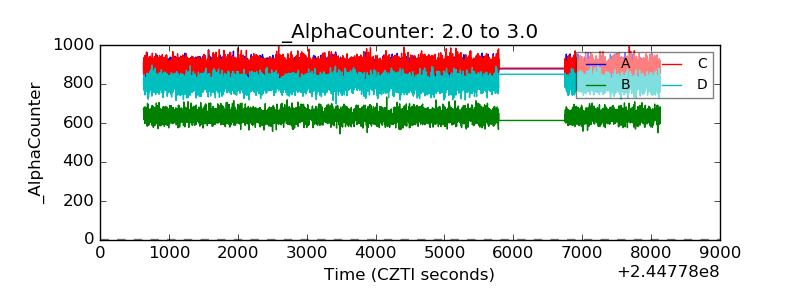 |
| _CPM_Rate | 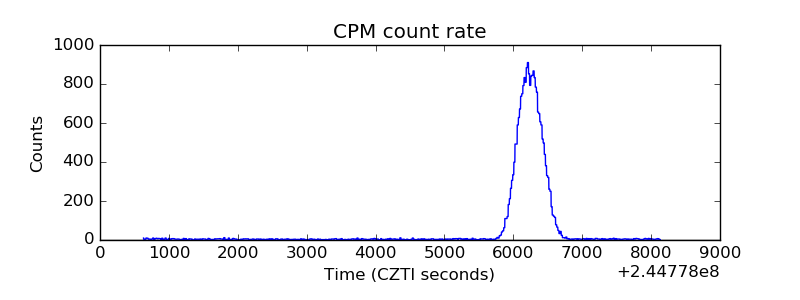 |
| CZT Counter | 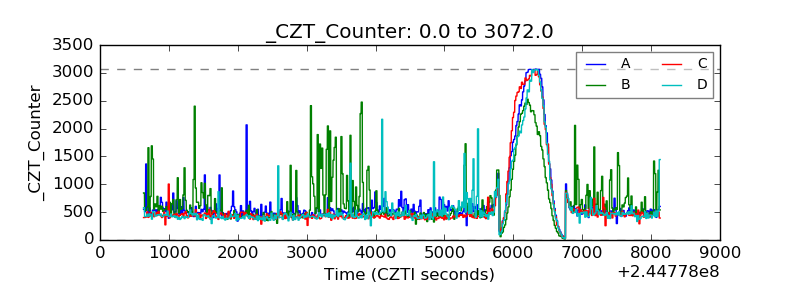 |
| +2.5 Volts monitor | 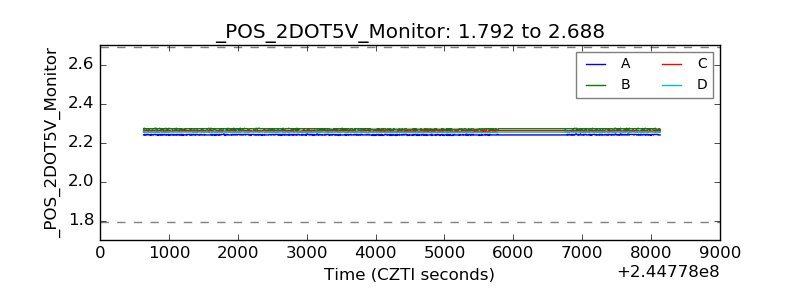 |
| +5 Volts monitor | 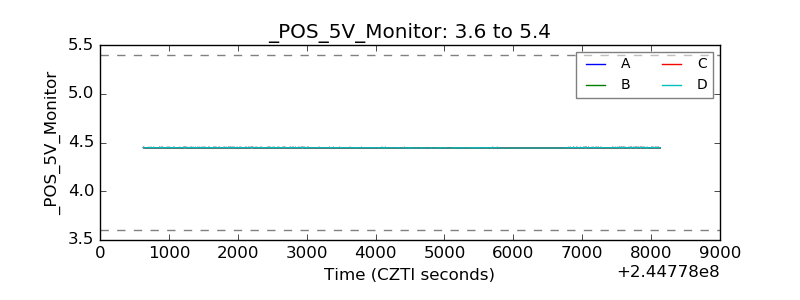 |
| _ROLL_ROT | 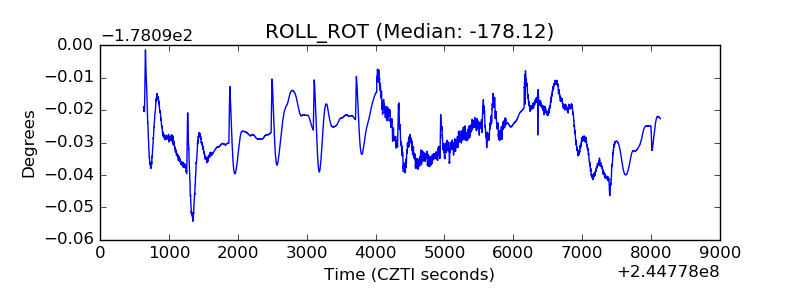 |
| _Roll_DEC | 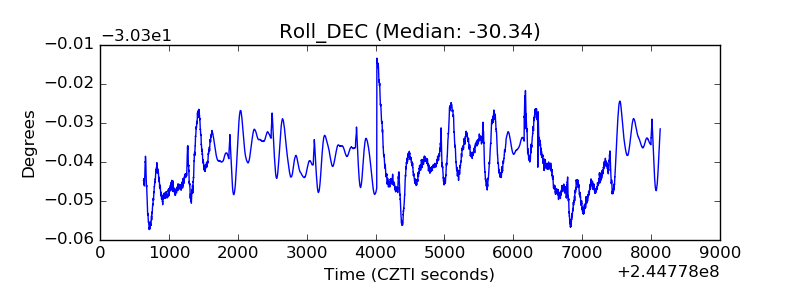 |
| _Roll_RA | 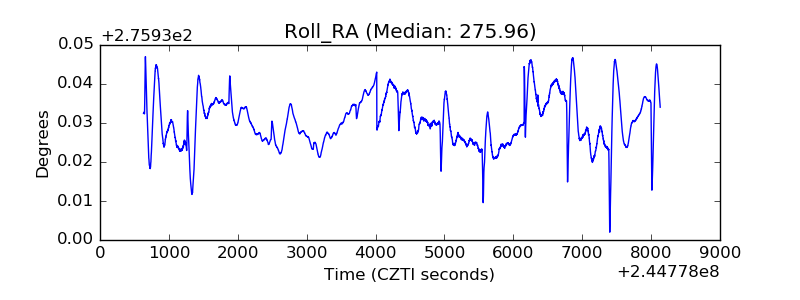 |
| Veto Counter | 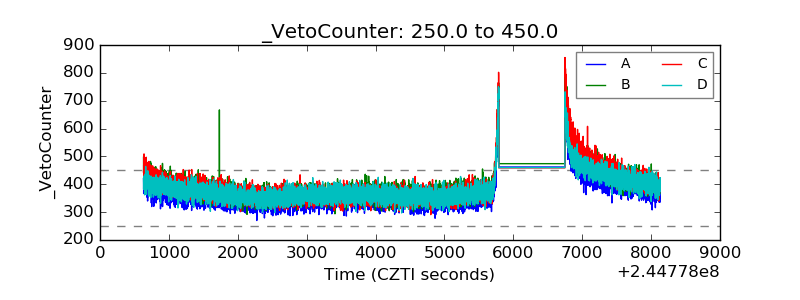 |