| Param | Original file | Final file |
|---|---|---|
| Filename | modeM0/AS1A04_055T02_9000001576_10911cztM0_level2.evt | modeM0/AS1A04_055T02_9000001576_10911cztM0_level2_quad_clean.evt |
| Size (bytes) | 499,066,560 | 85,440,960 |
| Size | 475.9 MB | 81.5 MB |
| Events in quadrant A | 3,682,097 | 541,965 |
| Events in quadrant B | 4,535,857 | 540,695 |
| Events in quadrant C | 3,125,649 | 541,691 |
| Events in quadrant D | 3,335,503 | 515,536 |
| Mode M9 | |||
|---|---|---|---|
| Quadrant | BADHDUFLAG | Total packets | Discarded packets |
| A | 0 | 15 | 0 |
| B | 0 | 15 | 0 |
| C | 0 | 15 | 0 |
| D | 0 | 16 | 0 |
| Mode SS | |||
|---|---|---|---|
| Quadrant | BADHDUFLAG | Total packets | Discarded packets |
| A | 0 | 130 | 0 |
| B | 0 | 130 | 0 |
| C | 0 | 130 | 0 |
| D | 0 | 130 | 0 |
| Mode M0 | |||
|---|---|---|---|
| Quadrant | BADHDUFLAG | Total packets | Discarded packets |
| A | 0 | 14917 | 2 |
| B | 0 | 17668 | 1 |
| C | 0 | 13476 | 1 |
| D | 0 | 13923 | 1 |
| Quadrant | Total seconds | Saturated seconds | Saturation percentage |
|---|---|---|---|
| A | 6412 | 106 | 1.653150% |
| B | 6412 | 470 | 7.330006% |
| C | 6412 | 67 | 1.044916% |
| D | 6412 | 69 | 1.076107% |
Noise dominated data is calculated using 1-second bins in cleaned event files. If a bin has >2000 counts, and if more than 50% of those come from <1% of pixels, then it is considered to be noise-dominated and hence unusable.
| Quadrant | # 1 sec bins | Bins with >0 counts | Bins with >2000 counts | High rate bins dominated by noise | Noise dominated (total time) | Noise dominated (detector-on time) | Marked lightcurve |
|---|---|---|---|---|---|---|---|
| A | 7592 | 6412 | 16 | 16 | 0.21% | 0.25% | 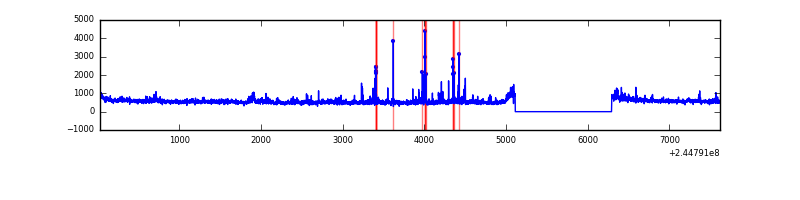 |
| B | 7592 | 6412 | 227 | 227 | 2.99% | 3.54% | 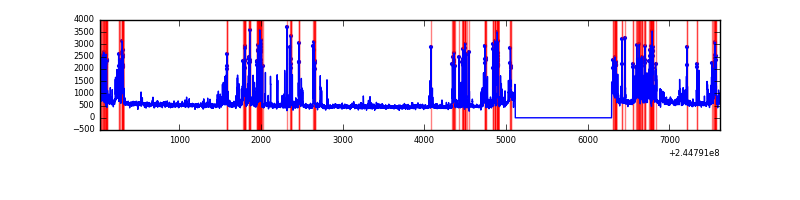 |
| C | 7592 | 6412 | 0 | 0 | 0.00% | 0.00% | 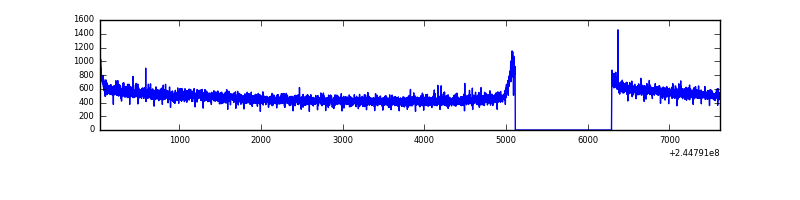 |
| D | 7592 | 6412 | 8 | 8 | 0.11% | 0.12% | 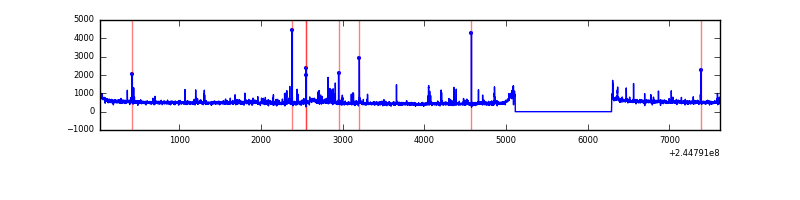 |
Top three noisy pixels from each quadrant. If the there are fewer than three noisy pixels in the level2.evt file, extra rows are filled as -1
| Pixel properties | Quadrant properties | ||||||
|---|---|---|---|---|---|---|---|
| Quadrant | DetID | PixID | Counts | Sigma | Mean | Median | Sigma |
| A | 13 | 251 | 449144 | 2687.99 | 826 | 811 | 166.8 |
| A | 15 | 174 | 41251 | 242.46 | 826 | 811 | 166.8 |
| A | 0 | 226 | 7657 | 41.05 | 826 | 811 | 166.8 |
| B | 4 | 239 | 1270974 | 8309.96 | 807 | 788 | 152.9 |
| B | 0 | 214 | 62382 | 402.97 | 807 | 788 | 152.9 |
| B | 0 | 219 | 20205 | 127.03 | 807 | 788 | 152.9 |
| C | 13 | 61 | 6007 | 28.37 | 800 | 804 | 183.4 |
| C | 12 | 4 | 3331 | 13.78 | 800 | 804 | 183.4 |
| C | 14 | 234 | 3110 | 12.58 | 800 | 804 | 183.4 |
| D | 8 | 195 | 93276 | 484.11 | 799 | 775 | 191.1 |
| D | 13 | 104 | 45711 | 235.17 | 799 | 775 | 191.1 |
| D | 1 | 52 | 39440 | 202.35 | 799 | 775 | 191.1 |
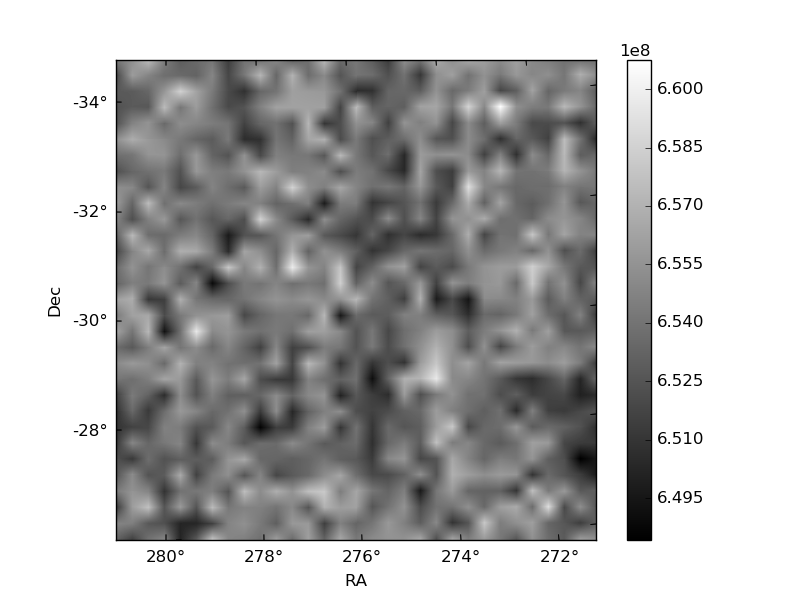
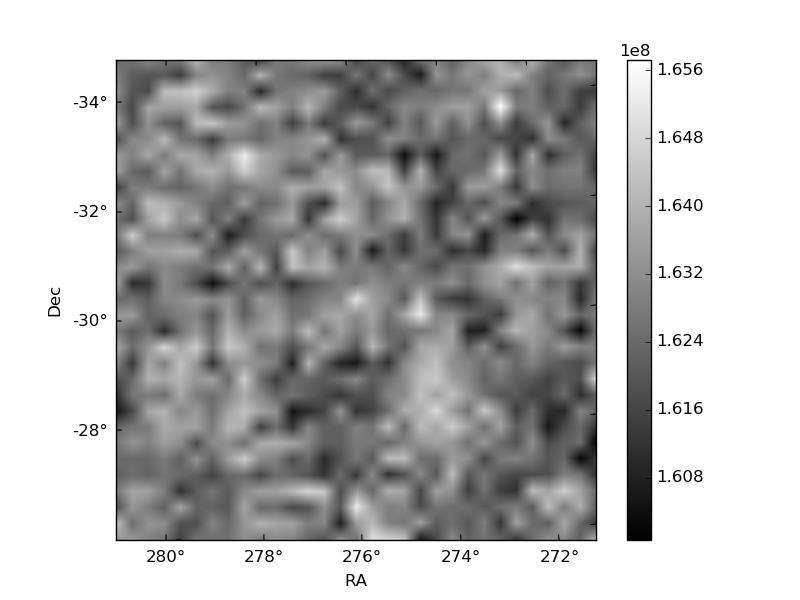
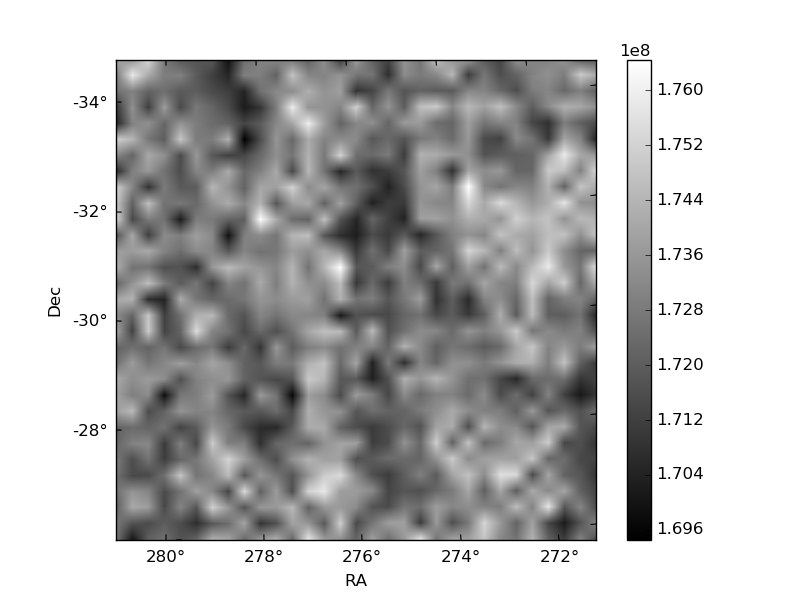
Histogram calculated using DETX and DETY for each event in the final _common_clean file
| Quadrant A | 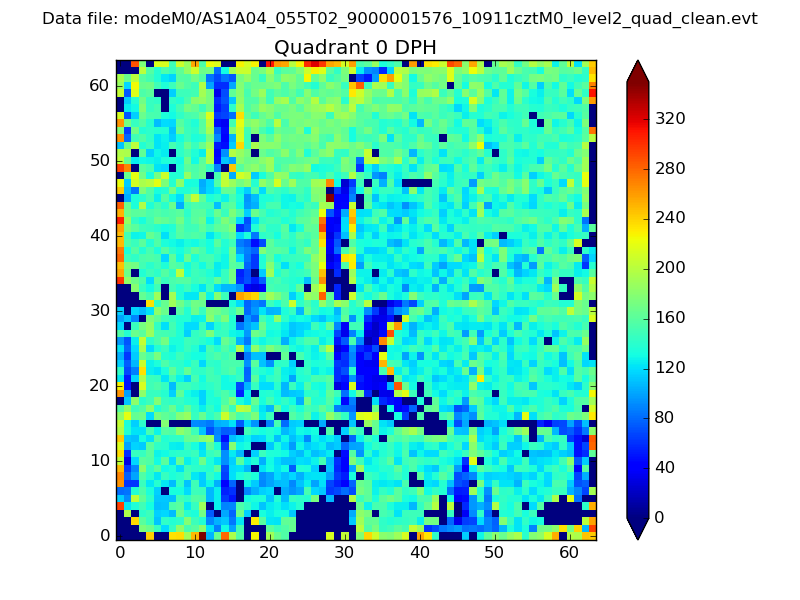 |
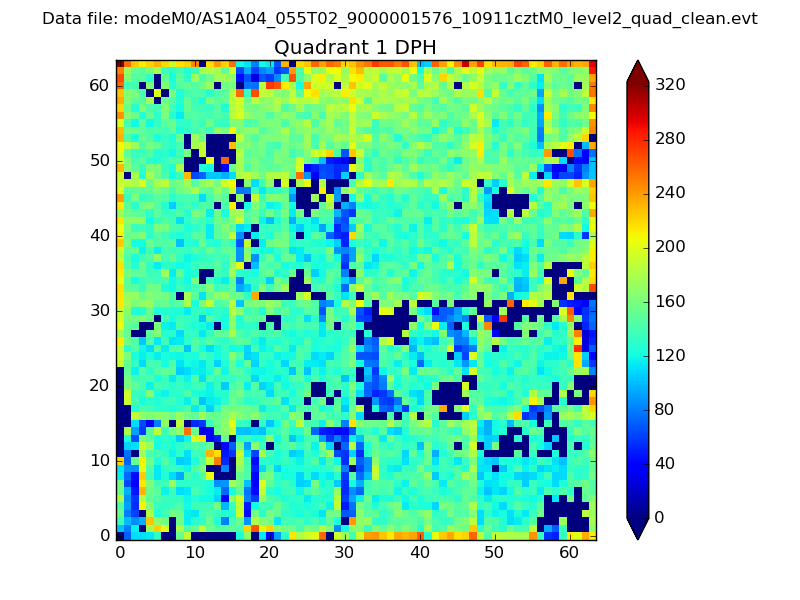 |
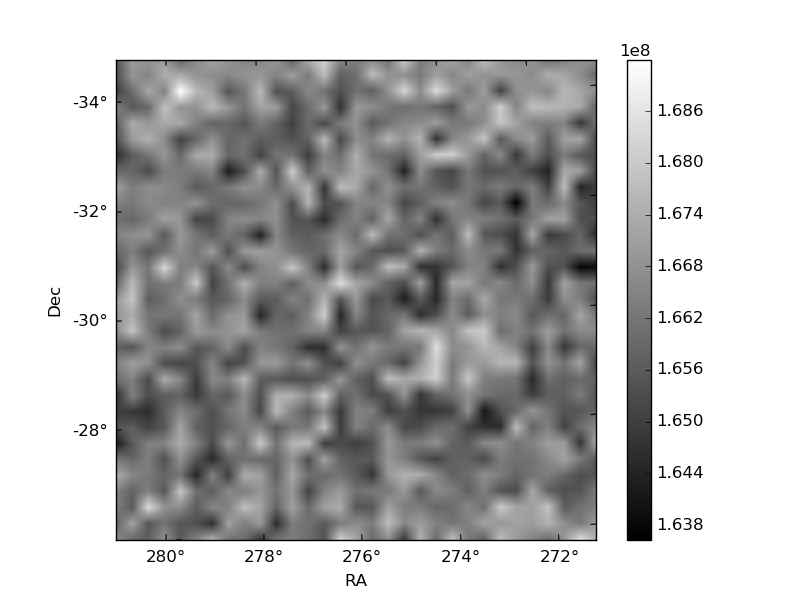
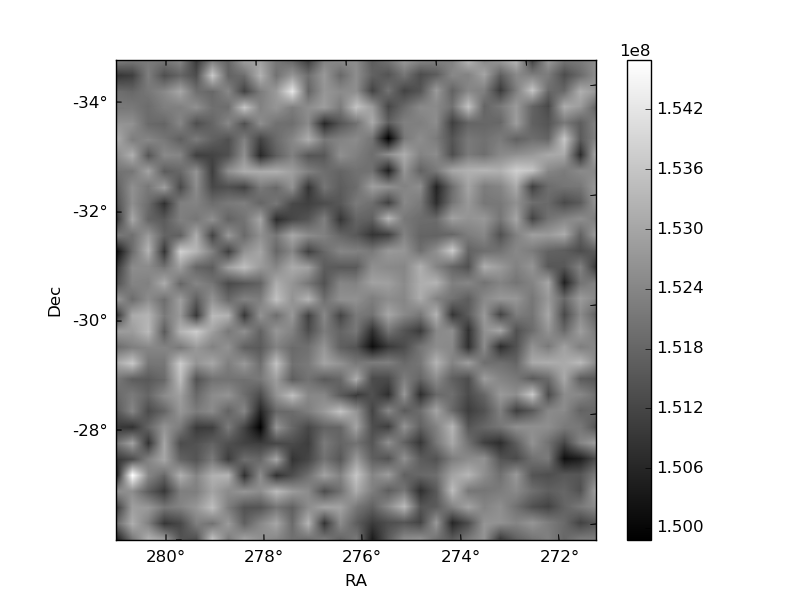
Quadrant B |
|---|---|---|---|
| Quadrant D |  |
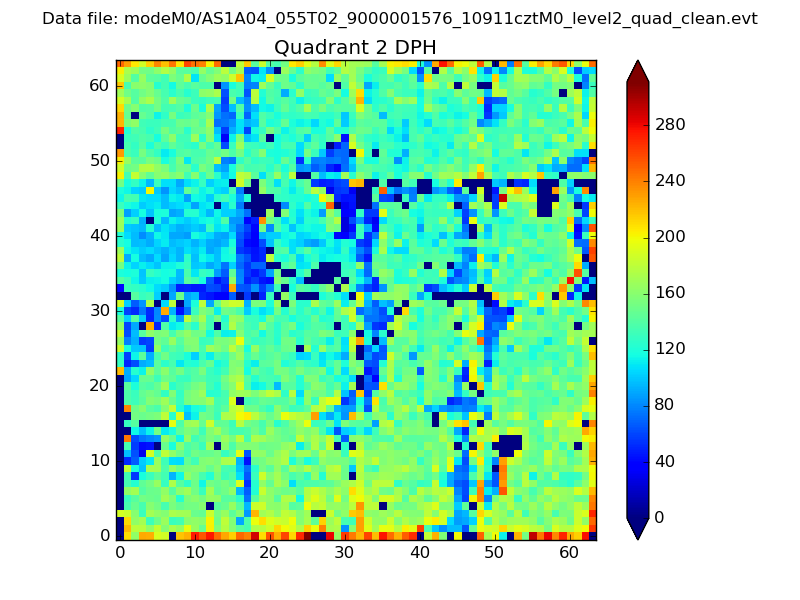 |
Quadrant C |
| Plot type | Count rate plots | Images |
|---|---|---|
| Comparison with Poisson distribution Blue bars denote a histogram of data divided into 1 sec bins. Red curve is a Poisson curve with rate = median count rate of data. |
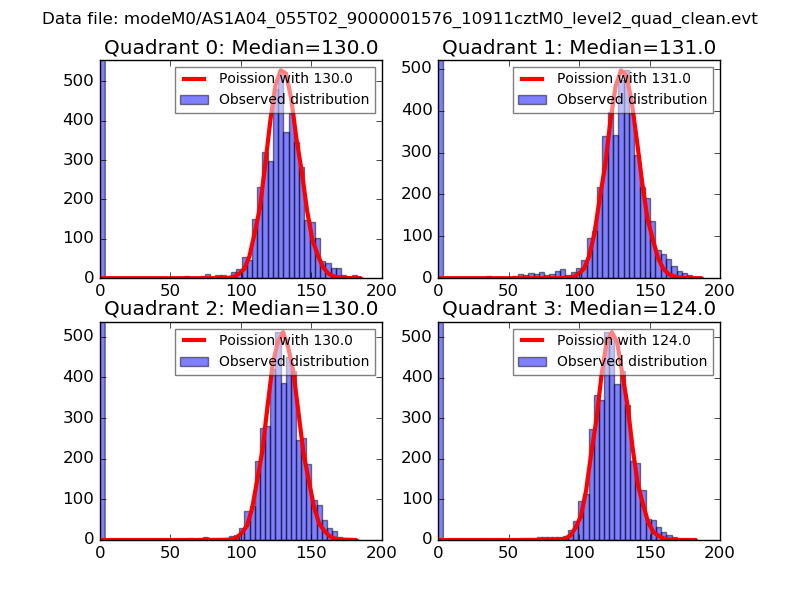 |
 |
| Quadrant-wise count rates Data is divided into 100 sec bins |
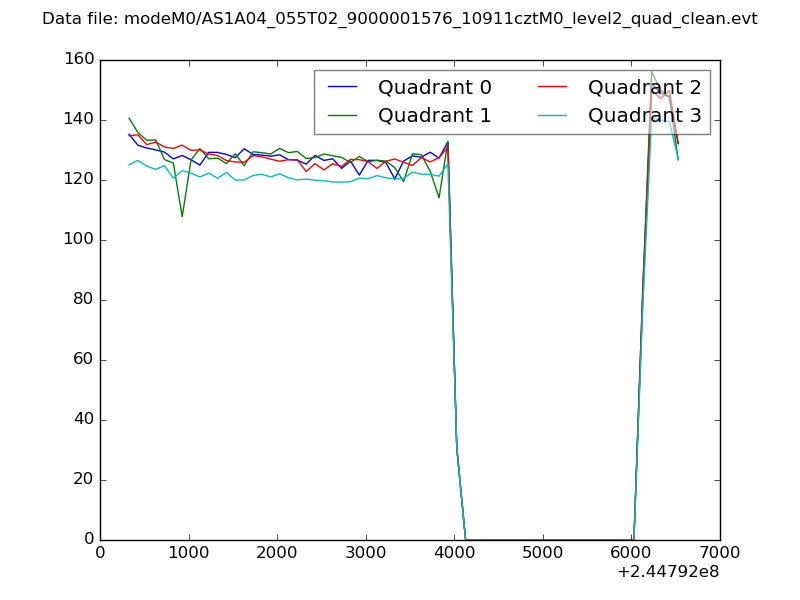 |
|
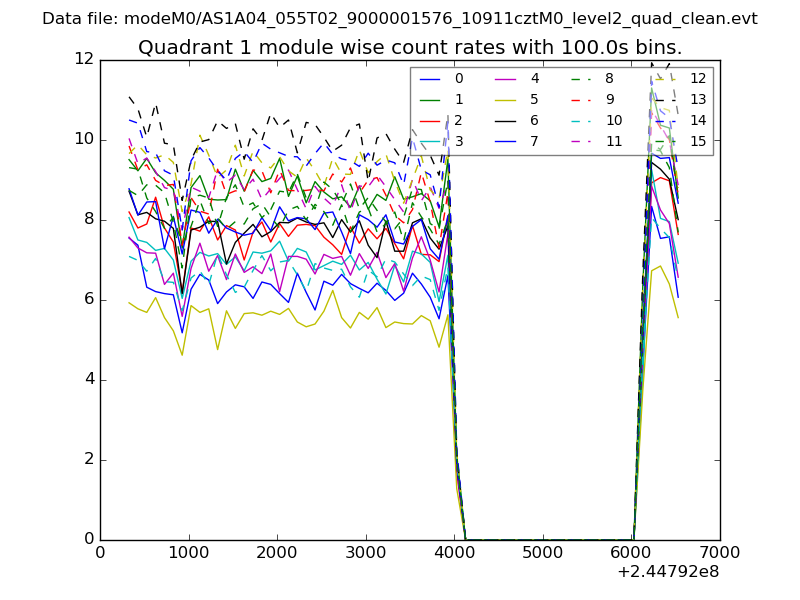
| Module-wise count rates for Quadrant A Data is divided into 100 sec bins |
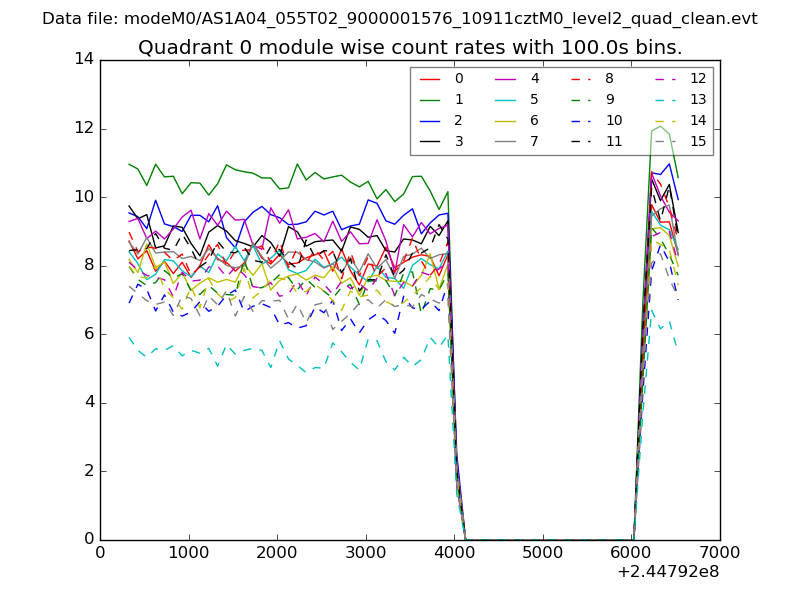 |
 |
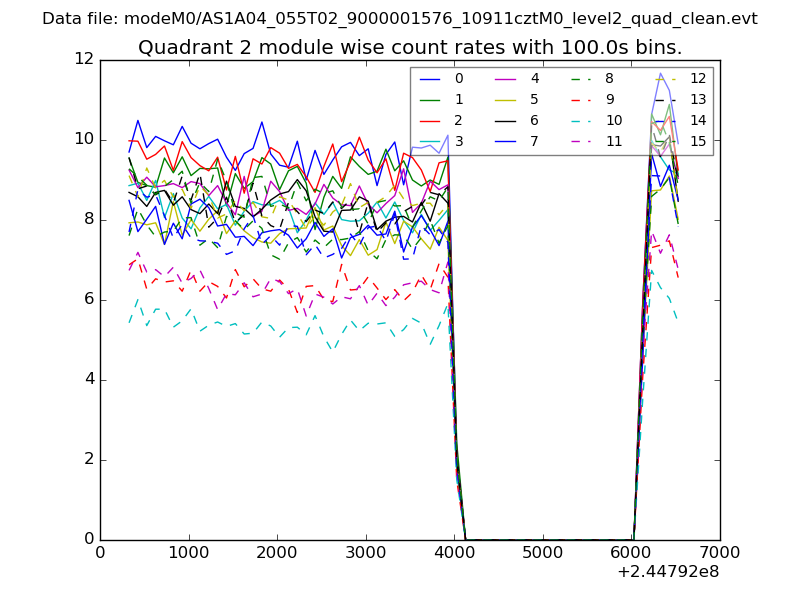
| Module-wise count rates for Quadrant B Data is divided into 100 sec bins |
 |
 |
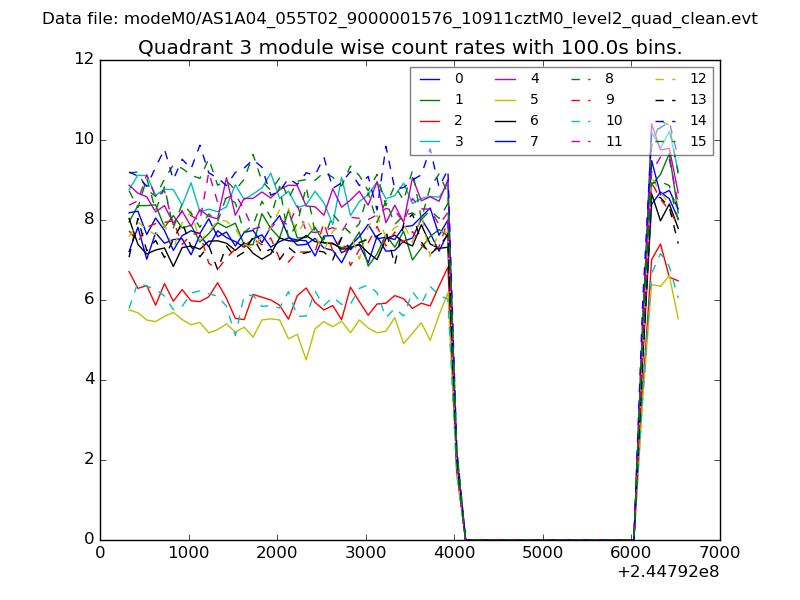
| Module-wise count rates for Quadrant C Data is divided into 100 sec bins |
 |
 |
| Module-wise count rates for Quadrant D Data is divided into 100 sec bins |
 |
 |
| Parameter | Plot |
|---|---|
| CZT HV Monitor | 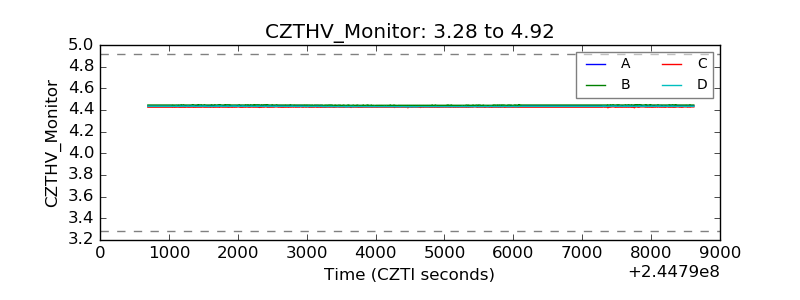 |
| D_VDD | 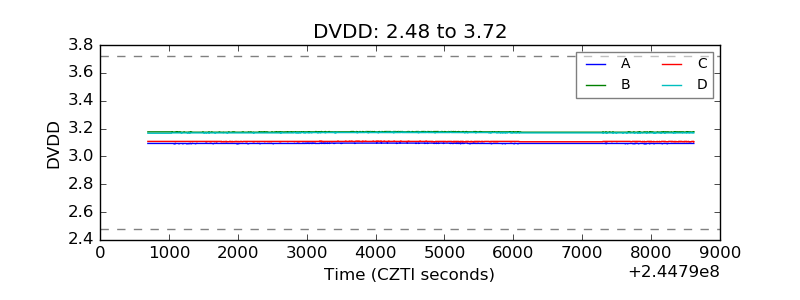 |
| Temperature 1 | 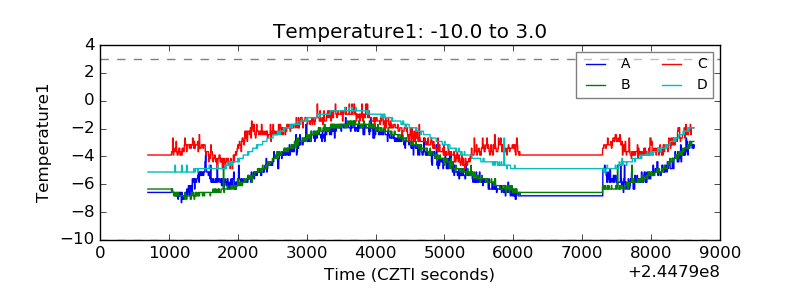 |
| Veto HV Monitor |  |
| Veto LLD | 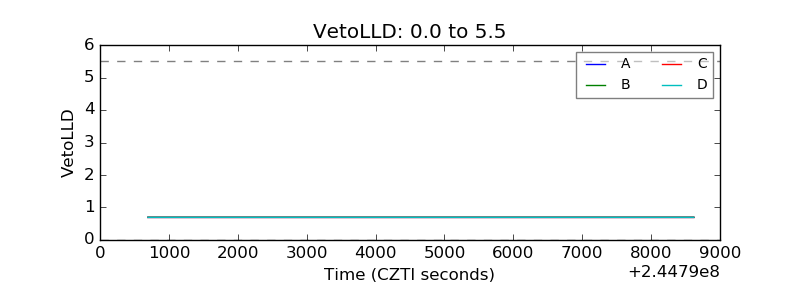 |
| Alpha Counter | 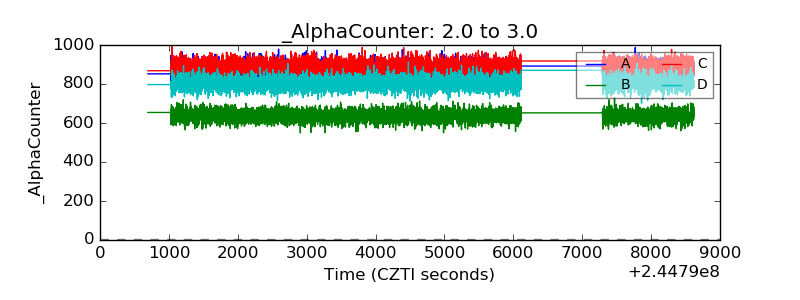 |
| _CPM_Rate | 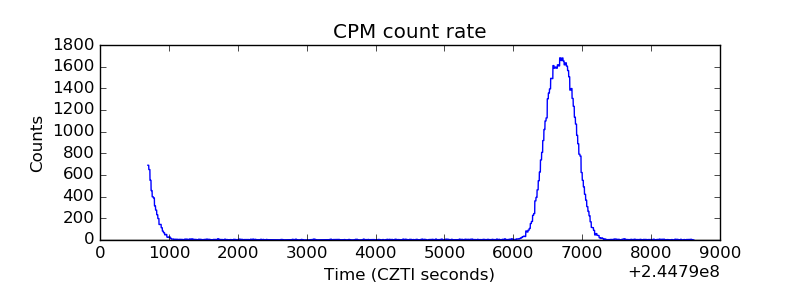 |
| CZT Counter | 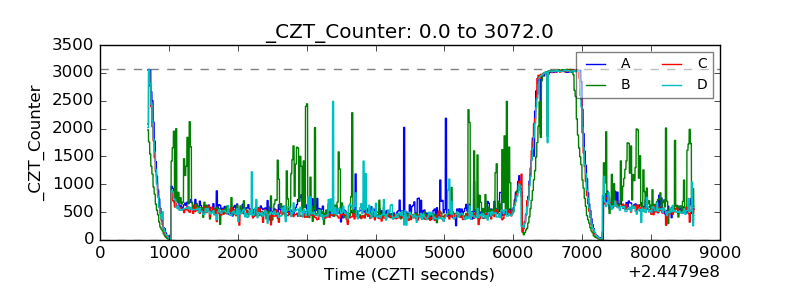 |
| +2.5 Volts monitor |  |
| +5 Volts monitor | 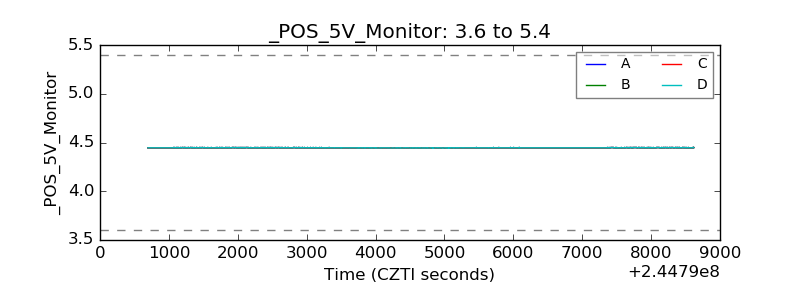 |
| _ROLL_ROT | 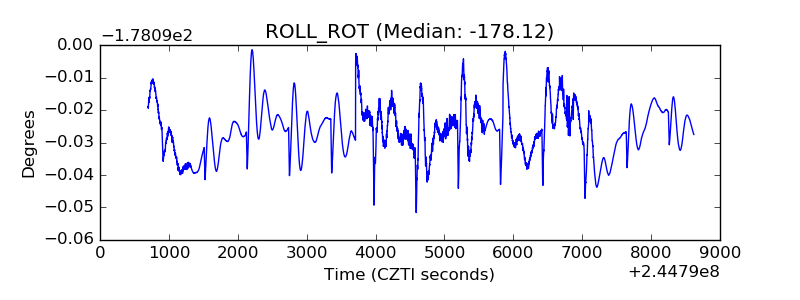 |
| _Roll_DEC | 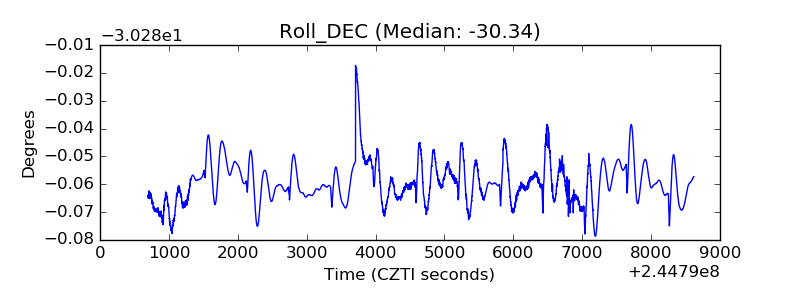 |
| _Roll_RA | 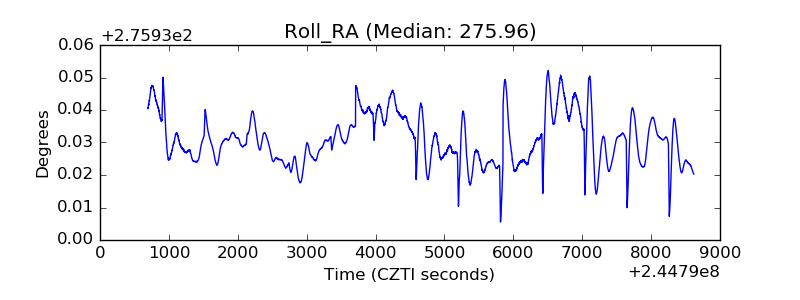 |
| Veto Counter | 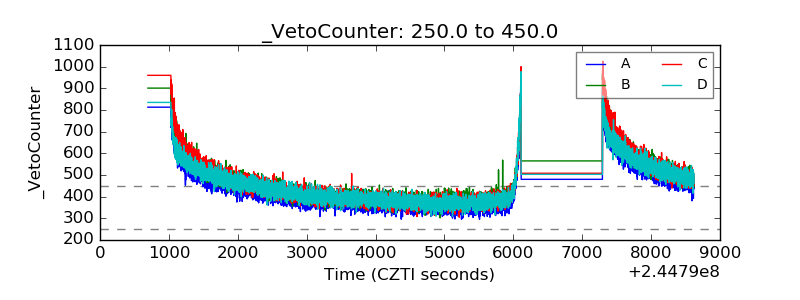 |