| Param | Original file | Final file |
|---|---|---|
| Filename | modeM0/AS1A04_055T02_9000001576_10912cztM0_level2.evt | modeM0/AS1A04_055T02_9000001576_10912cztM0_level2_quad_clean.evt |
| Size (bytes) | 508,417,920 | 95,428,800 |
| Size | 484.9 MB | 91.0 MB |
| Events in quadrant A | 3,675,782 | 626,162 |
| Events in quadrant B | 4,919,156 | 620,135 |
| Events in quadrant C | 3,054,961 | 622,021 |
| Events in quadrant D | 3,329,449 | 591,179 |
| Mode M9 | |||
|---|---|---|---|
| Quadrant | BADHDUFLAG | Total packets | Discarded packets |
| A | 0 | 13 | 0 |
| B | 0 | 13 | 0 |
| C | 0 | 13 | 0 |
| D | 0 | 13 | 0 |
| Mode SS | |||
|---|---|---|---|
| Quadrant | BADHDUFLAG | Total packets | Discarded packets |
| A | 0 | 126 | 0 |
| B | 0 | 126 | 0 |
| C | 0 | 126 | 0 |
| D | 0 | 126 | 0 |
| Mode M0 | |||
|---|---|---|---|
| Quadrant | BADHDUFLAG | Total packets | Discarded packets |
| A | 0 | 14889 | 2 |
| B | 0 | 18880 | 1 |
| C | 0 | 13046 | 1 |
| D | 0 | 13793 | 1 |
| Quadrant | Total seconds | Saturated seconds | Saturation percentage |
|---|---|---|---|
| A | 6165 | 108 | 1.751825% |
| B | 6165 | 431 | 6.991079% |
| C | 6165 | 47 | 0.762368% |
| D | 6165 | 104 | 1.686942% |
Noise dominated data is calculated using 1-second bins in cleaned event files. If a bin has >2000 counts, and if more than 50% of those come from <1% of pixels, then it is considered to be noise-dominated and hence unusable.
| Quadrant | # 1 sec bins | Bins with >0 counts | Bins with >2000 counts | High rate bins dominated by noise | Noise dominated (total time) | Noise dominated (detector-on time) | Marked lightcurve |
|---|---|---|---|---|---|---|---|
| A | 7415 | 6166 | 21 | 21 | 0.28% | 0.34% | 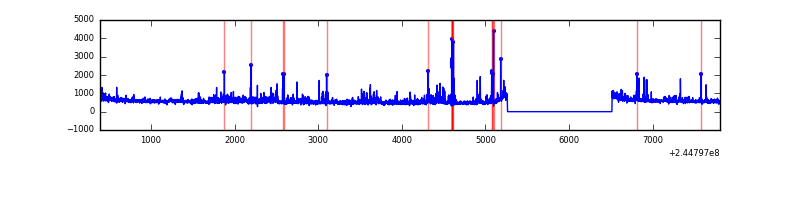 |
| B | 7415 | 6166 | 213 | 213 | 2.87% | 3.45% | 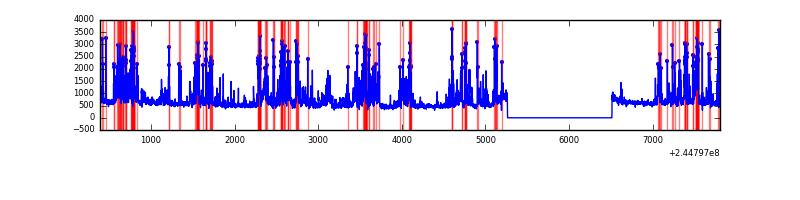 |
| C | 7415 | 6166 | 0 | 0 | 0.00% | 0.00% | 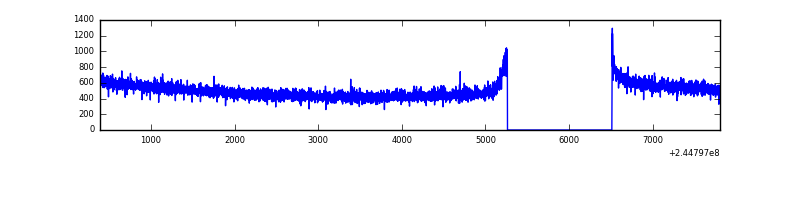 |
| D | 7415 | 6166 | 44 | 44 | 0.59% | 0.71% | 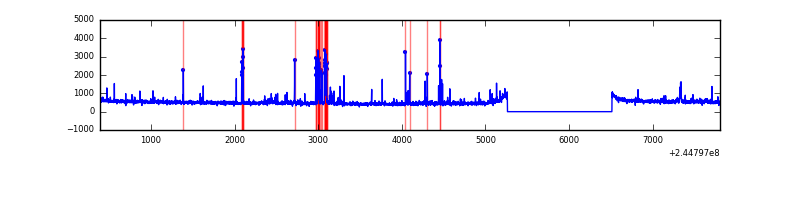 |
Top three noisy pixels from each quadrant. If the there are fewer than three noisy pixels in the level2.evt file, extra rows are filled as -1
| Pixel properties | Quadrant properties | ||||||
|---|---|---|---|---|---|---|---|
| Quadrant | DetID | PixID | Counts | Sigma | Mean | Median | Sigma |
| A | 13 | 251 | 507569 | 3074.01 | 816 | 801 | 164.9 |
| A | 15 | 223 | 9147 | 50.63 | 816 | 801 | 164.9 |
| A | 0 | 226 | 7706 | 41.89 | 816 | 801 | 164.9 |
| B | 4 | 239 | 1692605 | 11341.88 | 796 | 780 | 149.2 |
| B | 0 | 214 | 52902 | 349.42 | 796 | 780 | 149.2 |
| B | 10 | 245 | 30579 | 199.77 | 796 | 780 | 149.2 |
| C | 13 | 61 | 5773 | 27.93 | 782 | 790 | 178.4 |
| C | 5 | 207 | 2210 | 7.96 | 782 | 790 | 178.4 |
| C | 8 | 222 | 2191 | 7.85 | 782 | 790 | 178.4 |
| D | 5 | 97 | 137424 | 735.22 | 786 | 764 | 185.9 |
| D | 10 | 253 | 43770 | 231.37 | 786 | 764 | 185.9 |
| D | 13 | 104 | 41106 | 217.04 | 786 | 764 | 185.9 |
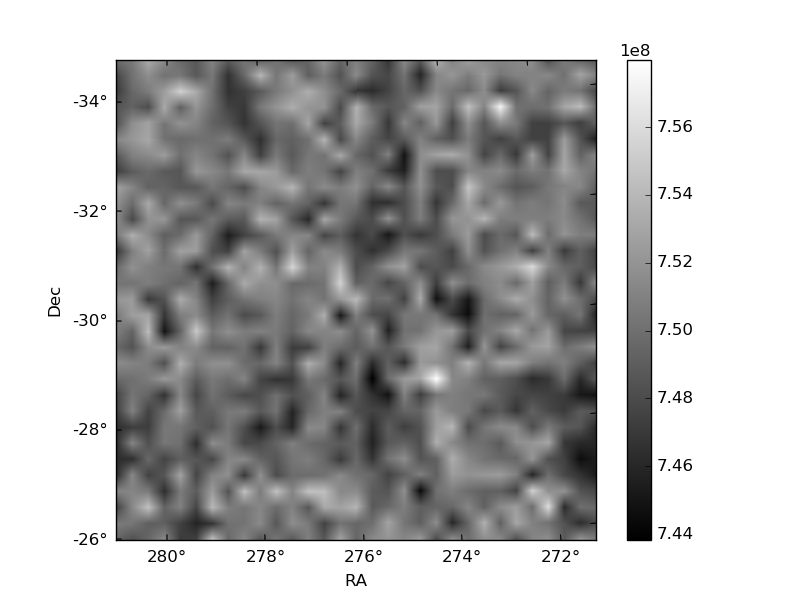
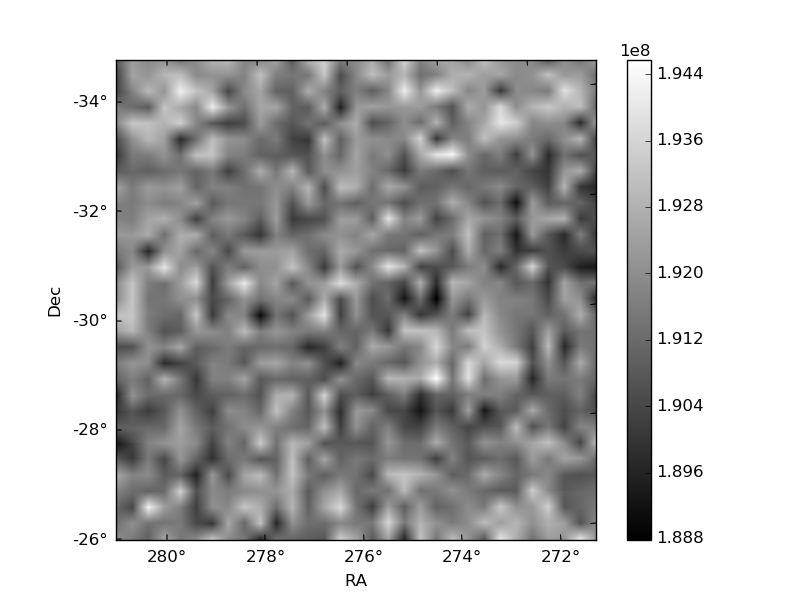
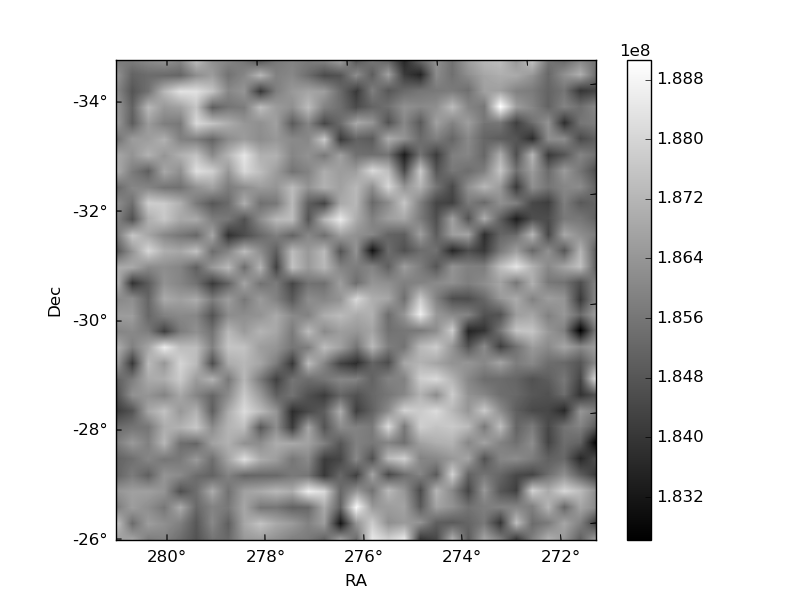
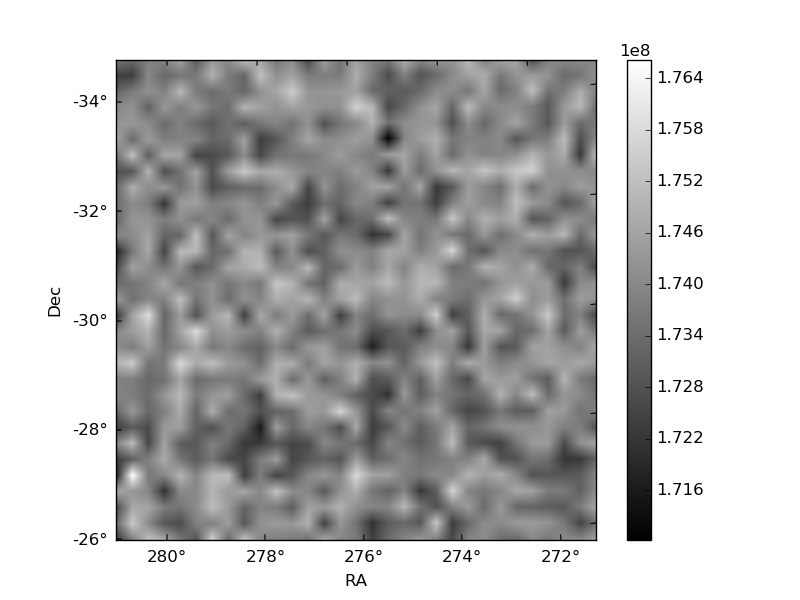
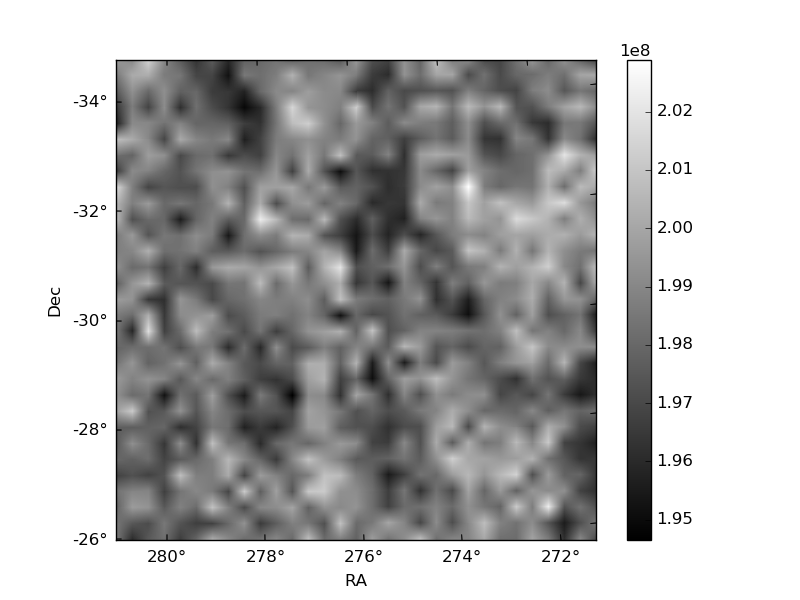
Histogram calculated using DETX and DETY for each event in the final _common_clean file
| Quadrant A | 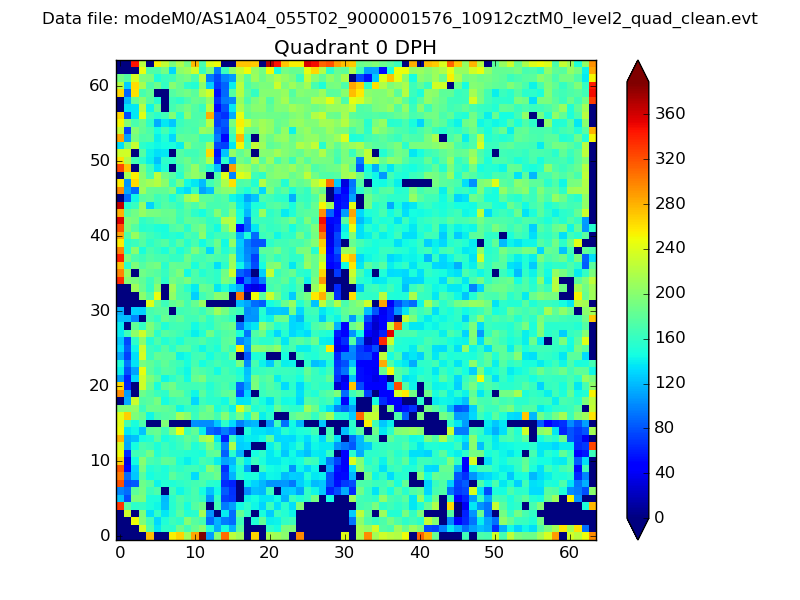 |
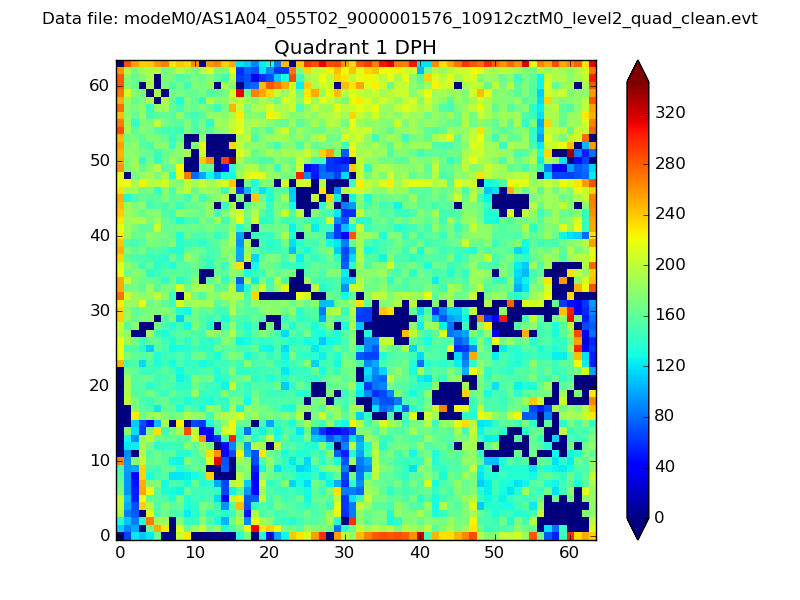 |
Quadrant B |
|---|---|---|---|
| Quadrant D | 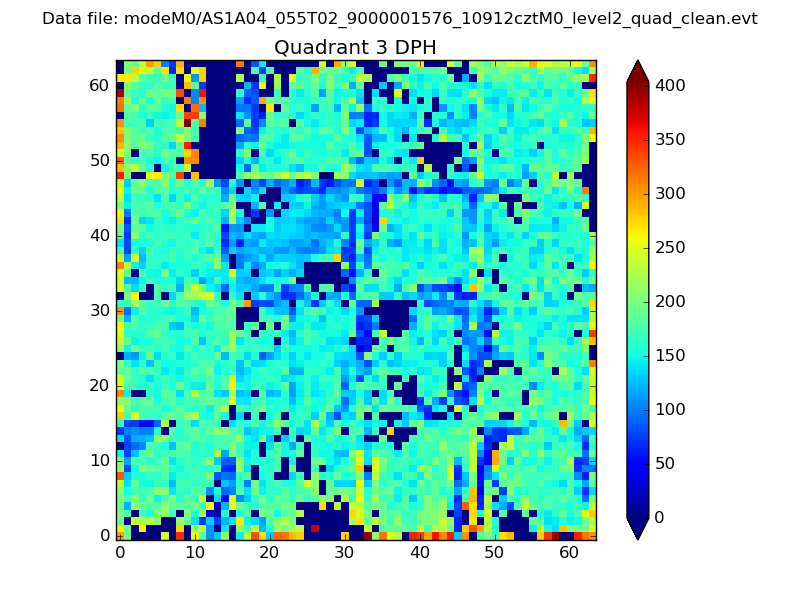 |
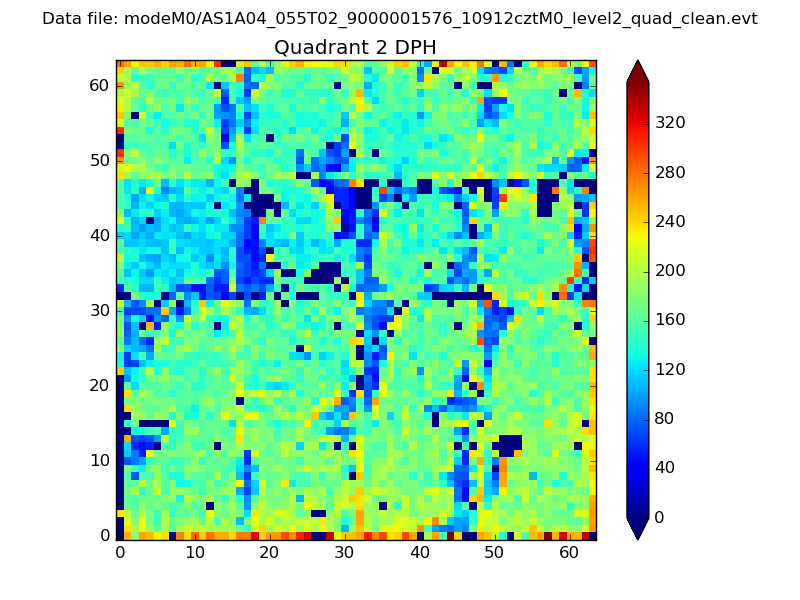 |
Quadrant C |
| Plot type | Count rate plots | Images |
|---|---|---|
| Comparison with Poisson distribution Blue bars denote a histogram of data divided into 1 sec bins. Red curve is a Poisson curve with rate = median count rate of data. |
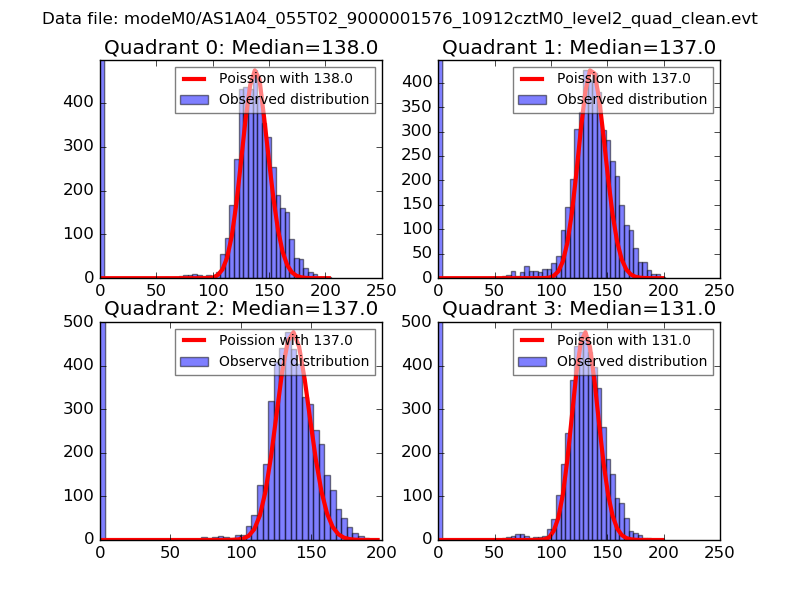 |
 |
| Quadrant-wise count rates Data is divided into 100 sec bins |
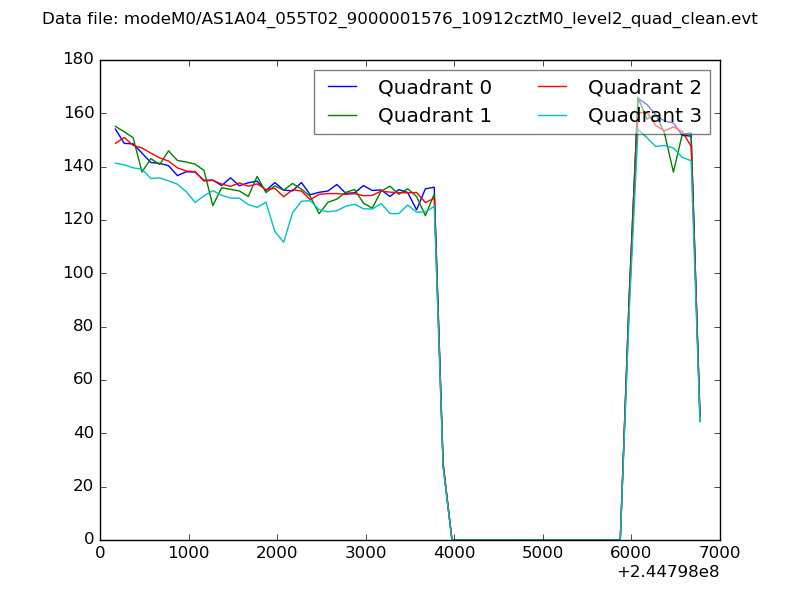 |
|
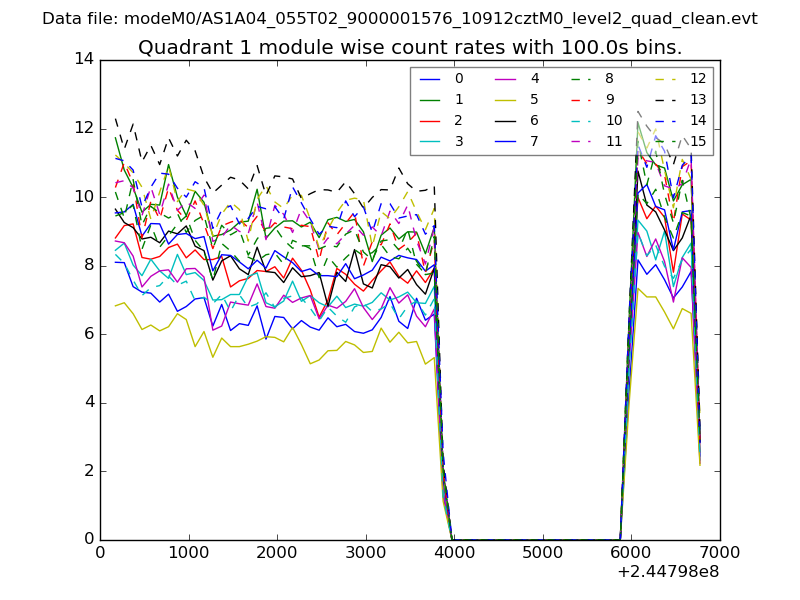
| Module-wise count rates for Quadrant A Data is divided into 100 sec bins |
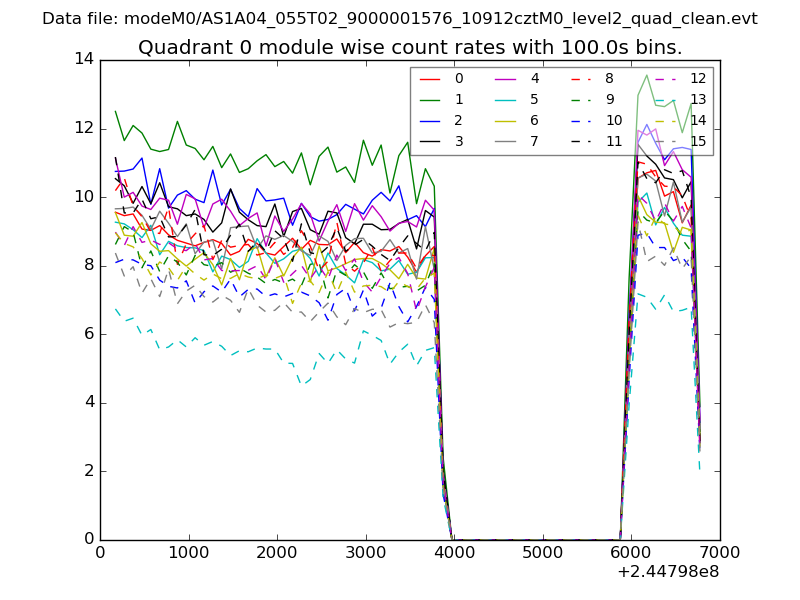 |
 |
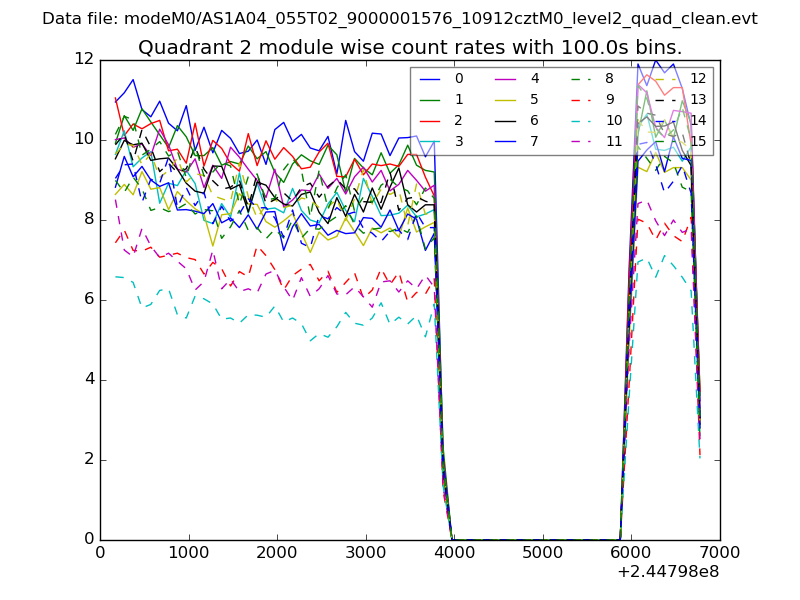
| Module-wise count rates for Quadrant B Data is divided into 100 sec bins |
 |
 |
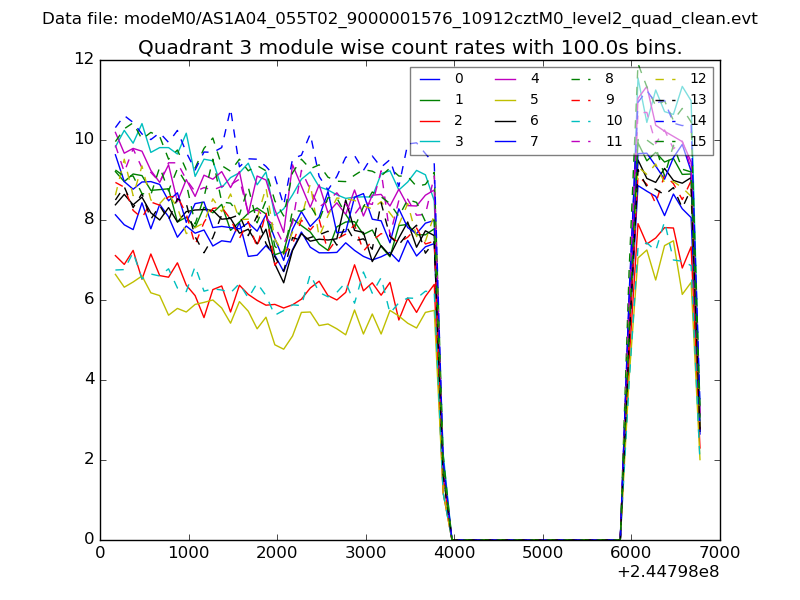
| Module-wise count rates for Quadrant C Data is divided into 100 sec bins |
 |
 |
| Module-wise count rates for Quadrant D Data is divided into 100 sec bins |
 |
 |
| Parameter | Plot |
|---|---|
| CZT HV Monitor | 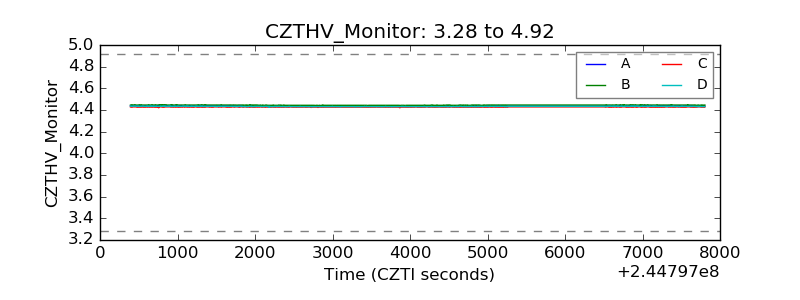 |
| D_VDD | 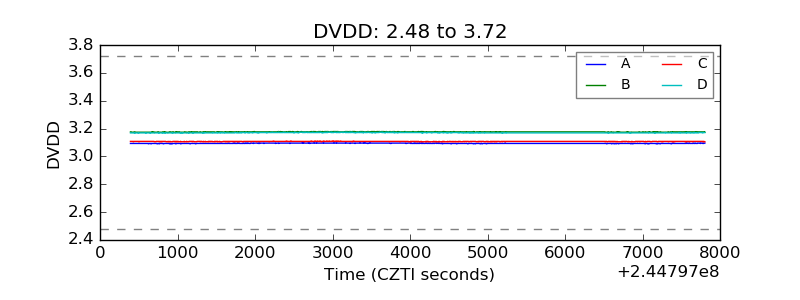 |
| Temperature 1 | 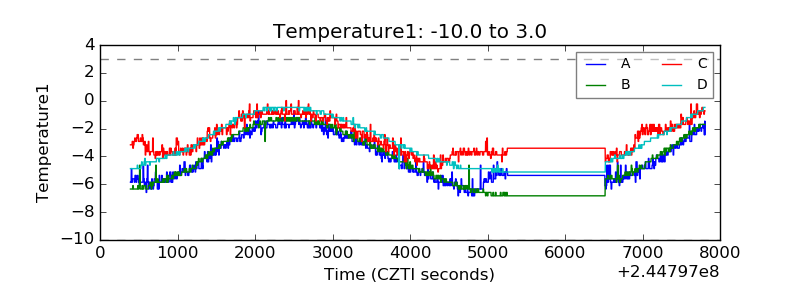 |
| Veto HV Monitor | 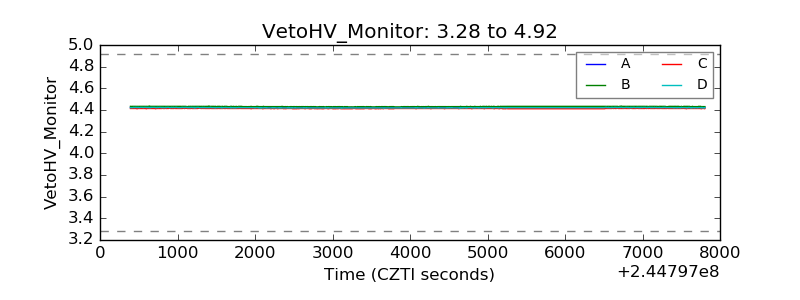 |
| Veto LLD | 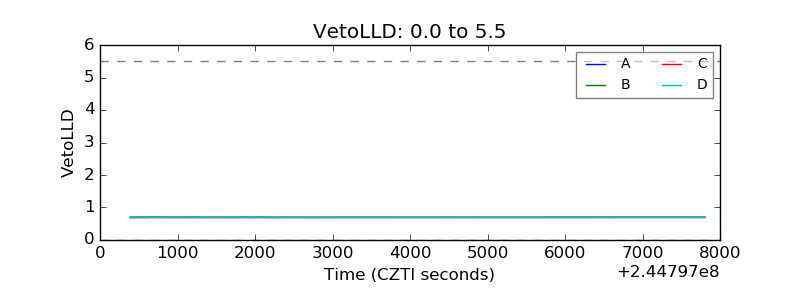 |
| Alpha Counter | 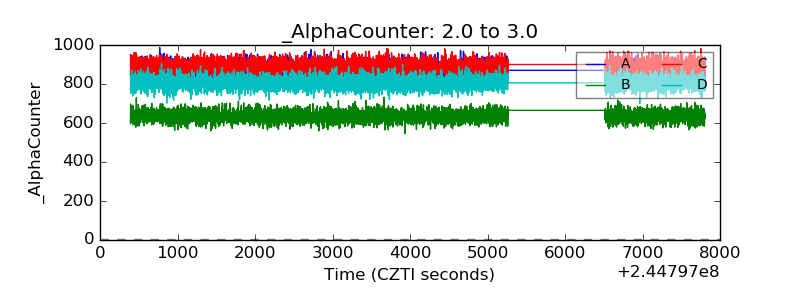 |
| _CPM_Rate | 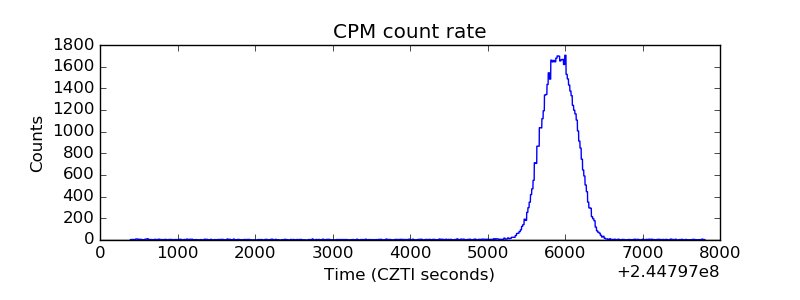 |
| CZT Counter | 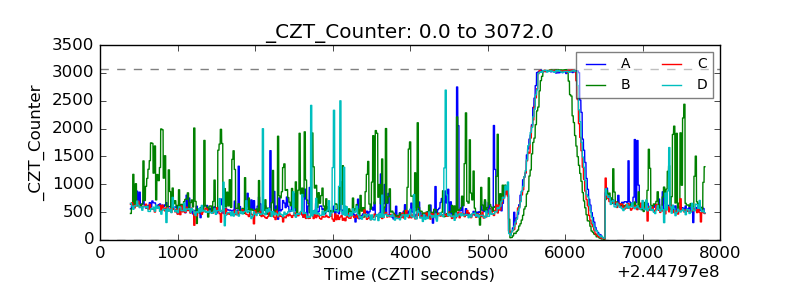 |
| +2.5 Volts monitor |  |
| +5 Volts monitor | 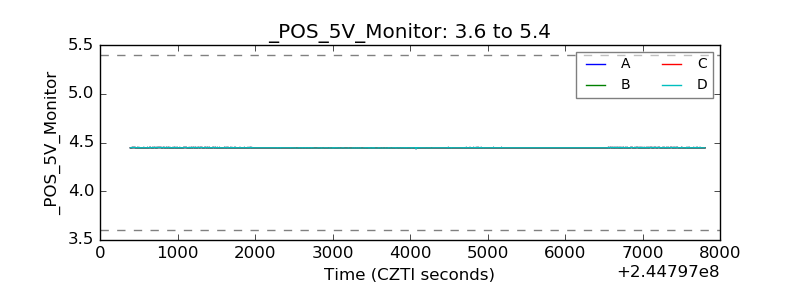 |
| _ROLL_ROT | 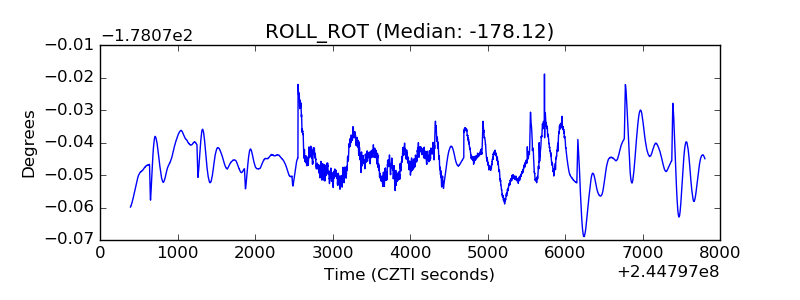 |
| _Roll_DEC | 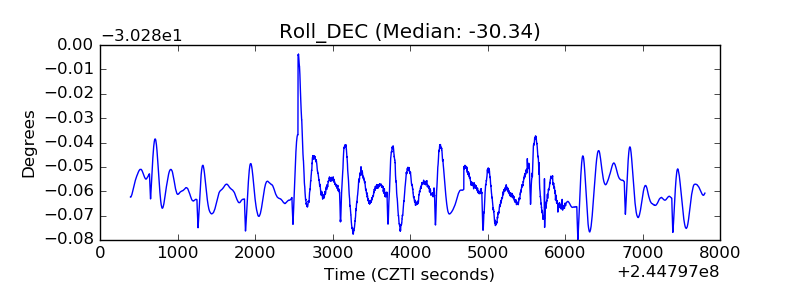 |
| _Roll_RA | 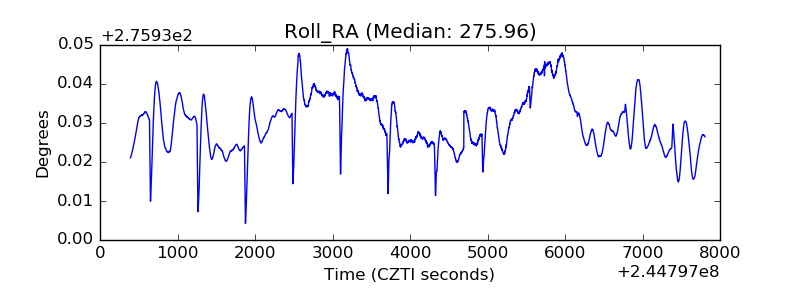 |
| Veto Counter | 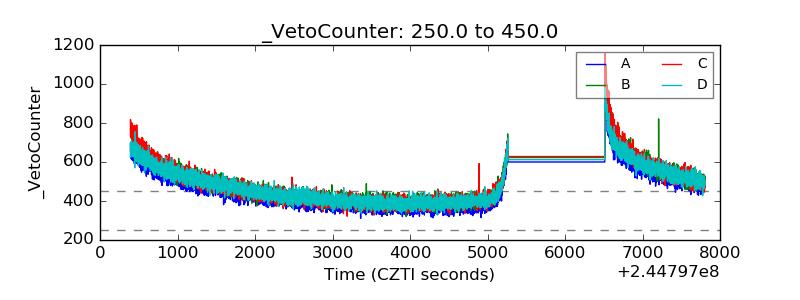 |