| Param | Original file | Final file |
|---|---|---|
| Filename | modeM0/AS1A04_055T02_9000001576_10913cztM0_level2.evt | modeM0/AS1A04_055T02_9000001576_10913cztM0_level2_quad_clean.evt |
| Size (bytes) | 442,923,840 | 104,028,480 |
| Size | 422.4 MB | 99.2 MB |
| Events in quadrant A | 3,272,178 | 701,919 |
| Events in quadrant B | 3,762,708 | 700,074 |
| Events in quadrant C | 2,773,600 | 692,138 |
| Events in quadrant D | 3,216,913 | 656,472 |
| Mode M9 | |||
|---|---|---|---|
| Quadrant | BADHDUFLAG | Total packets | Discarded packets |
| A | 0 | 12 | 0 |
| B | 0 | 12 | 0 |
| C | 0 | 12 | 0 |
| D | 0 | 12 | 0 |
| Mode SS | |||
|---|---|---|---|
| Quadrant | BADHDUFLAG | Total packets | Discarded packets |
| A | 0 | 118 | 0 |
| B | 0 | 118 | 0 |
| C | 0 | 118 | 0 |
| D | 0 | 118 | 0 |
| Mode M0 | |||
|---|---|---|---|
| Quadrant | BADHDUFLAG | Total packets | Discarded packets |
| A | 0 | 13242 | 2 |
| B | 0 | 14963 | 1 |
| C | 0 | 11882 | 1 |
| D | 0 | 13354 | 1 |
| Quadrant | Total seconds | Saturated seconds | Saturation percentage |
|---|---|---|---|
| A | 5716 | 119 | 2.081875% |
| B | 5716 | 241 | 4.216235% |
| C | 5716 | 63 | 1.102169% |
| D | 5716 | 101 | 1.766970% |
Noise dominated data is calculated using 1-second bins in cleaned event files. If a bin has >2000 counts, and if more than 50% of those come from <1% of pixels, then it is considered to be noise-dominated and hence unusable.
| Quadrant | # 1 sec bins | Bins with >0 counts | Bins with >2000 counts | High rate bins dominated by noise | Noise dominated (total time) | Noise dominated (detector-on time) | Marked lightcurve |
|---|---|---|---|---|---|---|---|
| A | 6996 | 5717 | 17 | 17 | 0.24% | 0.30% | 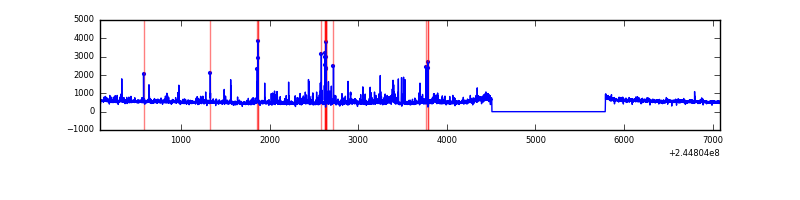 |
| B | 6996 | 5717 | 83 | 83 | 1.19% | 1.45% | 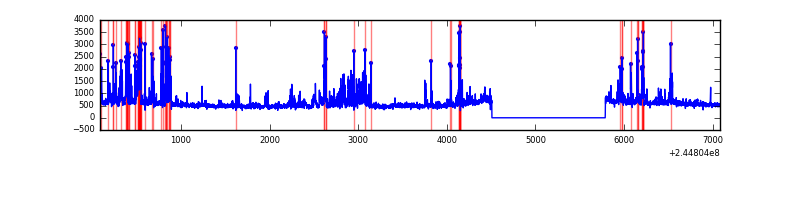 |
| C | 6996 | 5717 | 0 | 0 | 0.00% | 0.00% | 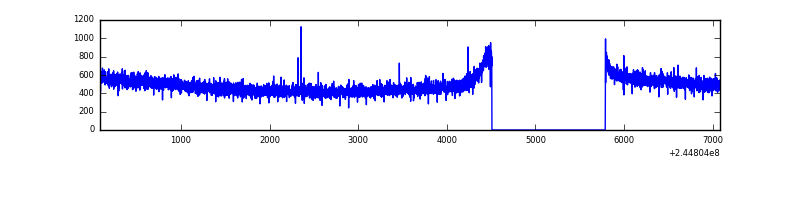 |
| D | 6996 | 5717 | 32 | 32 | 0.46% | 0.56% | 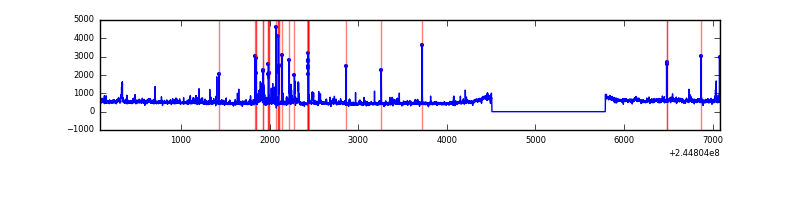 |
Top three noisy pixels from each quadrant. If the there are fewer than three noisy pixels in the level2.evt file, extra rows are filled as -1
| Pixel properties | Quadrant properties | ||||||
|---|---|---|---|---|---|---|---|
| Quadrant | DetID | PixID | Counts | Sigma | Mean | Median | Sigma |
| A | 13 | 251 | 374868 | 2506.58 | 744 | 731 | 149.3 |
| A | 11 | 29 | 9729 | 60.28 | 744 | 731 | 149.3 |
| A | 15 | 223 | 7192 | 43.29 | 744 | 731 | 149.3 |
| B | 4 | 239 | 718711 | 5259.16 | 732 | 718 | 136.5 |
| B | 0 | 214 | 68893 | 499.37 | 732 | 718 | 136.5 |
| B | 10 | 245 | 46472 | 335.14 | 732 | 718 | 136.5 |
| C | 13 | 61 | 5289 | 28.27 | 709 | 713 | 161.9 |
| C | 14 | 234 | 2912 | 13.58 | 709 | 713 | 161.9 |
| C | 7 | 235 | 2331 | 10.0 | 709 | 713 | 161.9 |
| D | 13 | 152 | 112155 | 655.22 | 715 | 697 | 170.1 |
| D | 5 | 222 | 77151 | 449.44 | 715 | 697 | 170.1 |
| D | 1 | 52 | 64418 | 374.59 | 715 | 697 | 170.1 |
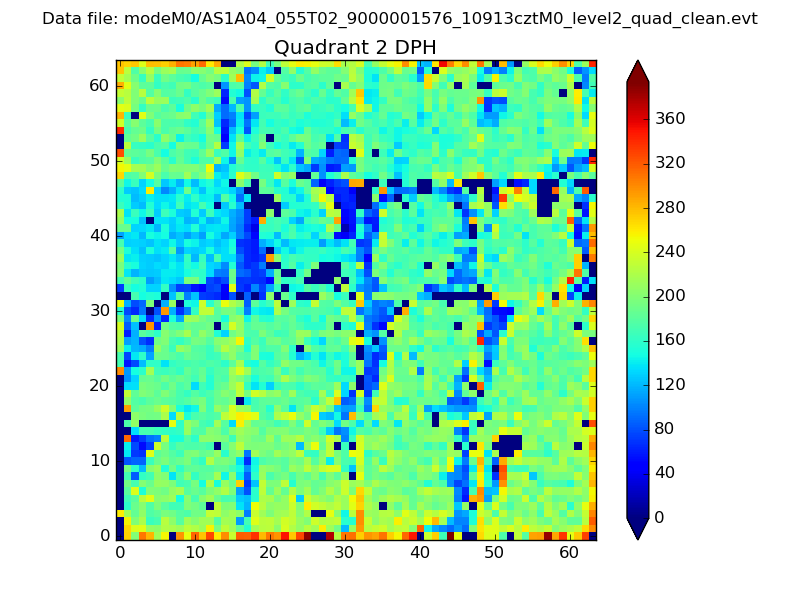
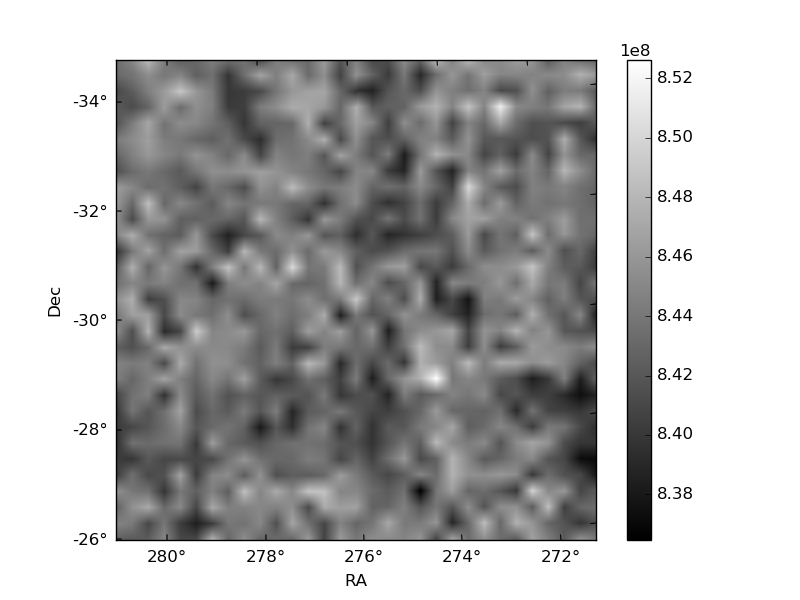
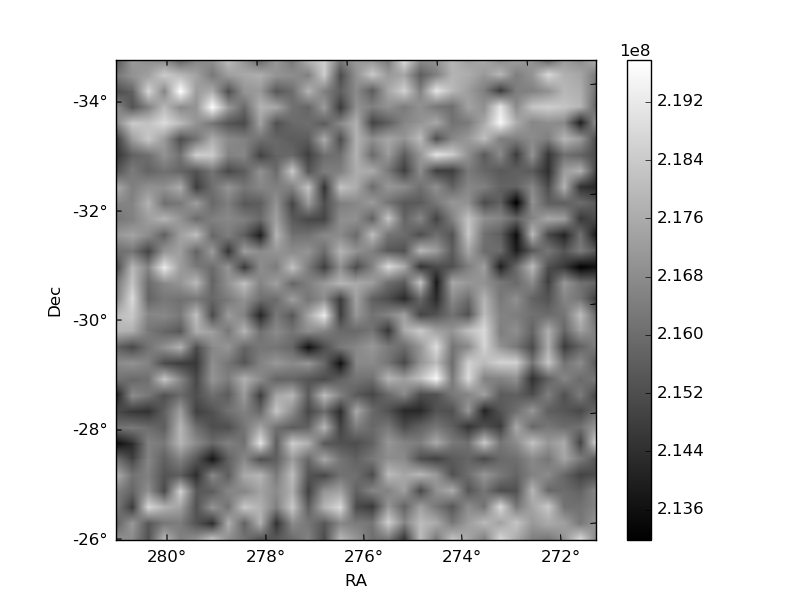
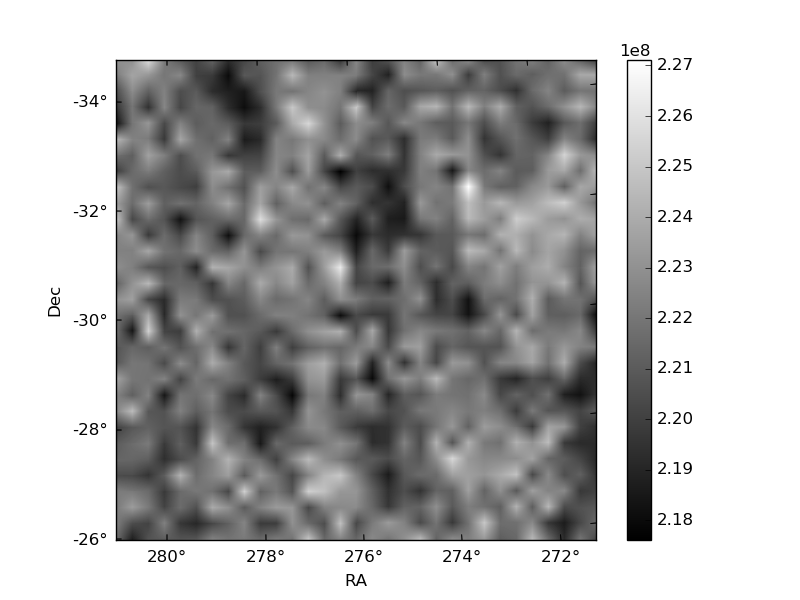
Histogram calculated using DETX and DETY for each event in the final _common_clean file
| Quadrant A | 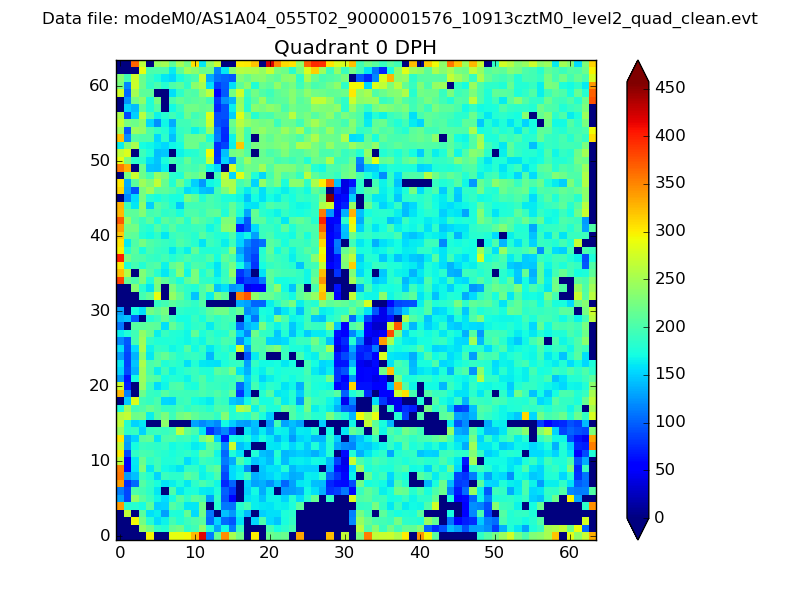 |
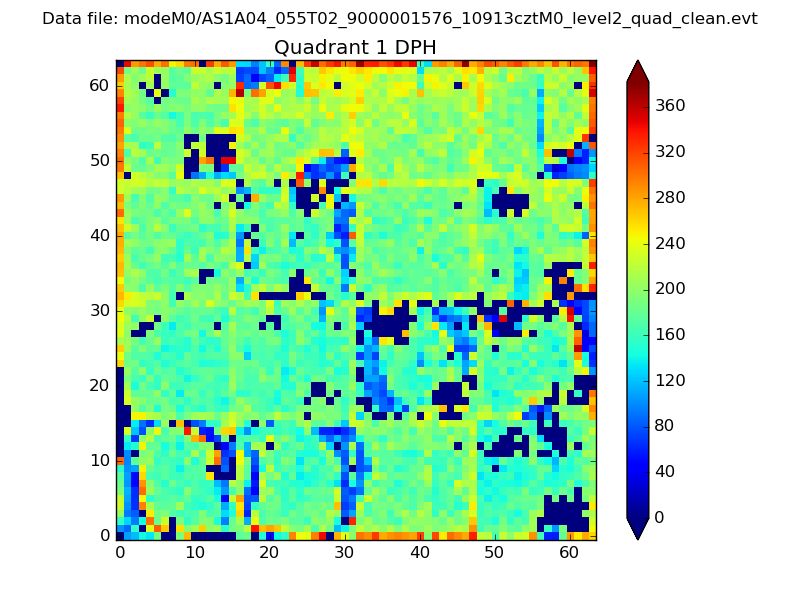 |
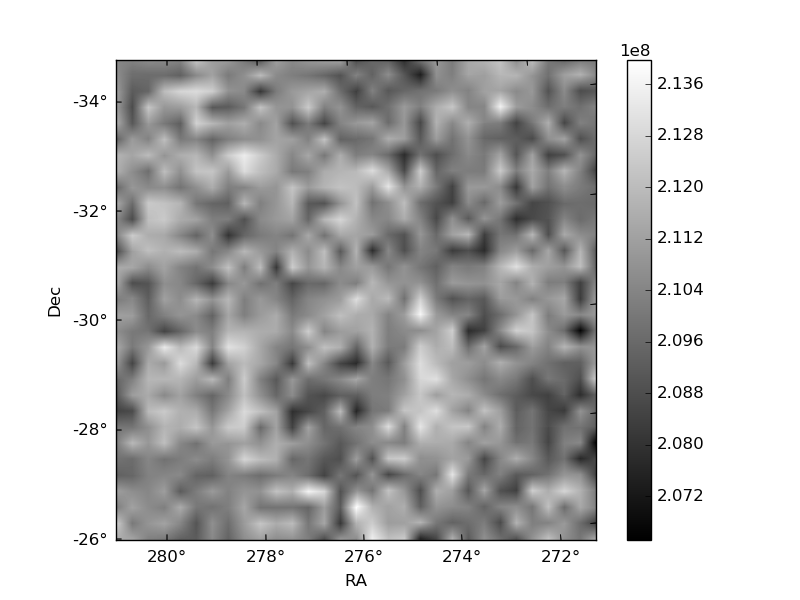
Quadrant B |
|---|---|---|---|
| Quadrant D | 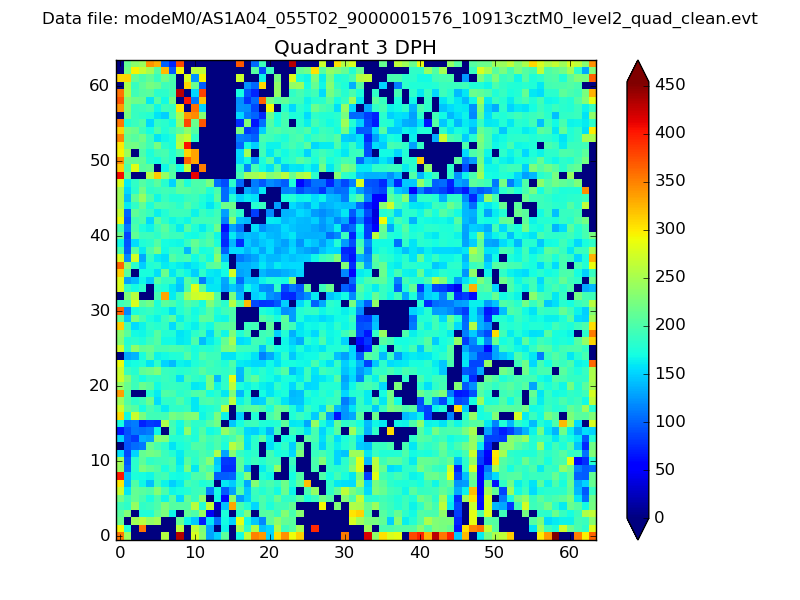 |
 |
Quadrant C |
| Plot type | Count rate plots | Images |
|---|---|---|
| Comparison with Poisson distribution Blue bars denote a histogram of data divided into 1 sec bins. Red curve is a Poisson curve with rate = median count rate of data. |
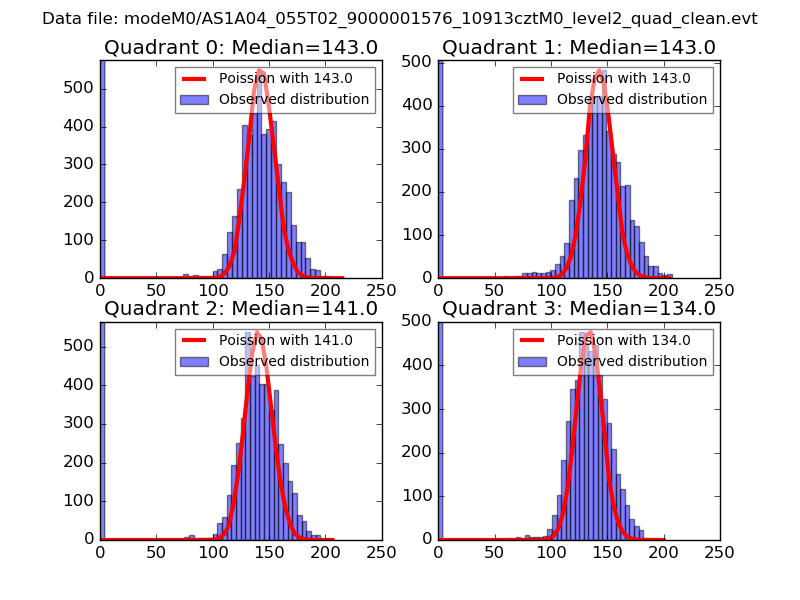 |
 |
| Quadrant-wise count rates Data is divided into 100 sec bins |
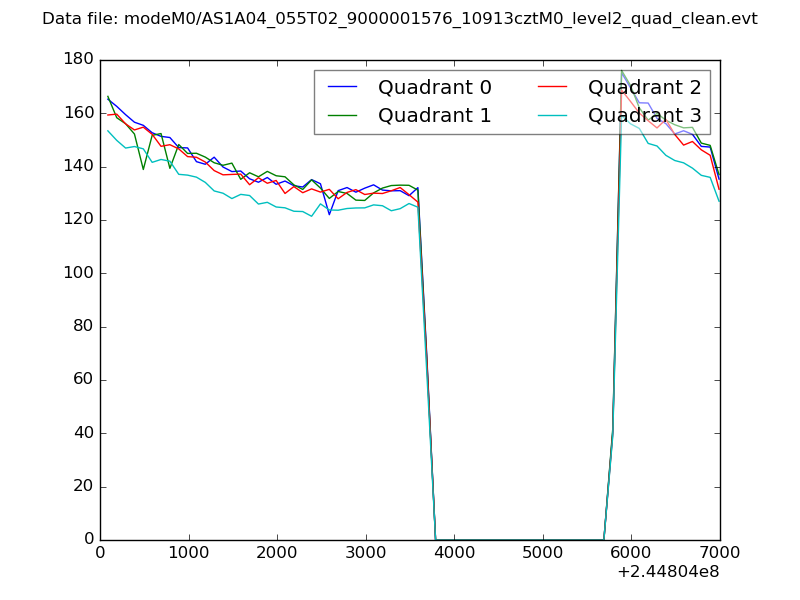 |
|
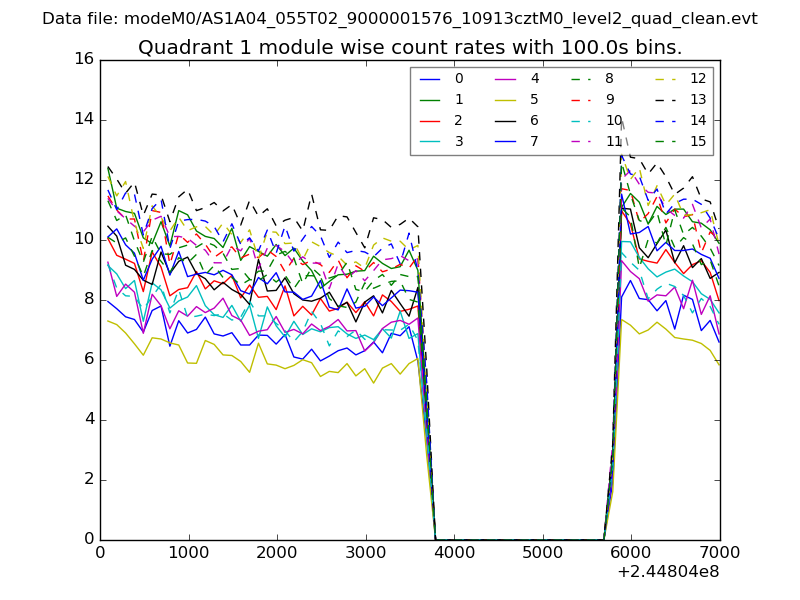
| Module-wise count rates for Quadrant A Data is divided into 100 sec bins |
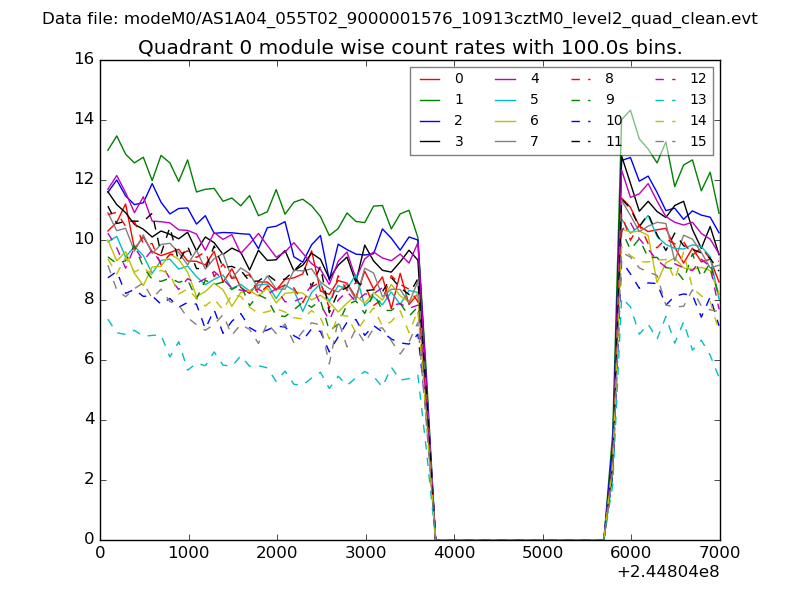 |
 |
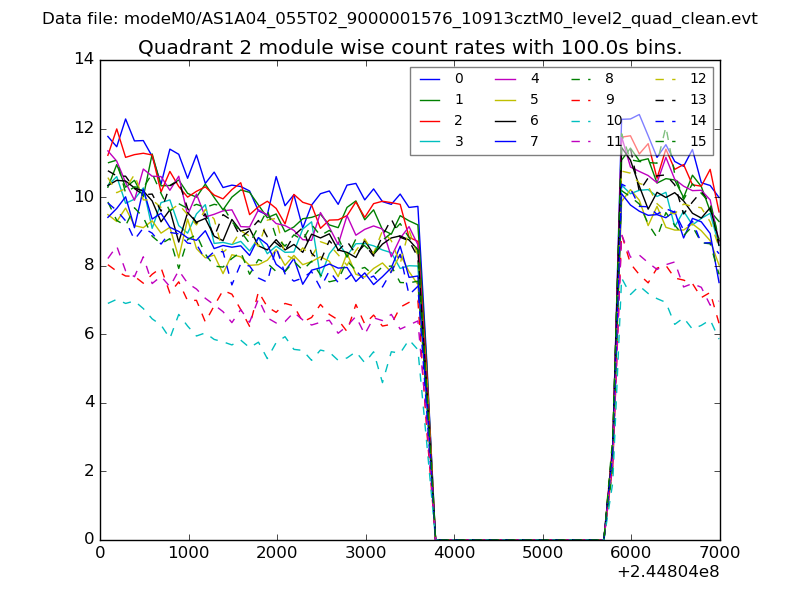
| Module-wise count rates for Quadrant B Data is divided into 100 sec bins |
 |
 |
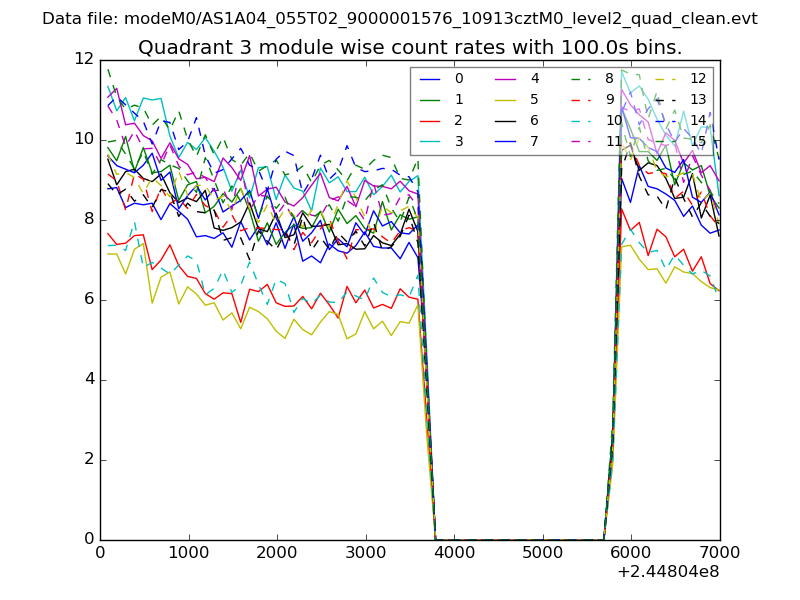
| Module-wise count rates for Quadrant C Data is divided into 100 sec bins |
 |
 |
| Module-wise count rates for Quadrant D Data is divided into 100 sec bins |
 |
 |
| Parameter | Plot |
|---|---|
| CZT HV Monitor | 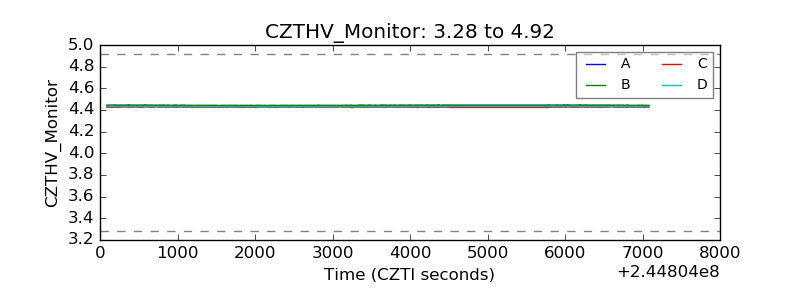 |
| D_VDD | 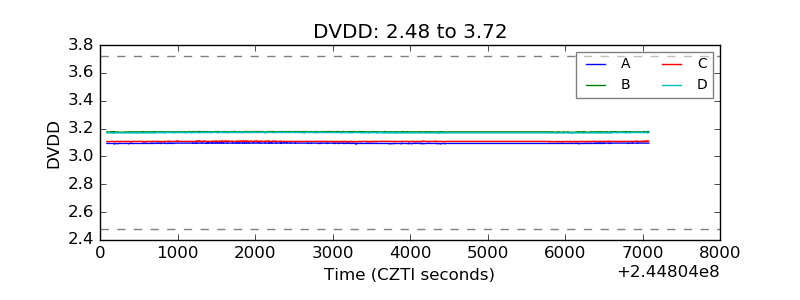 |
| Temperature 1 | 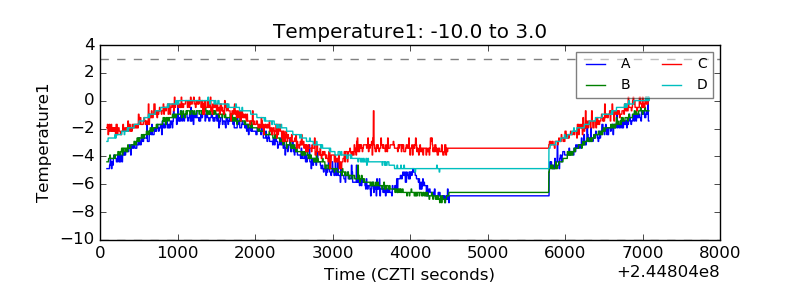 |
| Veto HV Monitor | 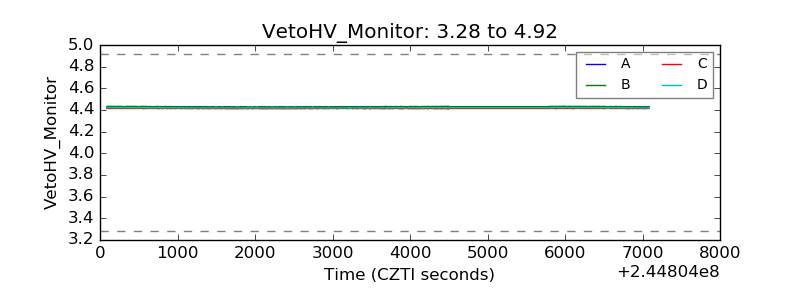 |
| Veto LLD | 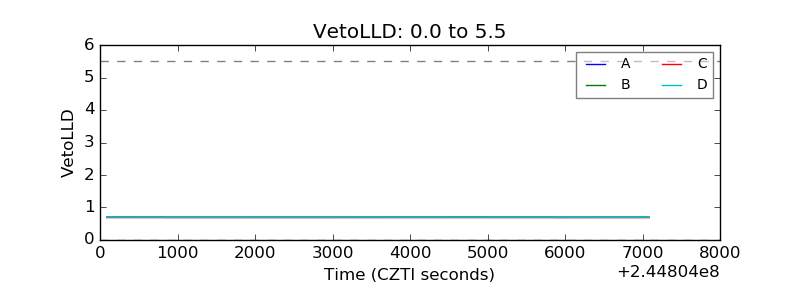 |
| Alpha Counter | 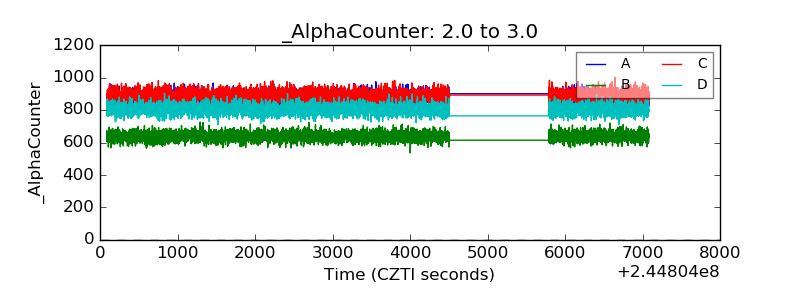 |
| _CPM_Rate | 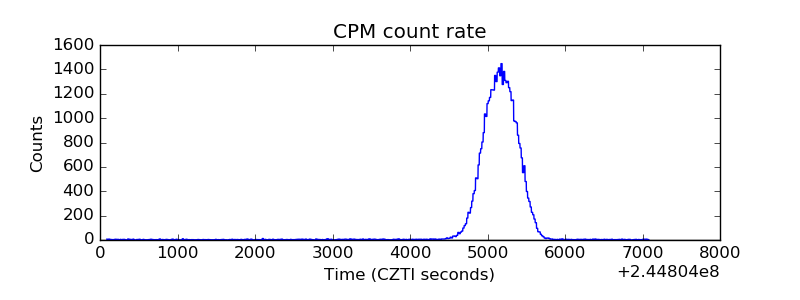 |
| CZT Counter | 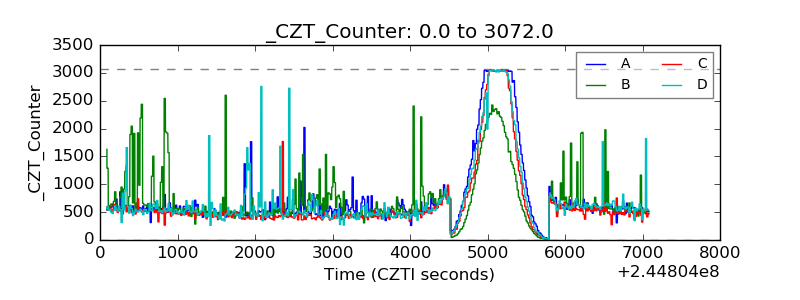 |
| +2.5 Volts monitor |  |
| +5 Volts monitor |  |
| _ROLL_ROT | 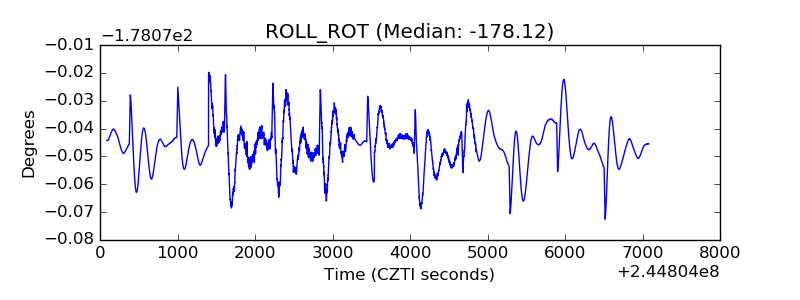 |
| _Roll_DEC | 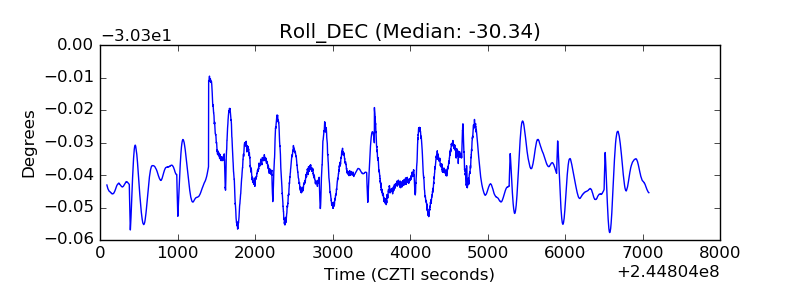 |
| _Roll_RA | 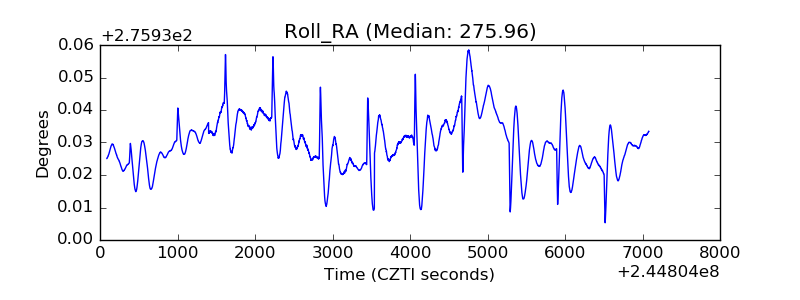 |
| Veto Counter | 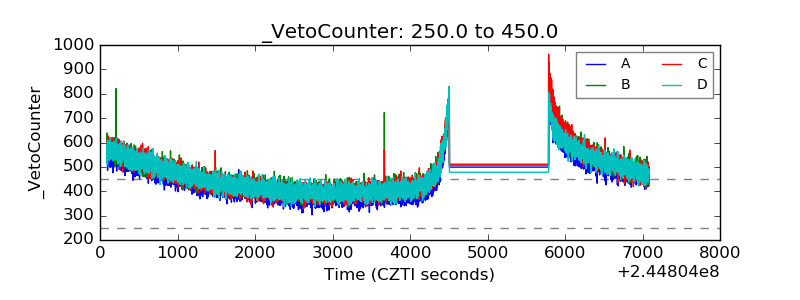 |