| Param | Original file | Final file |
|---|---|---|
| Filename | modeM0/AS1A04_055T02_9000001576_10915cztM0_level2.evt | modeM0/AS1A04_055T02_9000001576_10915cztM0_level2_quad_clean.evt |
| Size (bytes) | 414,590,400 | 79,632,000 |
| Size | 395.4 MB | 75.9 MB |
| Events in quadrant A | 3,159,164 | 511,070 |
| Events in quadrant B | 3,545,999 | 512,066 |
| Events in quadrant C | 2,586,070 | 506,220 |
| Events in quadrant D | 2,873,849 | 480,336 |
| Mode M9 | |||
|---|---|---|---|
| Quadrant | BADHDUFLAG | Total packets | Discarded packets |
| A | 0 | 10 | 0 |
| B | 0 | 10 | 0 |
| C | 0 | 10 | 0 |
| D | 0 | 10 | 0 |
| Mode SS | |||
|---|---|---|---|
| Quadrant | BADHDUFLAG | Total packets | Discarded packets |
| A | 0 | 118 | 0 |
| B | 0 | 118 | 0 |
| C | 0 | 118 | 0 |
| D | 0 | 118 | 0 |
| Mode M0 | |||
|---|---|---|---|
| Quadrant | BADHDUFLAG | Total packets | Discarded packets |
| A | 0 | 13064 | 2 |
| B | 0 | 14264 | 1 |
| C | 0 | 11794 | 1 |
| D | 0 | 12480 | 1 |
| Quadrant | Total seconds | Saturated seconds | Saturation percentage |
|---|---|---|---|
| A | 5742 | 122 | 2.124695% |
| B | 5742 | 246 | 4.284222% |
| C | 5742 | 25 | 0.435388% |
| D | 5742 | 61 | 1.062348% |
Noise dominated data is calculated using 1-second bins in cleaned event files. If a bin has >2000 counts, and if more than 50% of those come from <1% of pixels, then it is considered to be noise-dominated and hence unusable.
| Quadrant | # 1 sec bins | Bins with >0 counts | Bins with >2000 counts | High rate bins dominated by noise | Noise dominated (total time) | Noise dominated (detector-on time) | Marked lightcurve |
|---|---|---|---|---|---|---|---|
| A | 6787 | 5743 | 30 | 30 | 0.44% | 0.52% | 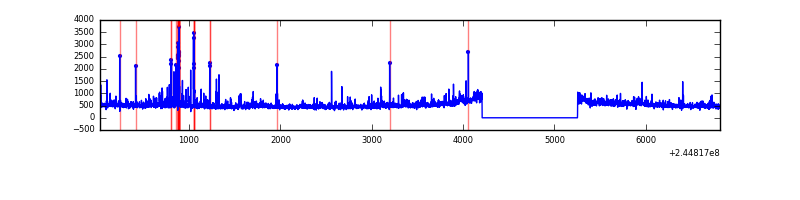 |
| B | 6787 | 5743 | 119 | 119 | 1.75% | 2.07% | 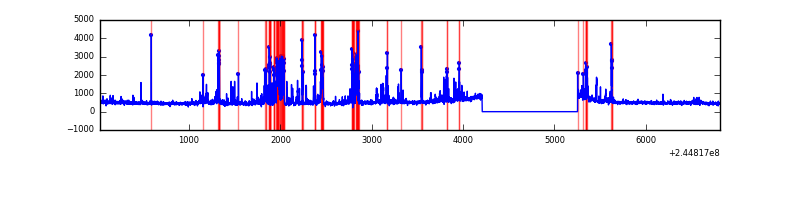 |
| C | 6787 | 5743 | 0 | 0 | 0.00% | 0.00% | 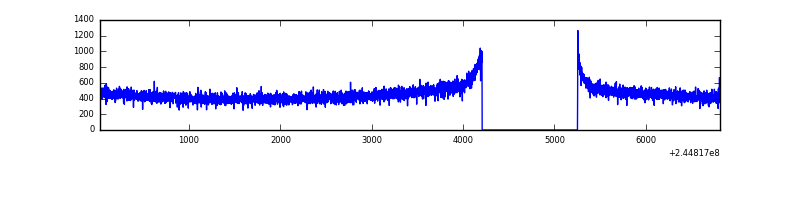 |
| D | 6787 | 5743 | 24 | 24 | 0.35% | 0.42% | 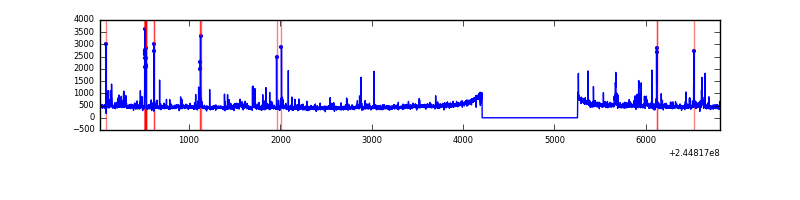 |
Top three noisy pixels from each quadrant. If the there are fewer than three noisy pixels in the level2.evt file, extra rows are filled as -1
| Pixel properties | Quadrant properties | ||||||
|---|---|---|---|---|---|---|---|
| Quadrant | DetID | PixID | Counts | Sigma | Mean | Median | Sigma |
| A | 13 | 251 | 422121 | 2973.66 | 693 | 679 | 141.7 |
| A | 8 | 5 | 35495 | 245.66 | 693 | 679 | 141.7 |
| A | 3 | 1 | 12595 | 84.08 | 693 | 679 | 141.7 |
| B | 4 | 239 | 746724 | 5647.59 | 688 | 672 | 132.1 |
| B | 0 | 214 | 36957 | 274.68 | 688 | 672 | 132.1 |
| B | 11 | 51 | 28855 | 213.34 | 688 | 672 | 132.1 |
| C | 13 | 61 | 5010 | 28.19 | 662 | 664 | 154.2 |
| C | 3 | 202 | 1693 | 6.67 | 662 | 664 | 154.2 |
| C | 14 | 234 | 1682 | 6.6 | 662 | 664 | 154.2 |
| D | 13 | 104 | 78861 | 482.29 | 663 | 643 | 162.2 |
| D | 13 | 152 | 59964 | 365.77 | 663 | 643 | 162.2 |
| D | 1 | 52 | 39716 | 240.92 | 663 | 643 | 162.2 |
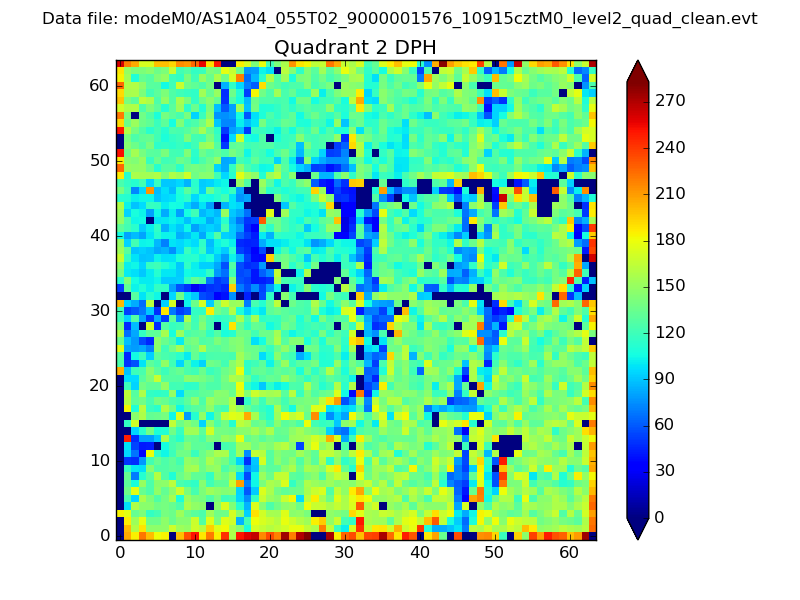
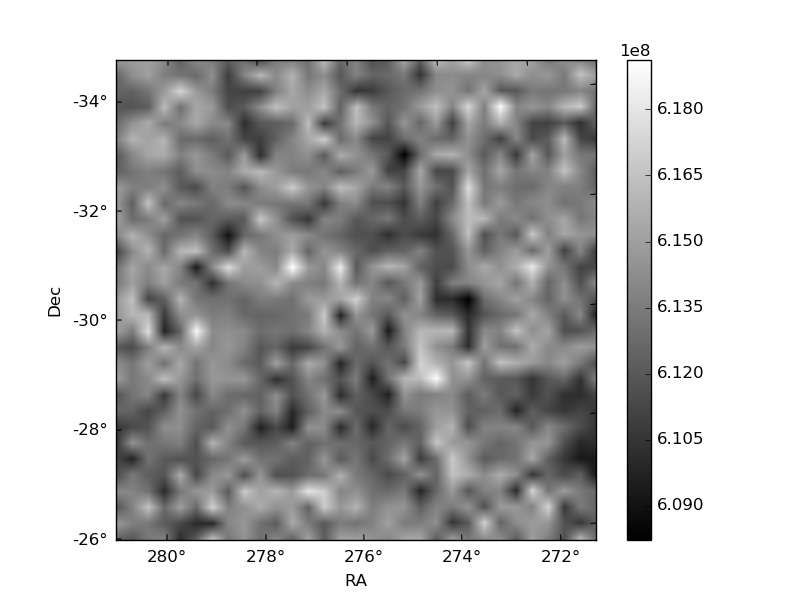
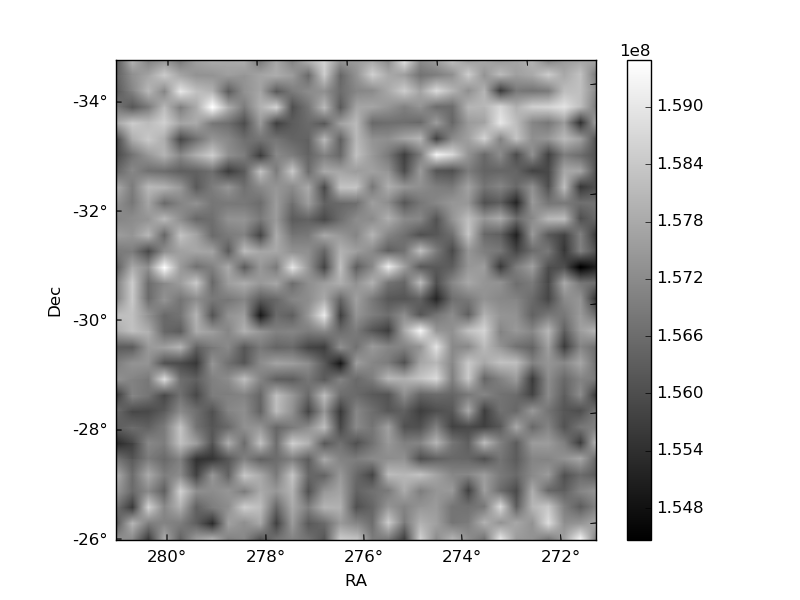
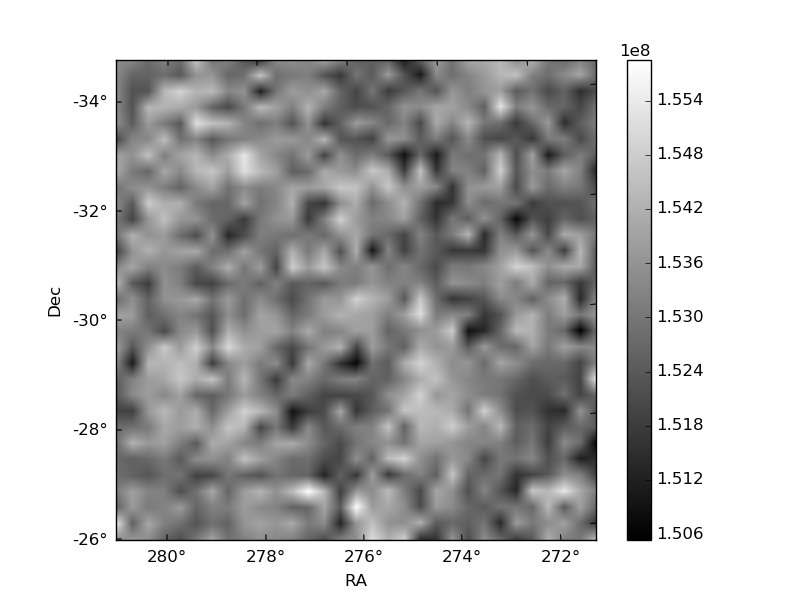
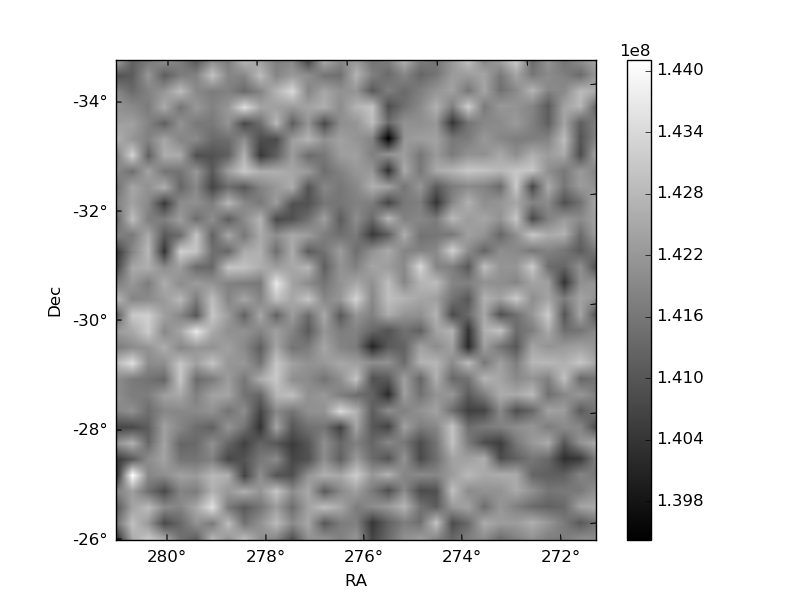
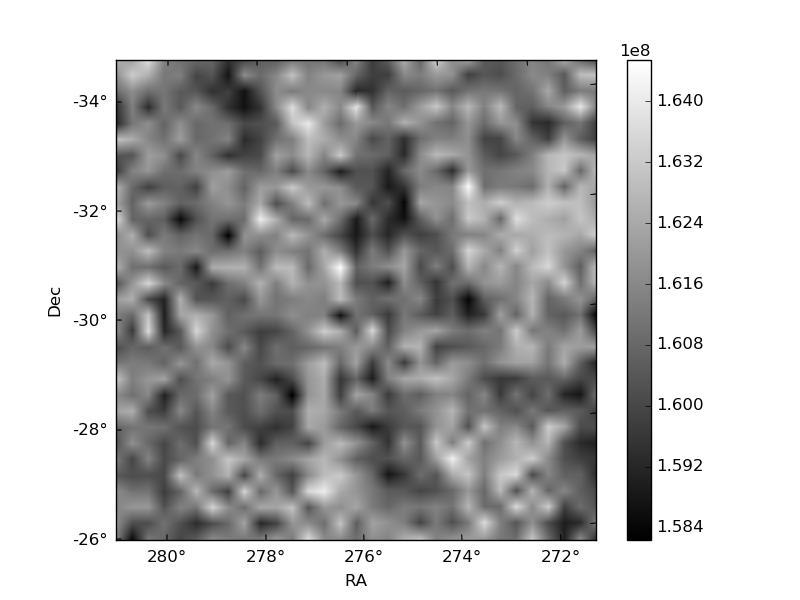
Histogram calculated using DETX and DETY for each event in the final _common_clean file
| Quadrant A | 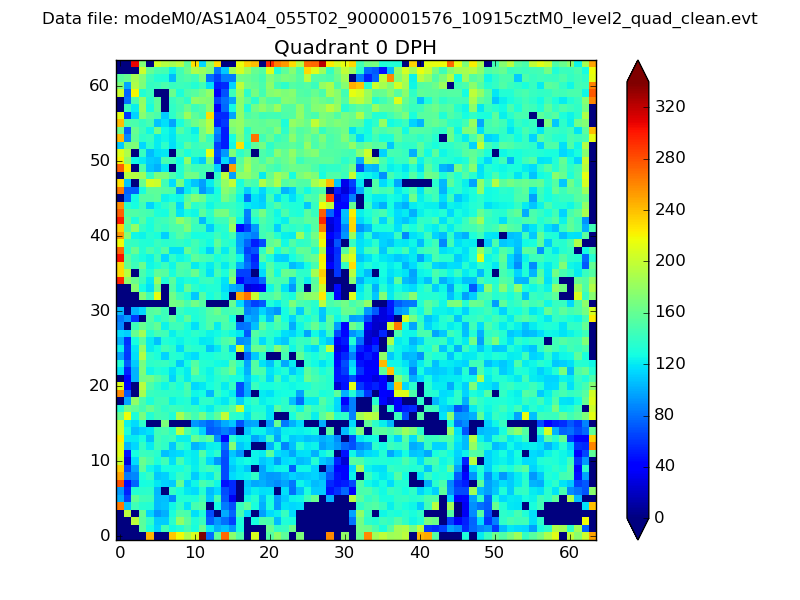 |
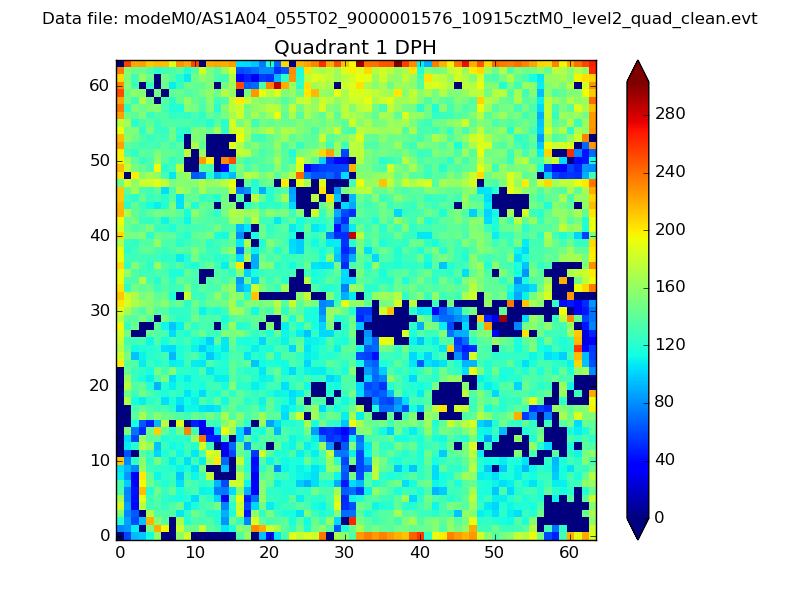 |
Quadrant B |
|---|---|---|---|
| Quadrant D | 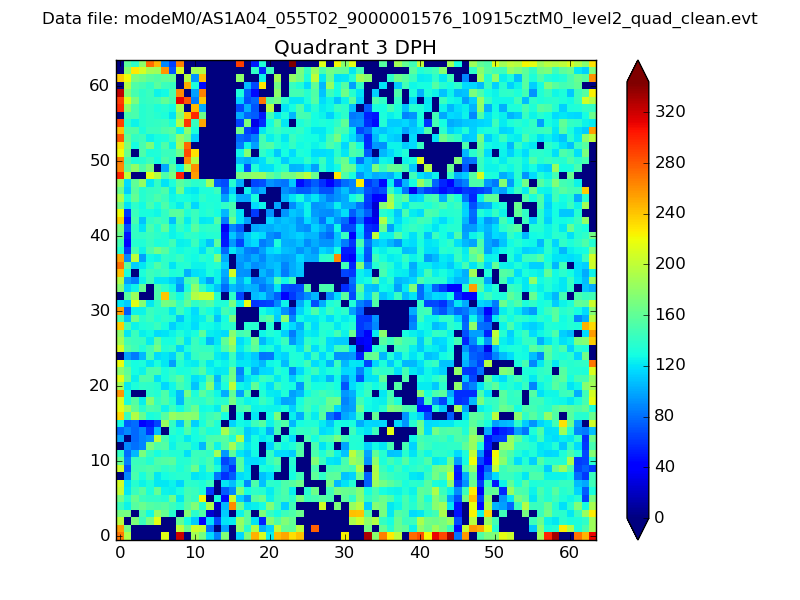 |
 |
Quadrant C |
| Plot type | Count rate plots | Images |
|---|---|---|
| Comparison with Poisson distribution Blue bars denote a histogram of data divided into 1 sec bins. Red curve is a Poisson curve with rate = median count rate of data. |
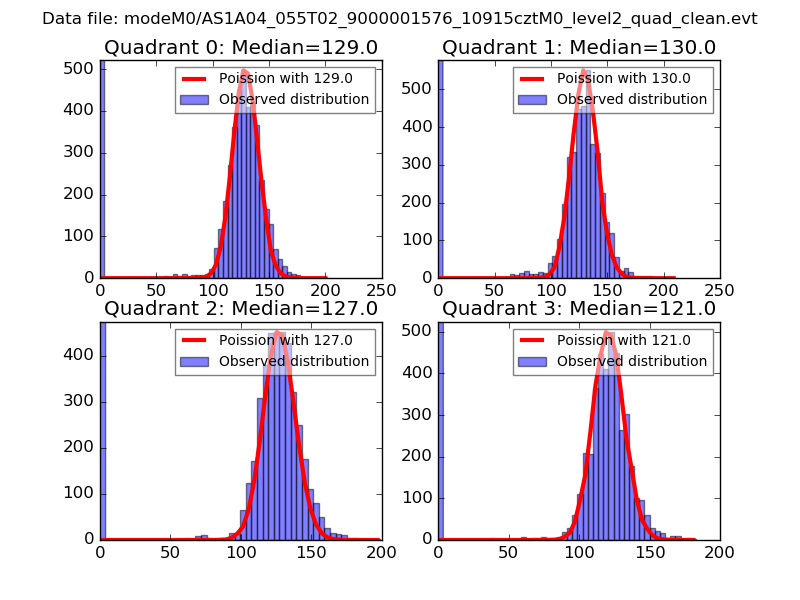 |
 |
| Quadrant-wise count rates Data is divided into 100 sec bins |
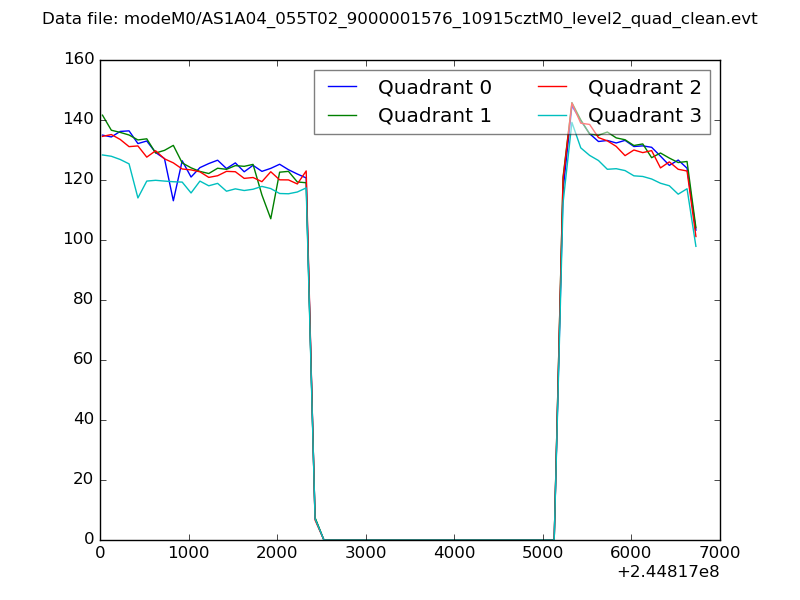 |
|
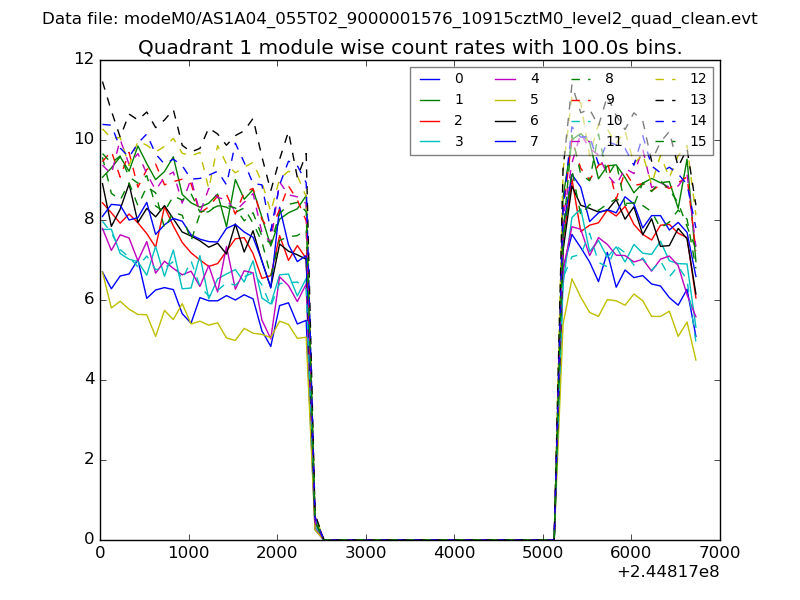
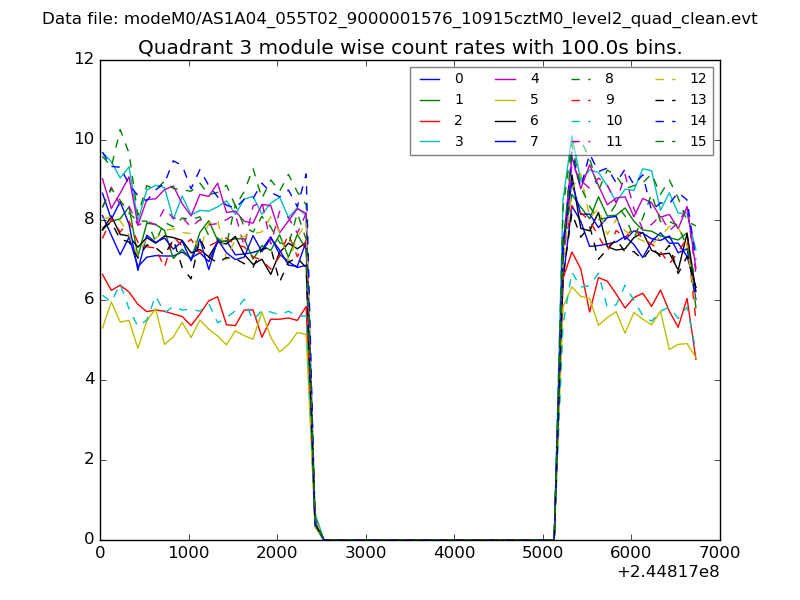
| Module-wise count rates for Quadrant A Data is divided into 100 sec bins |
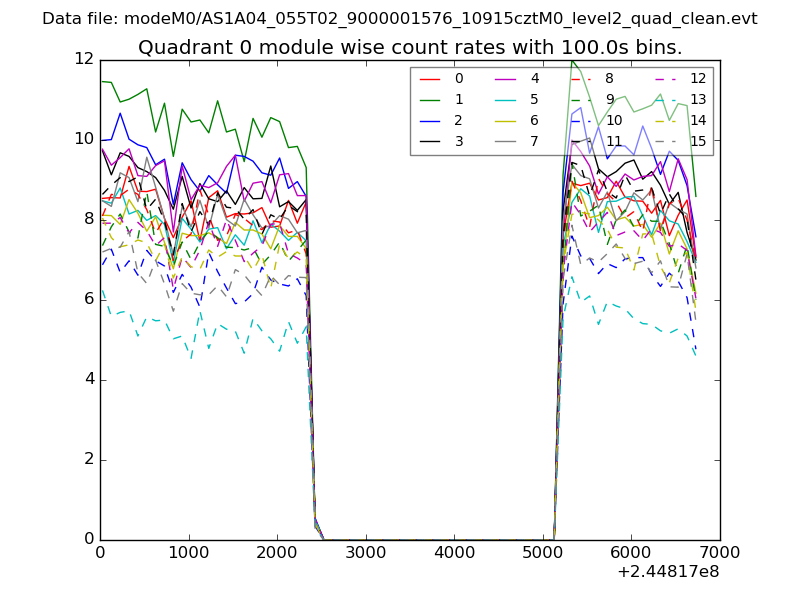 |
 |
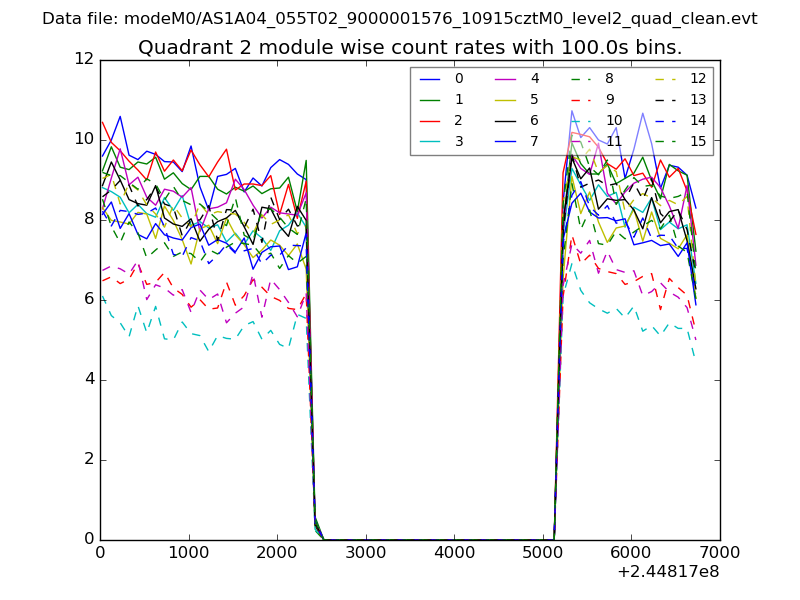
| Module-wise count rates for Quadrant B Data is divided into 100 sec bins |
 |
 |
| Module-wise count rates for Quadrant C Data is divided into 100 sec bins |
 |
 |
| Module-wise count rates for Quadrant D Data is divided into 100 sec bins |
 |
 |
| Parameter | Plot |
|---|---|
| CZT HV Monitor | 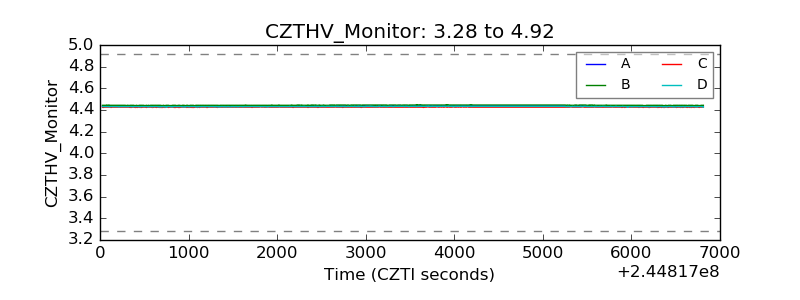 |
| D_VDD | 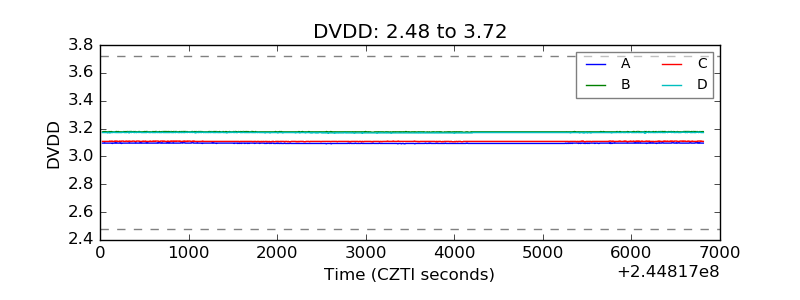 |
| Temperature 1 | 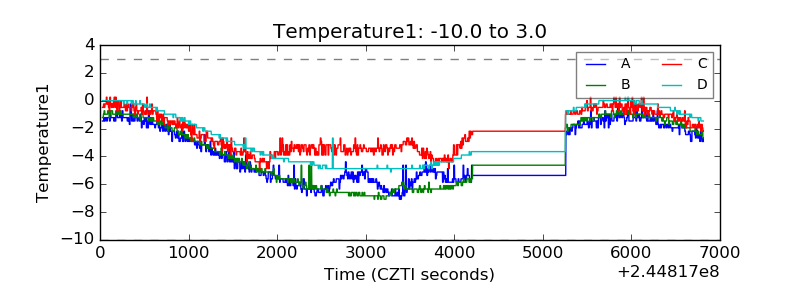 |
| Veto HV Monitor | 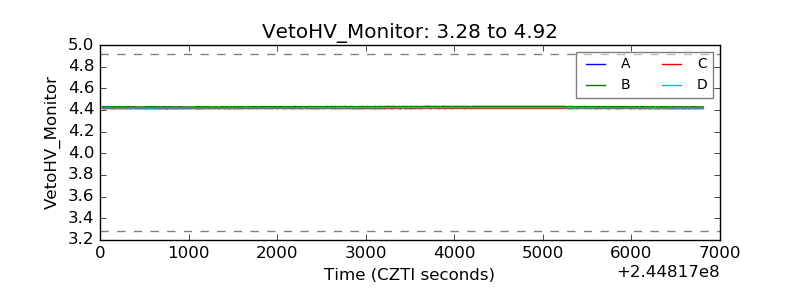 |
| Veto LLD | 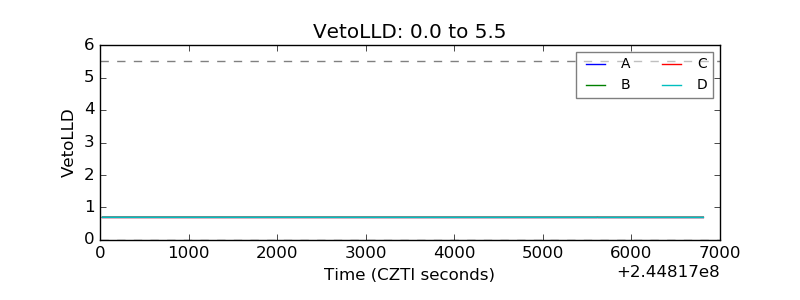 |
| Alpha Counter | 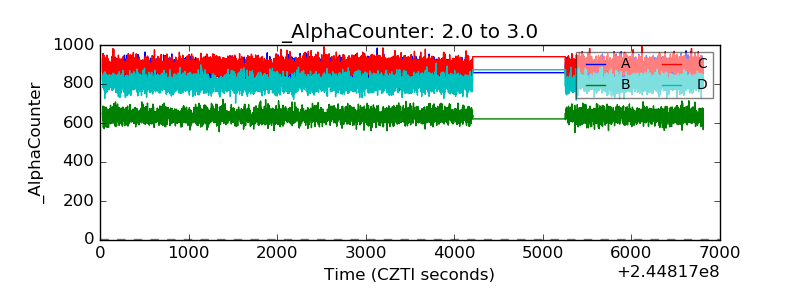 |
| _CPM_Rate | 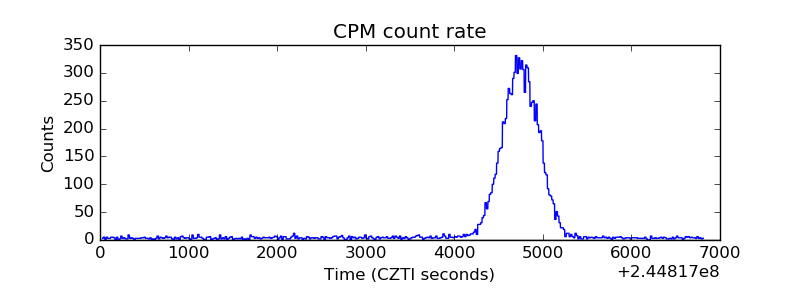 |
| CZT Counter | 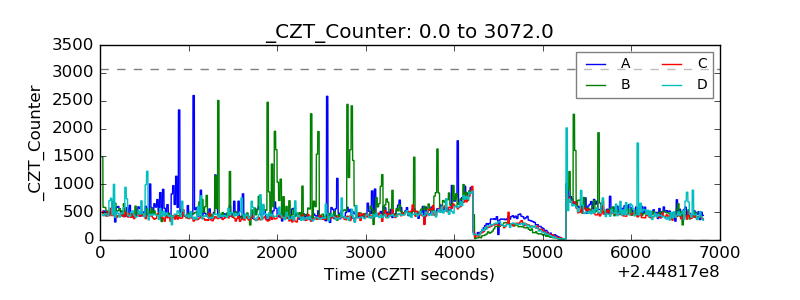 |
| +2.5 Volts monitor |  |
| +5 Volts monitor |  |
| _ROLL_ROT | 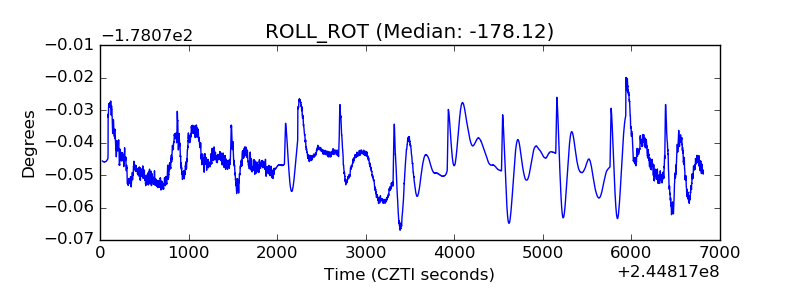 |
| _Roll_DEC | 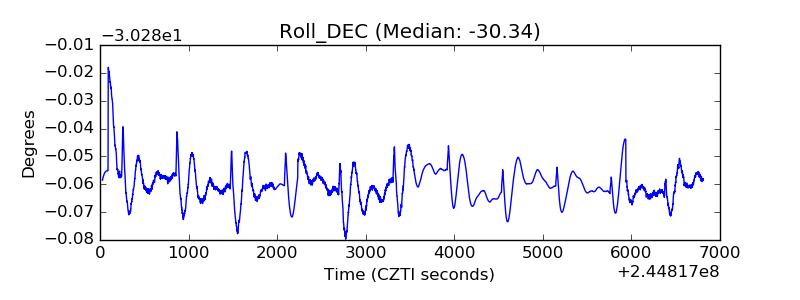 |
| _Roll_RA | 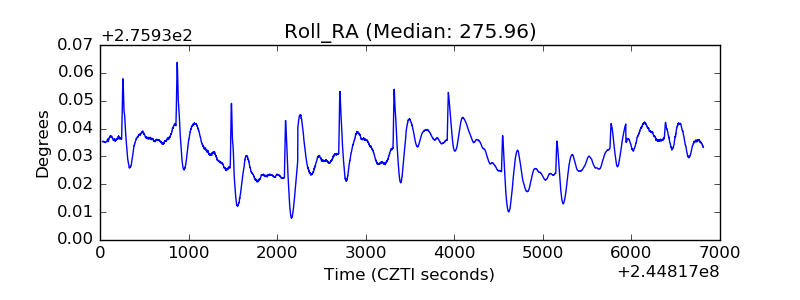 |
| Veto Counter | 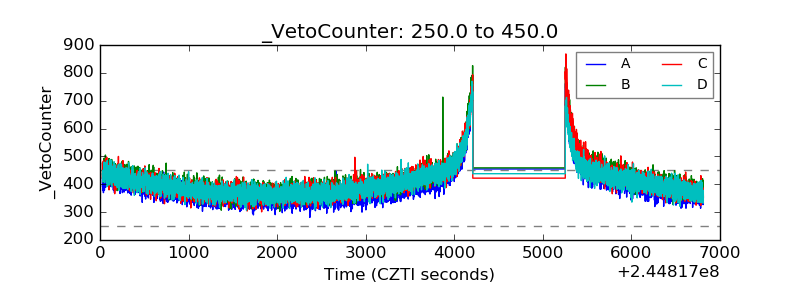 |