| Param | Original file | Final file |
|---|---|---|
| Filename | modeM0/AS1A04_055T02_9000001576_10916cztM0_level2.evt | modeM0/AS1A04_055T02_9000001576_10916cztM0_level2_quad_clean.evt |
| Size (bytes) | 86,843,520 | 24,399,360 |
| Size | 82.8 MB | 23.3 MB |
| Events in quadrant A | 708,790 | 162,655 |
| Events in quadrant B | 649,220 | 163,810 |
| Events in quadrant C | 545,190 | 160,944 |
| Events in quadrant D | 635,321 | 153,359 |
| Mode SS | |||
|---|---|---|---|
| Quadrant | BADHDUFLAG | Total packets | Discarded packets |
| A | 0 | 26 | 0 |
| B | 0 | 26 | 0 |
| C | 0 | 26 | 0 |
| D | 0 | 26 | 0 |
| Mode M0 | |||
|---|---|---|---|
| Quadrant | BADHDUFLAG | Total packets | Discarded packets |
| A | 0 | 2939 | 19 |
| B | 0 | 2777 | 6 |
| C | 0 | 2615 | 12 |
| D | 0 | 2805 | 2 |
| Quadrant | Total seconds | Saturated seconds | Saturation percentage |
|---|---|---|---|
| A | 1298 | 3 | 0.231125% |
| B | 1304 | 16 | 1.226994% |
| C | 1301 | 0 | 0.000000% |
| D | 1306 | 4 | 0.306279% |
Noise dominated data is calculated using 1-second bins in cleaned event files. If a bin has >2000 counts, and if more than 50% of those come from <1% of pixels, then it is considered to be noise-dominated and hence unusable.
| Quadrant | # 1 sec bins | Bins with >0 counts | Bins with >2000 counts | High rate bins dominated by noise | Noise dominated (total time) | Noise dominated (detector-on time) | Marked lightcurve |
|---|---|---|---|---|---|---|---|
| A | 1307 | 1307 | 4 | 4 | 0.31% | 0.31% | 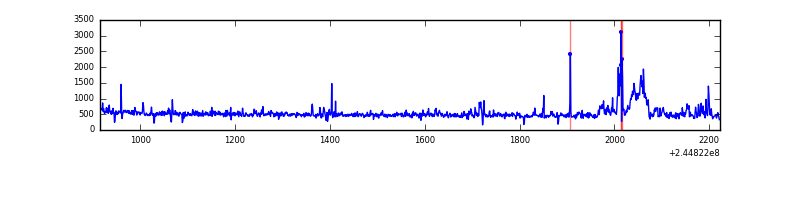 |
| B | 1307 | 1306 | 7 | 7 | 0.54% | 0.54% | 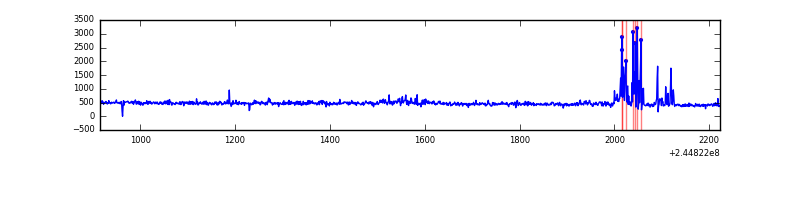 |
| C | 1307 | 1306 | 0 | 0 | 0.00% | 0.00% | 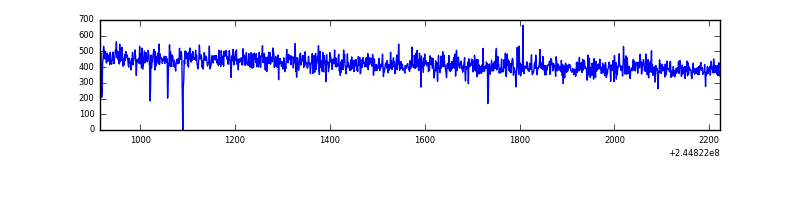 |
| D | 1307 | 1307 | 3 | 3 | 0.23% | 0.23% | 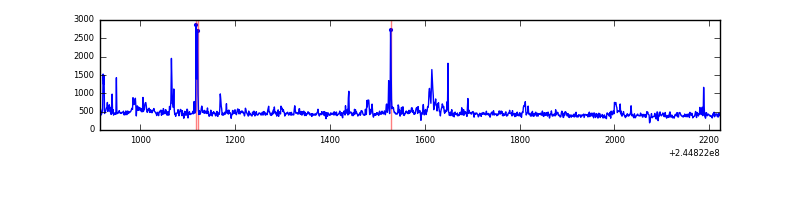 |
Top three noisy pixels from each quadrant. If the there are fewer than three noisy pixels in the level2.evt file, extra rows are filled as -1
| Pixel properties | Quadrant properties | ||||||
|---|---|---|---|---|---|---|---|
| Quadrant | DetID | PixID | Counts | Sigma | Mean | Median | Sigma |
| A | 13 | 251 | 88085 | 2721.99 | 148 | 145 | 32.3 |
| A | 5 | 112 | 37250 | 1148.5 | 148 | 145 | 32.3 |
| A | 8 | 5 | 6743 | 204.23 | 148 | 145 | 32.3 |
| B | 4 | 239 | 50730 | 1676.88 | 147 | 144 | 30.2 |
| B | 11 | 51 | 12240 | 400.97 | 147 | 144 | 30.2 |
| B | 0 | 229 | 10294 | 336.46 | 147 | 144 | 30.2 |
| C | 7 | 235 | 2082 | 57.21 | 139 | 140 | 33.9 |
| C | 13 | 61 | 1015 | 25.78 | 139 | 140 | 33.9 |
| C | 3 | 202 | 374 | 6.89 | 139 | 140 | 33.9 |
| D | 13 | 152 | 34153 | 949.47 | 140 | 136 | 35.8 |
| D | 12 | 227 | 10910 | 300.72 | 140 | 136 | 35.8 |
| D | 5 | 222 | 9645 | 265.41 | 140 | 136 | 35.8 |
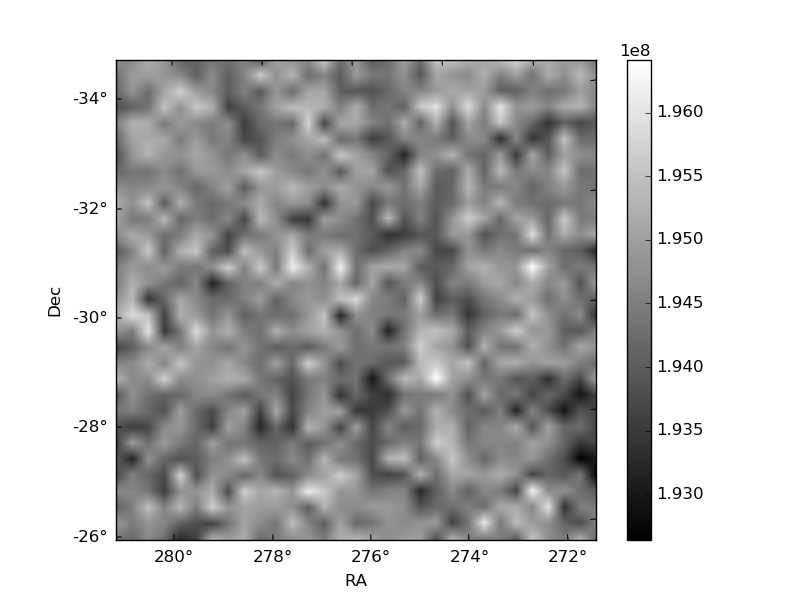
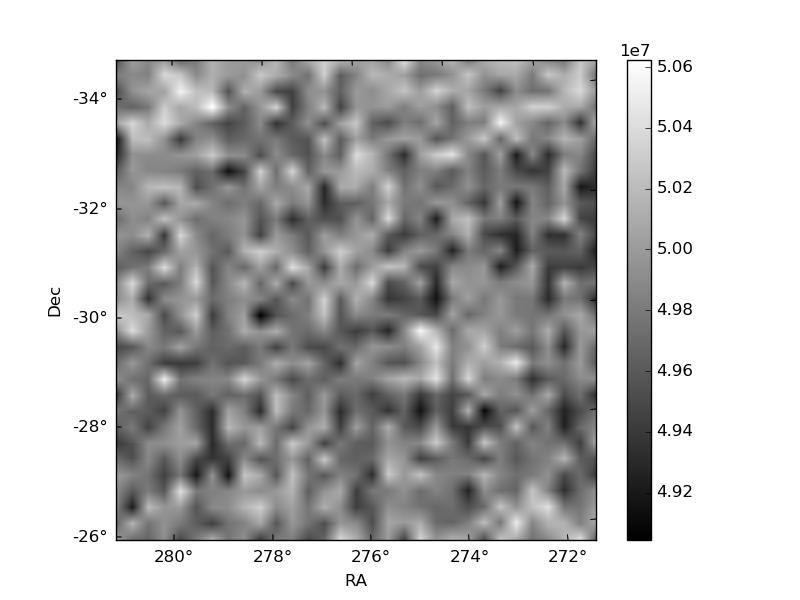
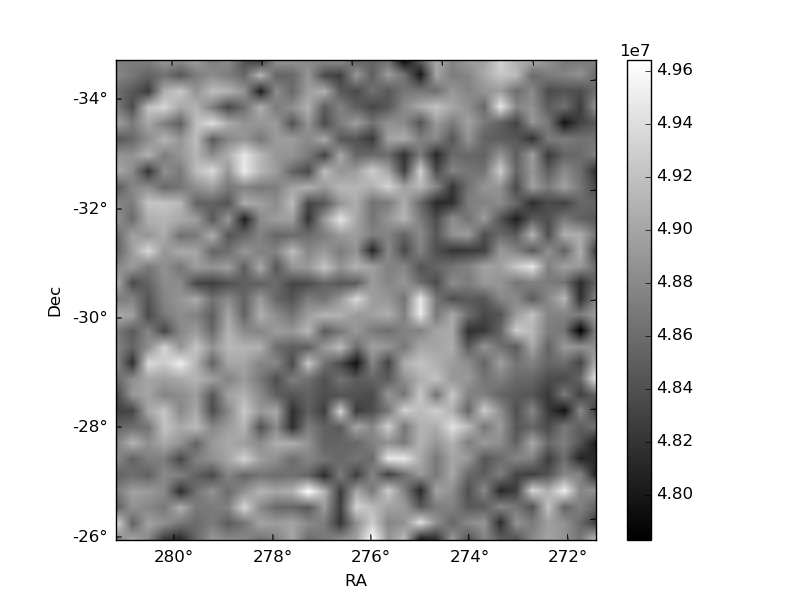
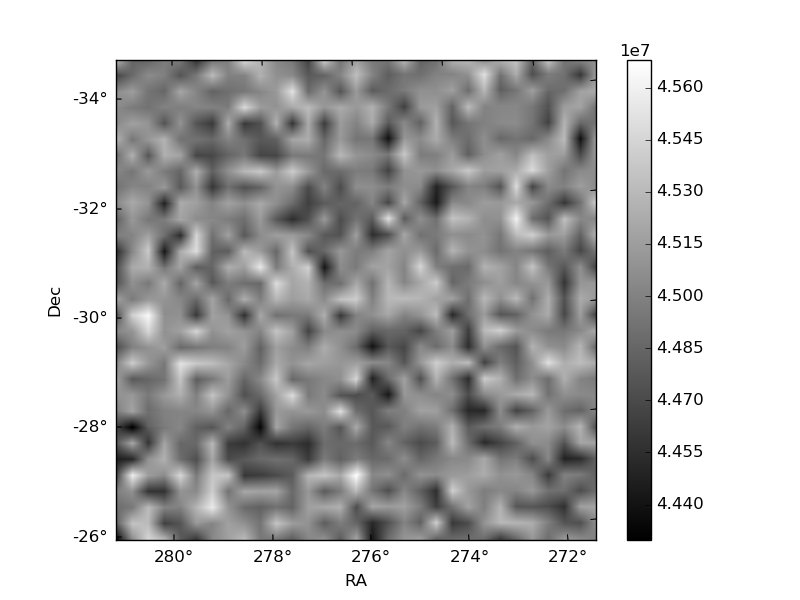
Histogram calculated using DETX and DETY for each event in the final _common_clean file
| Quadrant A | 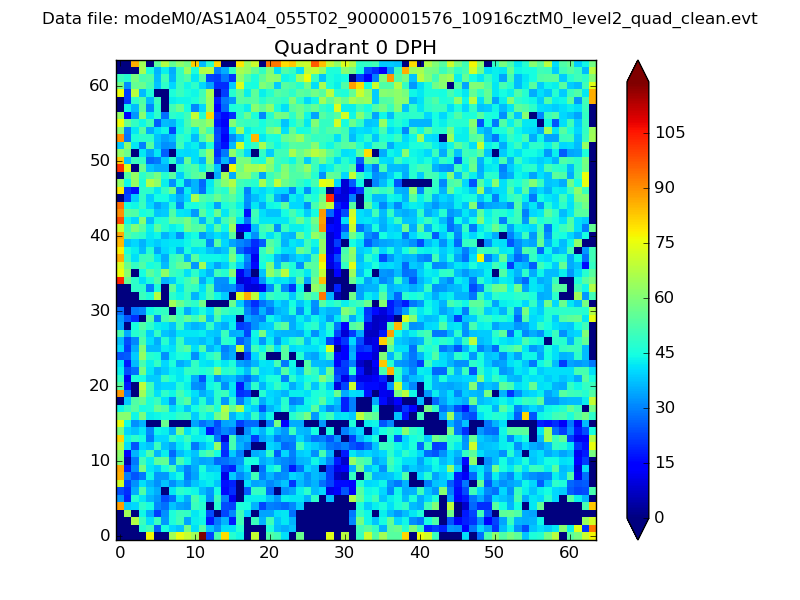 |
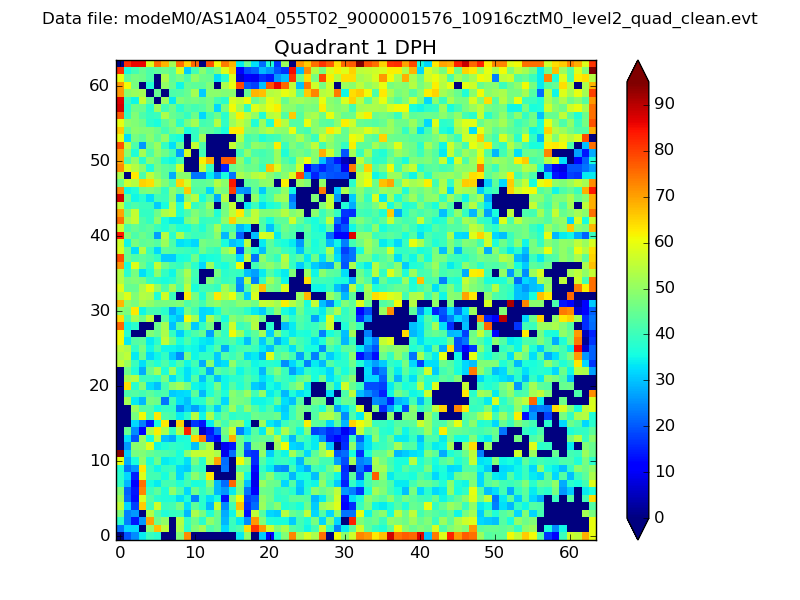 |
Quadrant B |
|---|---|---|---|
| Quadrant D | 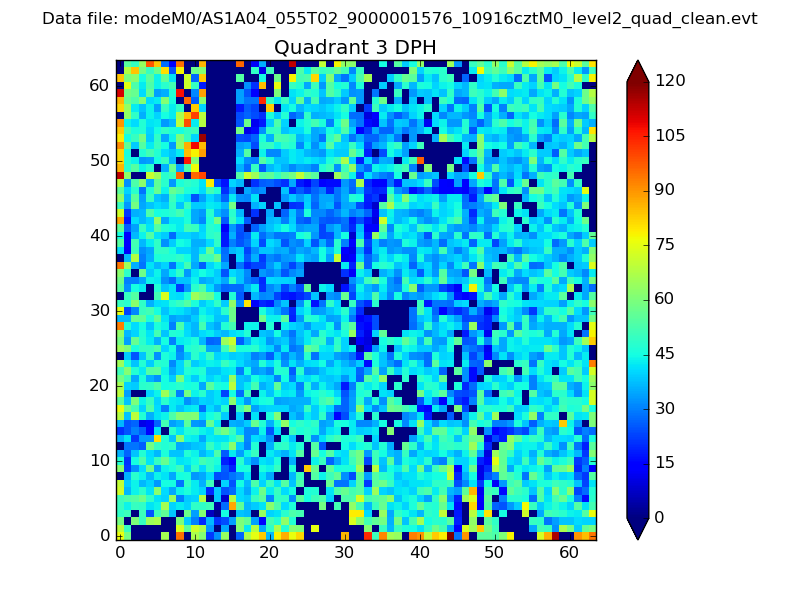 |
 |
Quadrant C |
| Plot type | Count rate plots | Images |
|---|---|---|
| Comparison with Poisson distribution Blue bars denote a histogram of data divided into 1 sec bins. Red curve is a Poisson curve with rate = median count rate of data. |
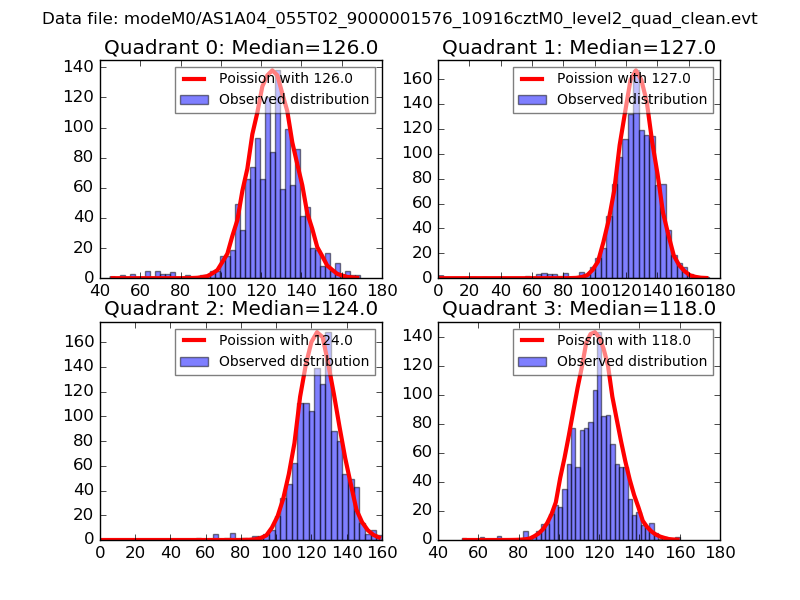 |
 |
| Quadrant-wise count rates Data is divided into 100 sec bins |
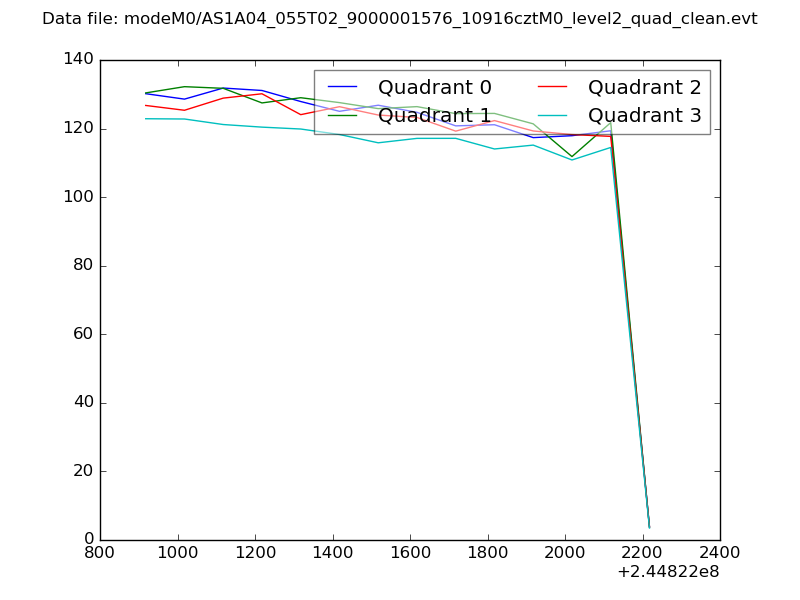 |
|
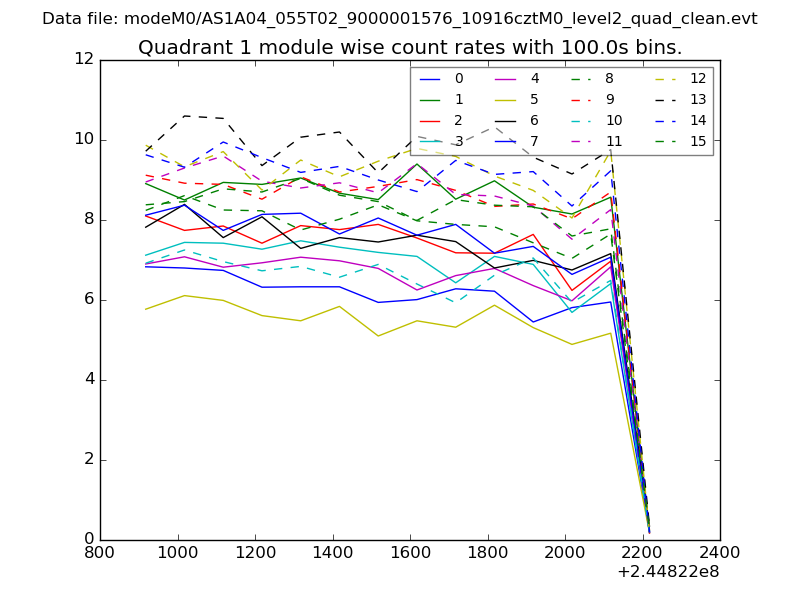
| Module-wise count rates for Quadrant A Data is divided into 100 sec bins |
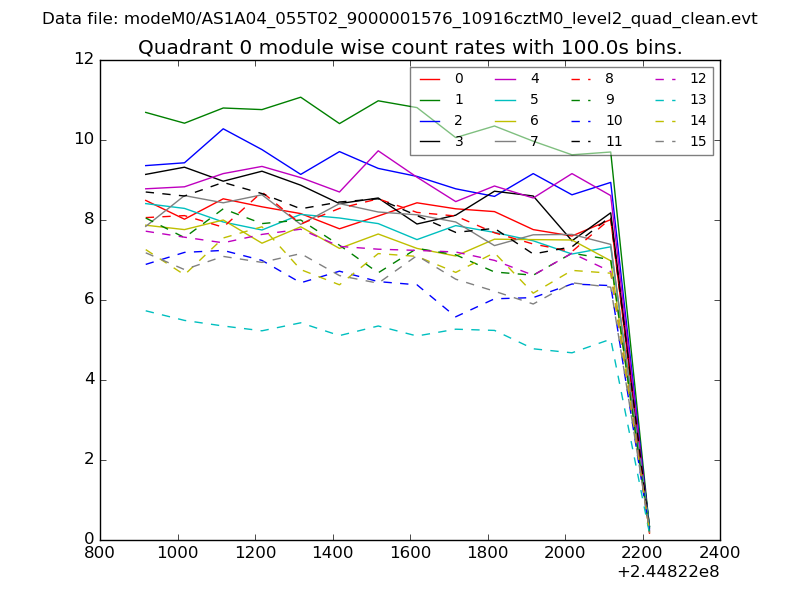 |
 |
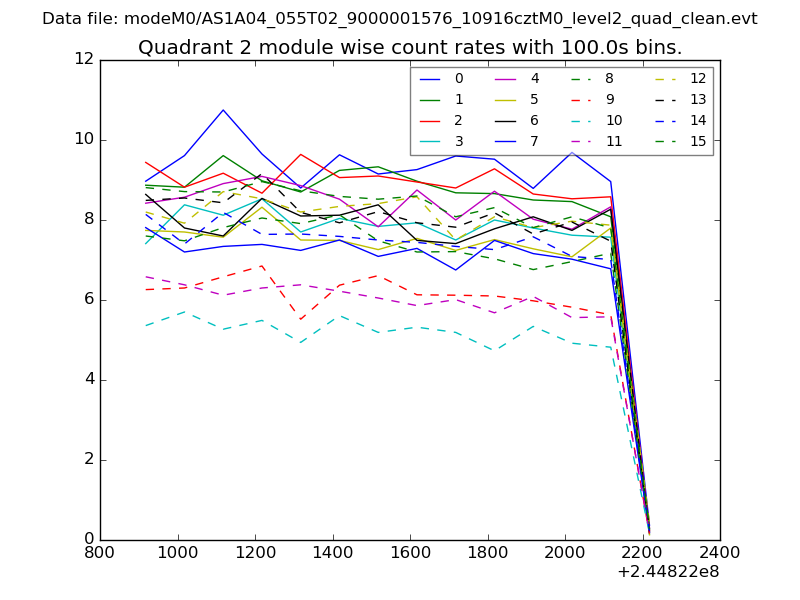
| Module-wise count rates for Quadrant B Data is divided into 100 sec bins |
 |
 |
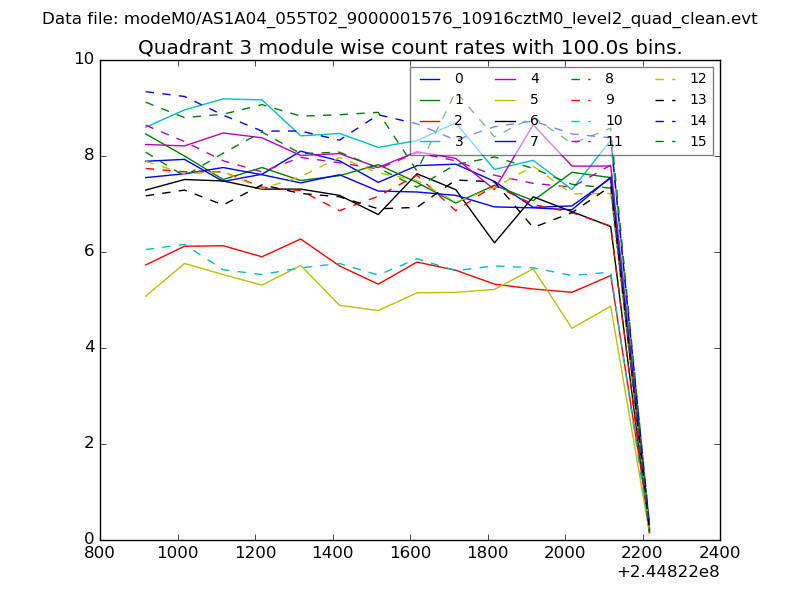
| Module-wise count rates for Quadrant C Data is divided into 100 sec bins |
 |
 |
| Module-wise count rates for Quadrant D Data is divided into 100 sec bins |
 |
 |
| Parameter | Plot |
|---|---|
| CZT HV Monitor |  |
| D_VDD | 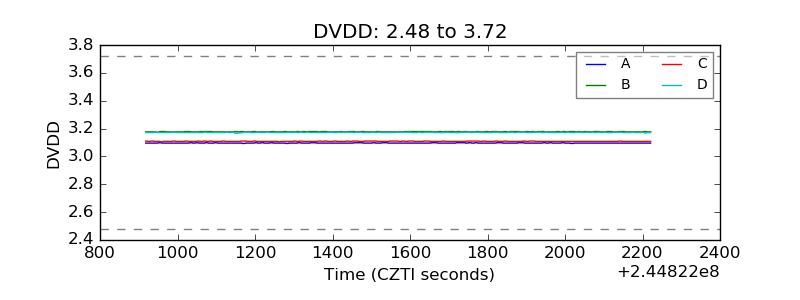 |
| Temperature 1 | 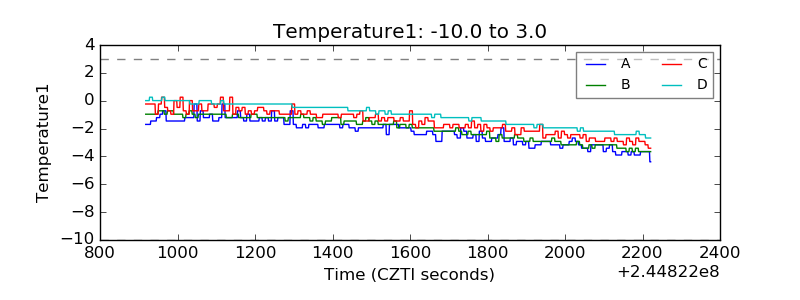 |
| Veto HV Monitor | 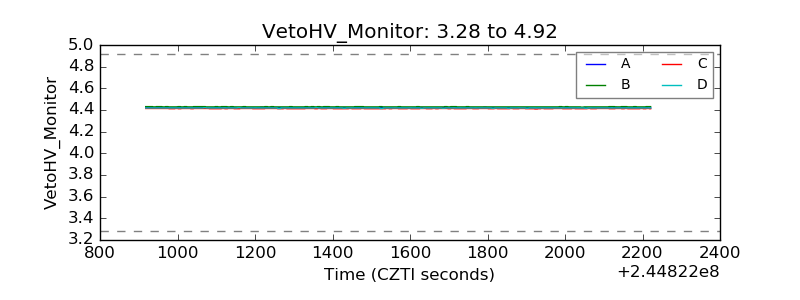 |
| Veto LLD |  |
| Alpha Counter | 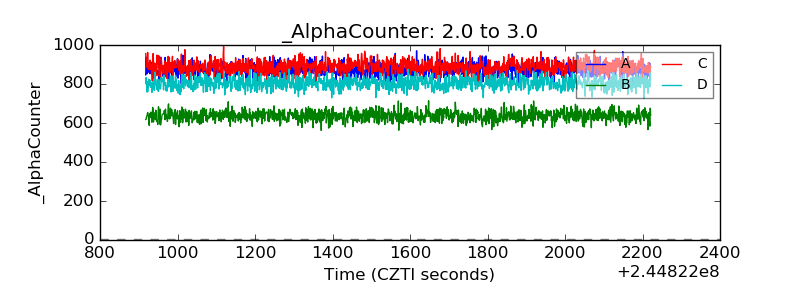 |
| _CPM_Rate | 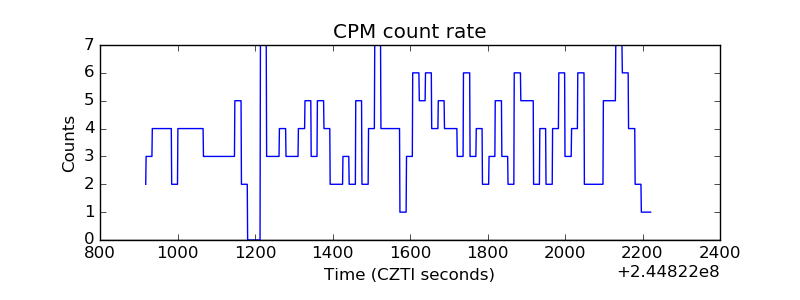 |
| CZT Counter | 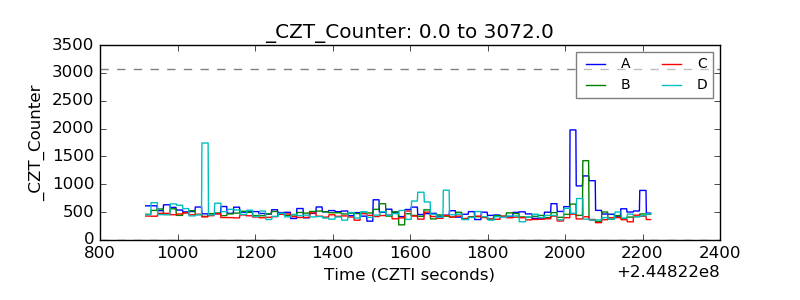 |
| +2.5 Volts monitor |  |
| +5 Volts monitor |  |
| _ROLL_ROT | 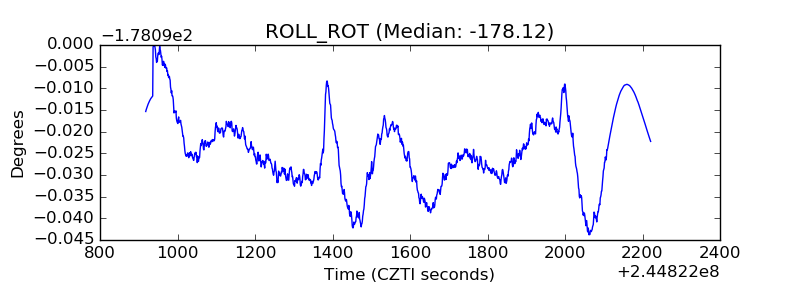 |
| _Roll_DEC | 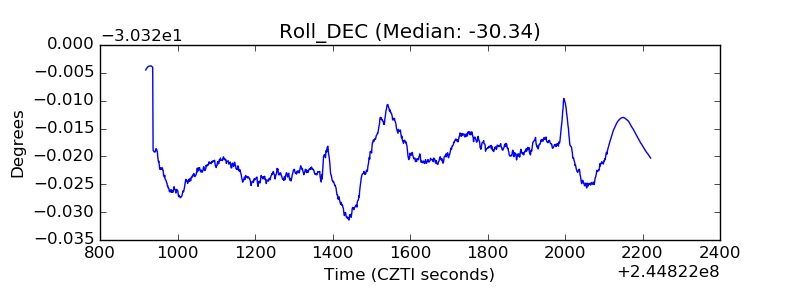 |
| _Roll_RA | 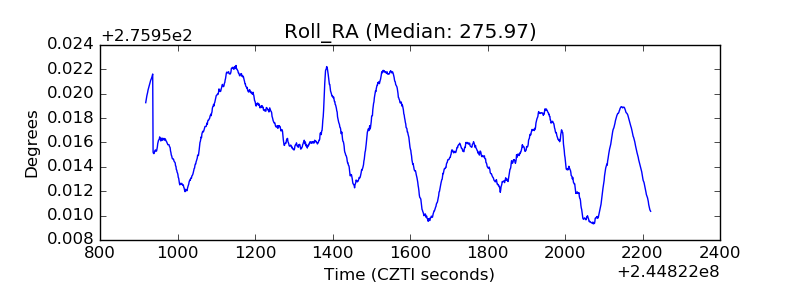 |
| Veto Counter | 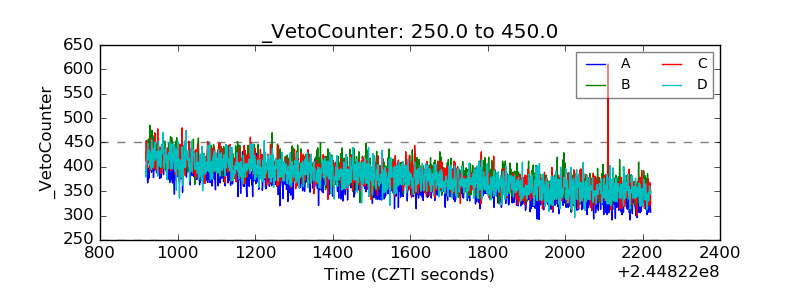 |